Races in Henderson, Nevada (NV) Detailed Stats
Data:
Races - White alone (%)
Races - White alone (% change since 2000)
Races - Black alone (%)
Races - Black alone (% change since 2000)
Races - American Indian alone (%)
Races - American Indian alone (% change since 2000)
Races - Asian alone (%)
Races - Asian alone (% change since 2000)
Races - Hispanic (%)
Races - Hispanic (% change since 2000)
Races - Native Hawaiian and Other Pacific Islander alone (%)
Races - Native Hawaiian and Other Pacific Islander alone (% change since 2000)
Races - Two or more races(%)
Races - Two or more races(% change since 2000)
Races - Other race alone (%)
Races - Other race alone (% change since 2000)
Racial diversity
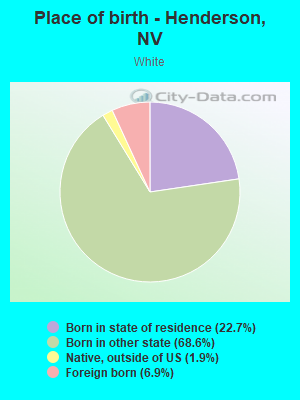
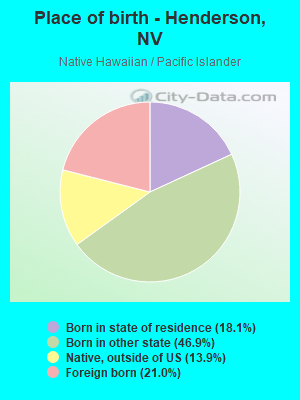
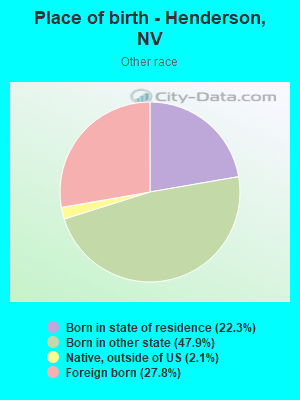
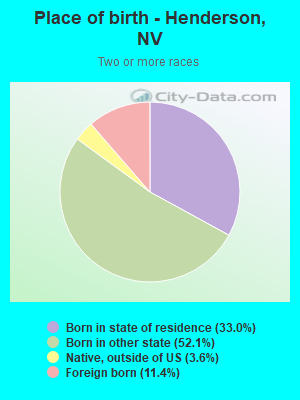
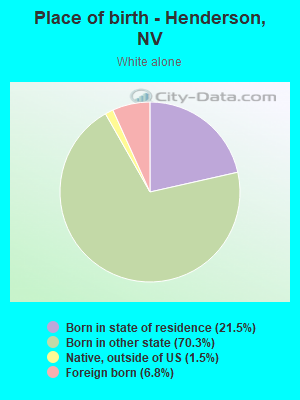
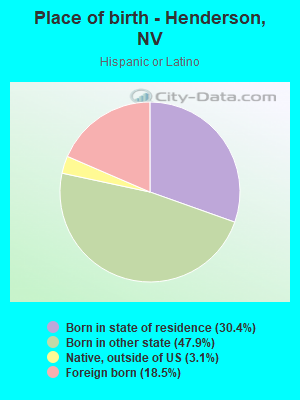
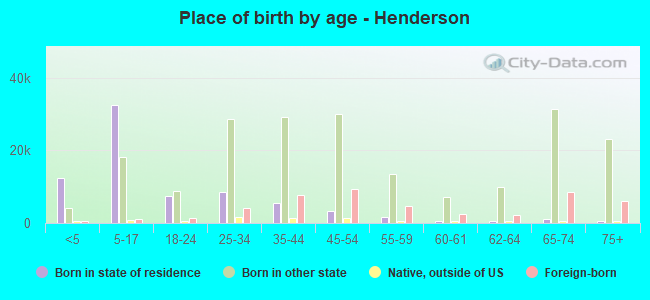
Place of birth - Born in state of residence (%)
Place of birth - Born in state of residence (%) - White
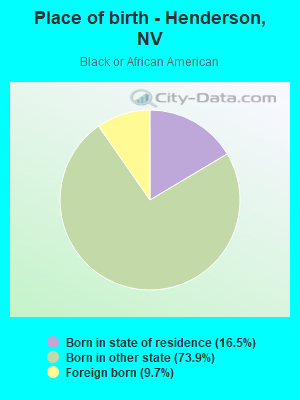
Place of birth - Born in state of residence (%) - Black or African American
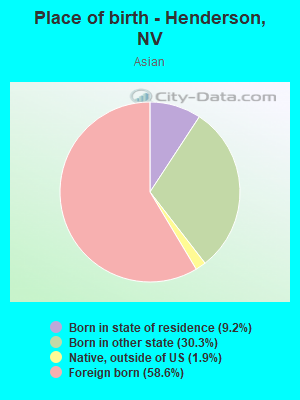
Place of birth - Born in state of residence (%) - Asian
Place of birth - Born in state of residence (%) - Hispanic or Latino
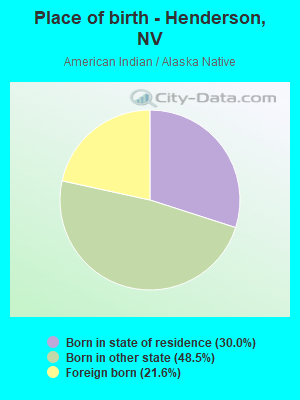
Place of birth - Born in state of residence (%) - American Indian and Alaska Native
Place of birth - Born in state of residence (%) - Multirace
Place of birth - Born in state of residence (%) - Other Race
Place of birth - Born in other state (%)
Place of birth - Born in other state (%) - White
Place of birth - Born in other state (%) - Black or African American
Place of birth - Born in other state (%) - Asian
Place of birth - Born in other state (%) - Hispanic or Latino
Place of birth - Born in other state (%) - American Indian and Alaska Native
Place of birth - Born in other state (%) - Multirace
Place of birth - Born in other state (%) - Other Race
Place of birth - Native, outside of US (%)
Place of birth - Native, outside of US (%) - White
Place of birth - Native, outside of US (%) - Black or African American
Place of birth - Native, outside of US (%) - Asian
Place of birth - Native, outside of US (%) - Hispanic or Latino
Place of birth - Native, outside of US (%) - American Indian and Alaska Native
Place of birth - Native, outside of US (%) - Multirace
Place of birth - Native, outside of US (%) - Other Race
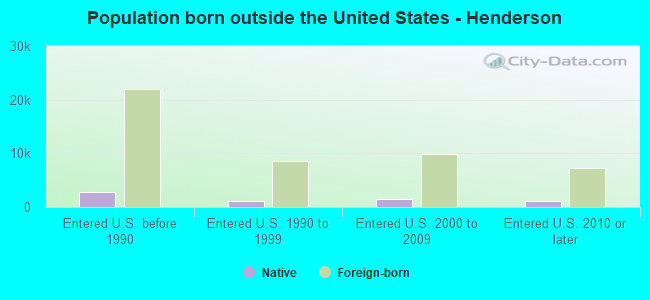
Place of birth - Foreign born (%)
Place of birth - Foreign born (%) - White
Place of birth - Foreign born (%) - Black or African American
Place of birth - Foreign born (%) - Asian
Place of birth - Foreign born (%) - Hispanic or Latino
Place of birth - Foreign born (%) - American Indian and Alaska Native
Place of birth - Foreign born (%) - Multirace
Place of birth - Foreign born (%) - Other Race
Residents speaking English at home (%)
Residents speaking English at home - Born in the United States (%)
Residents speaking English at home - Native, born elsewhere (%)
Residents speaking English at home - Foreign born (%)
Residents speaking Spanish at home (%)
Residents speaking Spanish at home - Born in the United States (%)
Residents speaking Spanish at home - Native, born elsewhere (%)
Residents speaking Spanish at home - Foreign born (%)
Residents speaking other language at home (%)
Residents speaking other language at home - Born in the United States (%)
Residents speaking other language at home - Native, born elsewhere (%)
Residents speaking other language at home - Foreign born (%)
Marital status - Never married (%)
Marital status - Now married (%)
Marital status - Separated (%)
Marital status - Widowed (%)
Marital status - Divorced (%)
Ancestries Reported - Arab (%)
Ancestries Reported - Czech (%)
Ancestries Reported - Danish (%)
Ancestries Reported - Dutch (%)
Ancestries Reported - English (%)
Ancestries Reported - French (%)
Ancestries Reported - French Canadian (%)
Ancestries Reported - German (%)
Ancestries Reported - Greek (%)
Ancestries Reported - Hungarian (%)
Ancestries Reported - Irish (%)
Ancestries Reported - Italian (%)
Ancestries Reported - Lithuanian (%)
Ancestries Reported - Norwegian (%)
Ancestries Reported - Polish (%)
Ancestries Reported - Portuguese (%)
Ancestries Reported - Russian (%)
Ancestries Reported - Scotch-Irish (%)
Ancestries Reported - Scottish (%)
Ancestries Reported - Slovak (%)
Ancestries Reported - Subsaharan African (%)
Ancestries Reported - Swedish (%)
Ancestries Reported - Swiss (%)
Ancestries Reported - Ukrainian (%)
Ancestries Reported - United States (%)
Ancestries Reported - Welsh (%)
Ancestries Reported - West Indian (%)
Ancestries Reported - Other (%)
Geographical mobility - Same house 1 year ago (%)
Geographical mobility - Same house 1 year ago (%) - White
Geographical mobility - Same house 1 year ago (%) - Black or African American
Geographical mobility - Same house 1 year ago (%) - Asian
Geographical mobility - Same house 1 year ago (%) - Hispanic or Latino
Geographical mobility - Same house 1 year ago (%) - American Indian and Alaska Native
Geographical mobility - Same house 1 year ago (%) - Multirace
Geographical mobility - Same house 1 year ago (%) - Other Race
Geographical mobility - Moved within same county (%)
Geographical mobility - Moved within same county (%) - White
Geographical mobility - Moved within same county (%) - Black or African American
Geographical mobility - Moved within same county (%) - Asian
Geographical mobility - Moved within same county (%) - Hispanic or Latino
Geographical mobility - Moved within same county (%) - American Indian and Alaska Native
Geographical mobility - Moved within same county (%) - Multirace
Geographical mobility - Moved within same county (%) - Other Race
Geographical mobility - Moved from different county within same state (%)
Geographical mobility - Moved from different county within same state (%) - White
Geographical mobility - Moved from different county within same state (%) - Black or African American
Geographical mobility - Moved from different county within same state (%) - Asian
Geographical mobility - Moved from different county within same state (%) - Hispanic or Latino
Geographical mobility - Moved from different county within same state (%) - American Indian and Alaska Native
Geographical mobility - Moved from different county within same state (%) - Multirace
Geographical mobility - Moved from different county within same state (%) - Other Race
Geographical mobility - Moved from different state (%)
Geographical mobility - Moved from different state (%) - White
Geographical mobility - Moved from different state (%) - Black or African American
Geographical mobility - Moved from different state (%) - Asian
Geographical mobility - Moved from different state (%) - Hispanic or Latino
Geographical mobility - Moved from different state (%) - American Indian and Alaska Native
Geographical mobility - Moved from different state (%) - Multirace
Geographical mobility - Moved from different state (%) - Other Race
Geographical mobility - Moved from abroad (%)
Geographical mobility - Moved from abroad (%) - White
Geographical mobility - Moved from abroad (%) - Black or African American
Geographical mobility - Moved from abroad (%) - Asian
Geographical mobility - Moved from abroad (%) - Hispanic or Latino
Geographical mobility - Moved from abroad (%) - American Indian and Alaska Native
Geographical mobility - Moved from abroad (%) - Multirace
Geographical mobility - Moved from abroad (%) - Other Race
Place of birth for the foreign-born population - Ireland (%)
Place of birth for the foreign-born population - Denmark (%)
Place of birth for the foreign-born population - Norway (%)
Place of birth for the foreign-born population - Sweden (%)
Place of birth for the foreign-born population - United Kingdom (%)
Place of birth for the foreign-born population - England (%)
Place of birth for the foreign-born population - Scotland (%)
Place of birth for the foreign-born population - Other Northern Europe (%)
Place of birth for the foreign-born population - Austria (%)
Place of birth for the foreign-born population - Belgium (%)
Place of birth for the foreign-born population - France (%)
Place of birth for the foreign-born population - Germany (%)
Place of birth for the foreign-born population - Netherlands (%)
Place of birth for the foreign-born population - Switzerland (%)
Place of birth for the foreign-born population - Other Western Europe (%)
Place of birth for the foreign-born population - Greece (%)
Place of birth for the foreign-born population - Italy (%)
Place of birth for the foreign-born population - Portugal (%)
Place of birth for the foreign-born population - Spain (%)
Place of birth for the foreign-born population - Other Southern Europe (%)
Place of birth for the foreign-born population - Albania (%)
Place of birth for the foreign-born population - Belarus (%)
Place of birth for the foreign-born population - Bosnia and Herzegovina (%)
Place of birth for the foreign-born population - Bulgaria (%)
Place of birth for the foreign-born population - Croatia (%)
Place of birth for the foreign-born population - Czechoslovakia (%)
Place of birth for the foreign-born population - Hungary (%)
Place of birth for the foreign-born population - Latvia (%)
Place of birth for the foreign-born population - Lithuania (%)
Place of birth for the foreign-born population - North Macedonia (Macedonia) (%)
Place of birth for the foreign-born population - Moldova (%)
Place of birth for the foreign-born population - Poland (%)
Place of birth for the foreign-born population - Romania (%)
Place of birth for the foreign-born population - Russia (%)
Place of birth for the foreign-born population - Serbia (%)
Place of birth for the foreign-born population - Ukraine (%)
Place of birth for the foreign-born population - Other Eastern Europe (%)
Place of birth for the foreign-born population - China (%)
Place of birth for the foreign-born population - Hong Kong (%)
Place of birth for the foreign-born population - Taiwan (%)
Place of birth for the foreign-born population - Japan (%)
Place of birth for the foreign-born population - Korea (%)
Place of birth for the foreign-born population - Other Eastern Asia (%)
Place of birth for the foreign-born population - Afghanistan (%)
Place of birth for the foreign-born population - Bangladesh (%)
Place of birth for the foreign-born population - India (%)
Place of birth for the foreign-born population - Iran (%)
Place of birth for the foreign-born population - Kazakhstan (%)
Place of birth for the foreign-born population - Nepal (%)
Place of birth for the foreign-born population - Pakistan (%)
Place of birth for the foreign-born population - Sri Lanka (%)
Place of birth for the foreign-born population - Uzbekistan (%)
Place of birth for the foreign-born population - Other South Central Asia (%)
Place of birth for the foreign-born population - Burma (%)
Place of birth for the foreign-born population - Cambodia (%)
Place of birth for the foreign-born population - Indonesia (%)
Place of birth for the foreign-born population - Laos (%)
Place of birth for the foreign-born population - Malaysia (%)
Place of birth for the foreign-born population - Philippines (%)
Place of birth for the foreign-born population - Singapore (%)
Place of birth for the foreign-born population - Thailand (%)
Place of birth for the foreign-born population - Vietnam (%)
Place of birth for the foreign-born population - Other South Eastern Asia (%)
Place of birth for the foreign-born population - Armenia (%)
Place of birth for the foreign-born population - Iraq (%)
Place of birth for the foreign-born population - Israel (%)
Place of birth for the foreign-born population - Jordan (%)
Place of birth for the foreign-born population - Kuwait (%)
Place of birth for the foreign-born population - Lebanon (%)
Place of birth for the foreign-born population - Saudi Arabia (%)
Place of birth for the foreign-born population - Syria (%)
Place of birth for the foreign-born population - Turkey (%)
Place of birth for the foreign-born population - Yemen (%)
Place of birth for the foreign-born population - Other Western Asia (%)
Place of birth for the foreign-born population - Eritrea (%)
Place of birth for the foreign-born population - Ethiopia (%)
Place of birth for the foreign-born population - Kenya (%)
Place of birth for the foreign-born population - Somalia (%)
Place of birth for the foreign-born population - Uganda (%)
Place of birth for the foreign-born population - Zimbabwe (%)
Place of birth for the foreign-born population - Other Eastern Africa (%)
Place of birth for the foreign-born population - Cameroon (%)
Place of birth for the foreign-born population - Congo (%)
Place of birth for the foreign-born population - Democratic Republic of Congo (Zaire) (%)
Place of birth for the foreign-born population - Other Middle Africa (%)
Place of birth for the foreign-born population - Egypt (%)
Place of birth for the foreign-born population - Morocco (%)
Place of birth for the foreign-born population - Sudan (%)
Place of birth for the foreign-born population - Other Northern Africa (%)
Place of birth for the foreign-born population - South Africa (%)
Place of birth for the foreign-born population - Other Southern Africa (%)
Place of birth for the foreign-born population - Cabo Verde (%)
Place of birth for the foreign-born population - Ghana (%)
Place of birth for the foreign-born population - Liberia (%)
Place of birth for the foreign-born population - Nigeria (%)
Place of birth for the foreign-born population - Senegal (%)
Place of birth for the foreign-born population - Sierra Leone (%)
Place of birth for the foreign-born population - Other Western Africa (%)
Place of birth for the foreign-born population - Australia (%)
Place of birth for the foreign-born population - New Zealand (%)
Place of birth for the foreign-born population - Fiji (%)
Place of birth for the foreign-born population - Micronesia (%)
Place of birth for the foreign-born population - Bahamas (%)
Place of birth for the foreign-born population - Barbados (%)
Place of birth for the foreign-born population - Cuba (%)
Place of birth for the foreign-born population - Dominica (%)
Place of birth for the foreign-born population - Dominican Republic (%)
Place of birth for the foreign-born population - Grenada (%)
Place of birth for the foreign-born population - Haiti (%)
Place of birth for the foreign-born population - Jamaica (%)
Place of birth for the foreign-born population - St. Vincent and the Grenadines (%)
Place of birth for the foreign-born population - Trinidad and Tobago (%)
Place of birth for the foreign-born population - West Indies (%)
Place of birth for the foreign-born population - Other Caribbean (%)
Place of birth for the foreign-born population - Belize (%)
Place of birth for the foreign-born population - Costa Rica (%)
Place of birth for the foreign-born population - El Salvador (%)
Place of birth for the foreign-born population - Guatemala (%)
Place of birth for the foreign-born population - Honduras (%)
Place of birth for the foreign-born population - Mexico (%)
Place of birth for the foreign-born population - Nicaragua (%)
Place of birth for the foreign-born population - Panama (%)
Place of birth for the foreign-born population - Other Central America (%)
Place of birth for the foreign-born population - Argentina (%)
Place of birth for the foreign-born population - Bolivia (%)
Place of birth for the foreign-born population - Brazil (%)
Place of birth for the foreign-born population - Chile (%)
Place of birth for the foreign-born population - Colombia (%)
Place of birth for the foreign-born population - Ecuador (%)
Place of birth for the foreign-born population - Guyana (%)
Place of birth for the foreign-born population - Peru (%)
Place of birth for the foreign-born population - Uruguay (%)
Place of birth for the foreign-born population - Venezuela (%)
Place of birth for the foreign-born population - Other South America (%)
Place of birth for the foreign-born population - Canada (%)
Place of birth for the foreign-born population - Other Northern America (%)
Place of birth for the foreign-born population - Other (%)
Latest news about races in Henderson, NV collected exclusively by city-data.com from local newspapers, TV, and radio stations
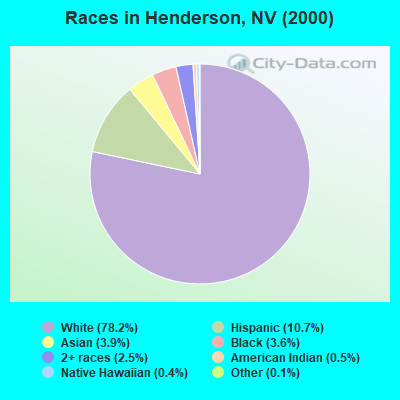
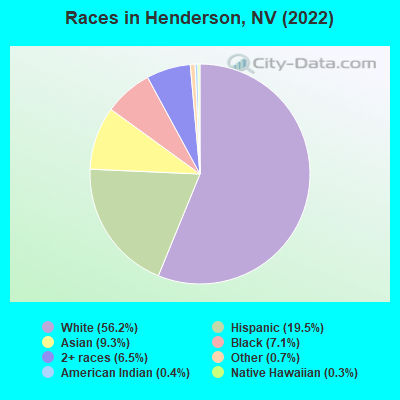
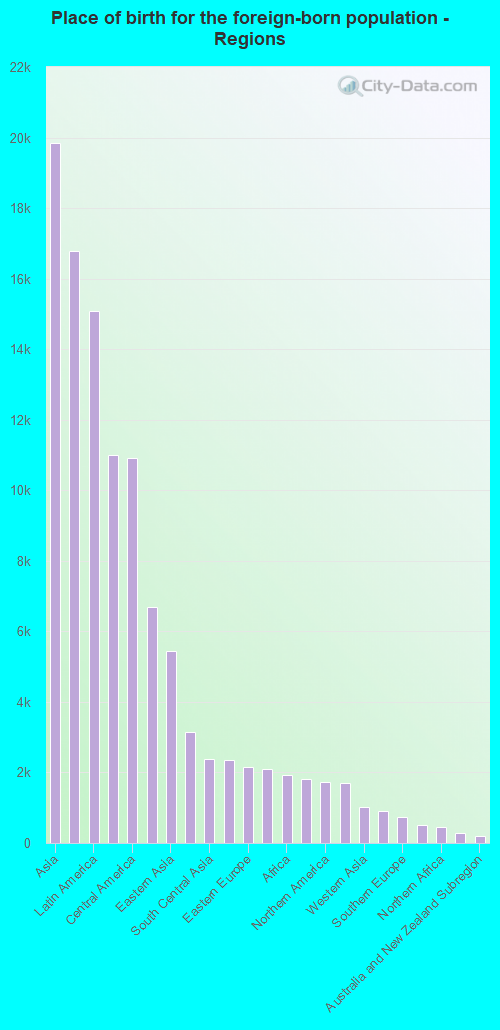
According to 2022 data, the most numerous races in Henderson, NV are White alone (186,159 residents), Hispanic (64,765 residents), and Black alone (23,498 residents). 81.2% of Henderson residents speak English at home. 14.0% of Henderson, NV residents are foreign-born (6.1% born in Asia, 4.6% born in Latin America, 2.1% born in Europe), which is 28.3% less than the foreign-born rate of 18.0% across the entire state of Nevada.
Race distribution in Henderson
2000 2022
137,174 78.2% White alone 18,785 10.7% Hispanic 6,838 3.9% Asian alone 6,376 3.6% Black alone 4,312 2.5% Two or more races 955 0.5% American Indian alone 681 0.4% Native Hawaiian and Other 260 0.1% Other race alone
186,159 56.2% White alone 64,765 19.5% Hispanic 30,772 9.3% Asian alone 23,498 7.1% Black alone 21,662 6.5% Two or more races 2,234 0.7% Other race alone 1,285 0.4% American Indian alone 1,033 0.3% Native Hawaiian and Other
2000 2022
1,303,001 65.2% White alone 393,970 19.7% Hispanic 131,509 6.6% Black alone 88,593 4.4% Asian alone 49,231 2.5% Two or more races 21,397 1.1% American Indian alone 7,769 0.4% Native Hawaiian and Other 2,787 0.1% Other race alone
1,410,145 44.4% White alone 961,357 30.3% Hispanic 286,471 9.0% Black alone 281,149 8.8% Asian alone 182,151 5.7% Two or more races 20,102 0.6% Native Hawaiian and Other 18,781 0.6% Other race alone 17,616 0.6% American Indian alone
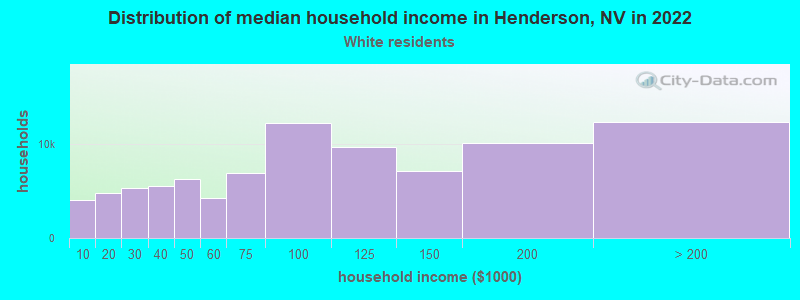
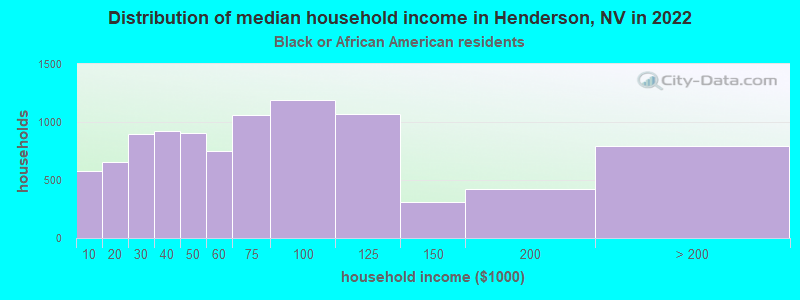
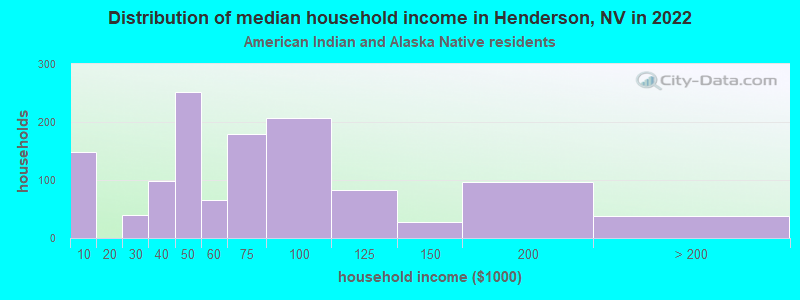
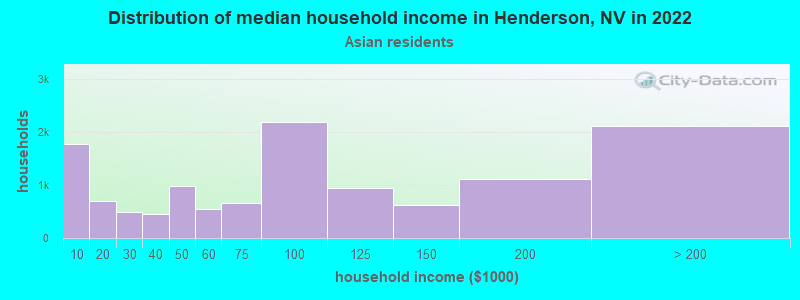
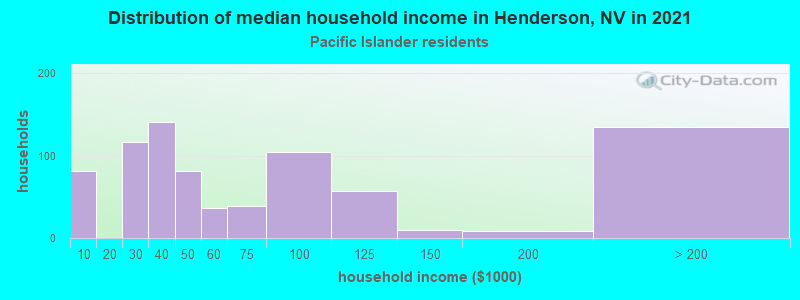
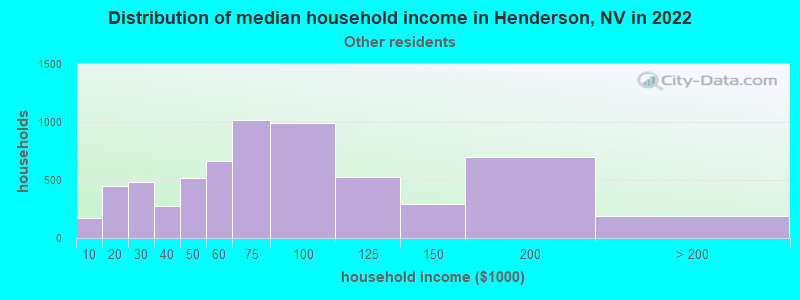
Income and house value in Henderson Median household income in 2022 $87,147 White non-Hispanic householders$61,498 Black householders$41,724 American Indian and Alaska Native householders$82,998 Asian householders$64,009 Some other race householders$79,337 Two or more races householders$73,682 Hispanic or Latino race householdersMedian 2022 house value $507,385 White Non-Hispanic householders$521,614 Black or African American householders$472,460 American Indian or Alaska Native householders $530,346 Asian householders$411,664 Native Hawaiian and other Pacific Islander householders$446,266 Some other race householders$511,913 Two or more races householders$460,495 Hispanic or Latino householders
Median age by race in Henderson
48.1 Median age for White residents47.3 48.9 46.2 Median age for Black or African American residents42.5 46.9 43.4 Median age for American Indian / Alaska Native residents56.1 29.3 44.8 Median age for Asian residents39.4 48.1 34.3 Median age for Native Hawaiian / Pacific Islander residents36.9 25.9 39.5 Median age for Other race residents39.6 37.0 26.7 Median age for Two or more races residents23.4 28.2 49.4 Median age for White alone residents48.1 50.8 31.7 Median age for Hispanic or Latino residents32.2 31.0
Owner/renter occupied households by race in Henderson
House owners and renters - White residents 61,898 69.7% Owner occupied26,902 30.3% Renter occupiedHouse owners and renters - Black or African American residents 3,872 40.5% Owner occupied5,681 59.5% Renter occupiedHouse owners and renters - American Indian / Alaska Native residents 587 60.7% Owner occupied380 39.3% Renter occupiedHouse owners and renters - Asian residents 8,920 71.1% Owner occupied3,621 28.9% Renter occupiedHouse owners and renters - Native Hawaiian / Pacific Islander residents 270 41.6% Owner occupied380 58.4% Renter occupiedHouse owners and renters - Other race residents 3,895 57.0% Owner occupied2,939 43.0% Renter occupiedHouse owners and renters - Two or more races residents 8,107 55.7% Owner occupied6,447 44.3% Renter occupiedHouse owners and renters - White alone residents 59,724 70.3% Owner occupied25,183 29.7% Renter occupiedHouse owners and renters - Hispanic or Latino residents 10,573 55.7% Owner occupied8,426 44.3% Renter occupied
Language usage in Henderson
English speakers - Total 81.2% of residents of Henderson speak English at home.
9.5% of residents speak Spanish at home 21,500 72.2% Speak English very well8,271 27.8% Speak English less than very well9.3% of residents speak other language at home 21,184 72.4% Speak English very well8,072 27.6% Speak English less than very well
English speakers - Born in the United States 91.4% of residents of Henderson speak English at home.
6.3% of residents speak Spanish at home 11,035 88.1% Speak English very well1,489 11.9% Speak English less than very well2.3% of residents speak other language at home 4,256 93.7% Speak English very well287 6.3% Speak English less than very well
English speakers - Native, born elsewhere 71.2% of residents of Henderson speak English at home.
15.1% of residents speak Spanish at home 753 76.8% Speak English very well228 23.2% Speak English less than very well13.7% of residents speak other language at home 538 60.4% Speak English very well352 39.6% Speak English less than very well
English speakers - Foreign-born 27.7% of residents of Henderson speak English at home.
25.4% of residents speak Spanish at home 5,741 47.5% Speak English very well6,338 52.5% Speak English less than very well47.0% of residents speak other language at home 15,183 67.8% Speak English very well7,201 32.2% Speak English less than very well
White (Caucasian) - Speak only English Native:
95.8% (169,926)Foreign-born:
46.3% (6,306)
White (Caucasian) - Speak another language Native:
4.2% (7,514)Foreign-born:
53.7% (7,304)
Black or African American - Speak only English Native:
98.2% (17,885)Foreign-born:
37.9% (424)
Black or African American - Speak another language Native:
2.0% (363)Foreign-born:
60.6% (678)
American Indian / Alaska Native - Speak only English Native:
68.3% (1,596)Foreign-born:
6.8% (46)
American Indian / Alaska Native - Speak another language Native:
31.0% (724)Foreign-born:
95.7% (651)
Asian - Speak only English Native:
73.3% (9,777)Foreign-born:
25.9% (5,285)
Asian - Speak another language Native:
26.7% (3,564)Foreign-born:
74.1% (15,153)
Native Hawaiian / Pacific Islander - Speak only English Native:
76.3% (1,313)Foreign-born:
22.6% (111)
Native Hawaiian / Pacific Islander - Speak another language Native:
22.5% (387)Foreign-born:
72.9% (358)
Other race - Speak only English Native:
54.1% (7,121)Foreign-born:
6.0% (314)
Other race - Speak another language Native:
45.9% (6,037)Foreign-born:
94.0% (4,894)
Two or more races - Speak only English Native:
84.2% (32,638)Foreign-born:
5.4% (314)
Two or more races - Speak another language Native:
15.8% (6,121)Foreign-born:
94.6% (5,476)
White alone - Speak only English Native:
97.1% (161,824)Foreign-born:
49.4% (6,184)
White alone - Speak another language Native:
2.9% (4,838)Foreign-born:
50.6% (6,334)
Hispanic or Latino - Speak only English Native:
66.8% (31,418)Foreign-born:
4.0% (482)
Hispanic or Latino - Speak another language Native:
33.2% (15,601)Foreign-born:
96.0% (11,511)
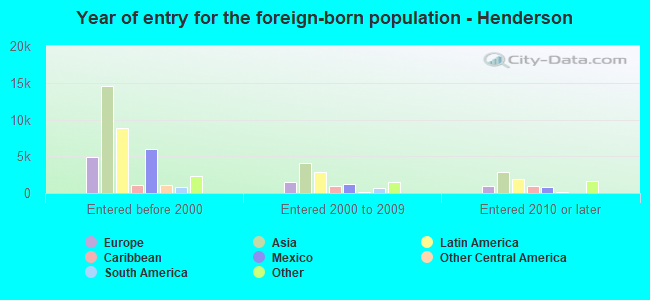
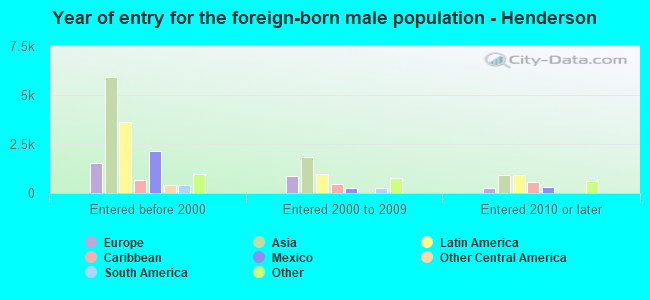
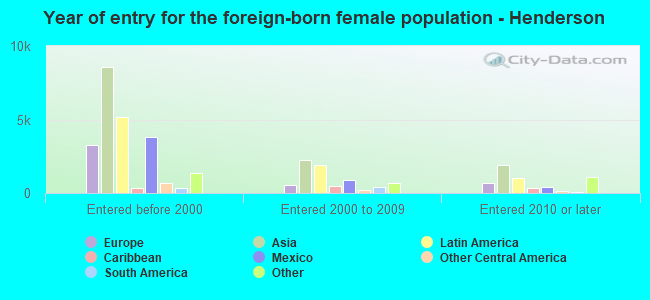
Foreign-born residents in Henderson 45,746 residents are foreign born (6.1% Asia , 4.6% Latin America , 2.1% Europe ).
This city:
14.0%Nevada:
19.1%
Marital status for residents in Henderson Marital status - White (Caucasian) population 15 years and over
Males 26.4% Never married56.9% Now married0.4% Separated4.2% Widowed12.1% DivorcedFemales 19.6% Never married51.7% Now married0.9% Separated10.7% Widowed17.0% DivorcedWomen who gave birth in the past 12 months Now married:
93.8% (2,518)Unmarried:
6.2% (167)
Women who did not give birth in the past 12 months Now married:
47.0% (16,965)Unmarried:
53.0% (19,101)
Marital status - Black or African American population 15 years and over
Males 41.3% Never married36.6% Now married3.4% Separated10.4% Widowed8.2% DivorcedFemales 44.8% Never married33.3% Now married1.7% Separated4.8% Widowed15.4% DivorcedWomen who gave birth in the past 12 months Now married:
28.2% (75)Unmarried:
71.8% (192)
Women who did not give birth in the past 12 months Now married:
32.0% (1,320)Unmarried:
68.0% (2,800)
Marital status - American Indian / Alaska Native population 15 years and over
Males 34.2% Never married46.3% Now married0.9% Separated3.1% Widowed15.5% DivorcedFemales 30.6% Never married31.0% Now married1.9% Separated3.1% Widowed33.5% DivorcedWomen who gave birth in the past 12 months Now married:
100.0% (61)Unmarried:
0.0% (0)
Women who did not give birth in the past 12 months Now married:
28.0% (236)Unmarried:
72.0% (607)
Marital status - Asian population 15 years and over
Males 33.4% Never married61.5% Now married0.0% Separated1.0% Widowed4.0% DivorcedFemales 24.2% Never married53.2% Now married0.5% Separated5.9% Widowed16.3% DivorcedWomen who gave birth in the past 12 months Now married:
100.0% (459)Unmarried:
0.0% (0)
Women who did not give birth in the past 12 months Now married:
44.2% (3,762)Unmarried:
55.8% (4,741)
Marital status - Native Hawaiian / Pacific Islander population 15 years and over
Males 43.4% Never married31.3% Now married0.5% Separated3.5% Widowed21.3% DivorcedFemales 31.0% Never married34.9% Now married0.0% Separated12.2% Widowed21.9% DivorcedWomen who did not give birth in the past 12 months Now married:
30.6% (135)Unmarried:
69.4% (307)
Marital status - Other race population 15 years and over
Males 39.4% Never married52.2% Now married3.7% Separated0.5% Widowed4.2% DivorcedFemales 25.3% Never married50.4% Now married0.0% Separated1.1% Widowed23.2% DivorcedWomen who gave birth in the past 12 months Now married:
100.0% (122)Unmarried:
0.0% (0)
Women who did not give birth in the past 12 months Now married:
33.9% (2,121)Unmarried:
66.1% (4,142)
Marital status - Two or more races population 15 years and over
Males 41.9% Never married49.2% Now married0.6% Separated0.9% Widowed7.4% DivorcedFemales 42.1% Never married36.7% Now married2.7% Separated6.7% Widowed11.7% DivorcedWomen who gave birth in the past 12 months Now married:
56.5% (334)Unmarried:
43.5% (257)
Women who did not give birth in the past 12 months Now married:
32.9% (4,671)Unmarried:
67.1% (9,527)
Marital status - White alone, not Hispanic / Latino population 15 years and over
Males 26.2% Never married57.2% Now married0.5% Separated3.9% Widowed12.3% DivorcedFemales 18.4% Never married52.9% Now married0.7% Separated11.0% Widowed17.0% DivorcedWomen who gave birth in the past 12 months Now married:
96.9% (2,518)Unmarried:
3.1% (81)
Women who did not give birth in the past 12 months Now married:
49.3% (15,783)Unmarried:
50.7% (16,224)
Marital status - Hispanic or Latino population 15 years and over
Males 35.6% Never married55.5% Now married2.0% Separated2.4% Widowed4.5% DivorcedFemales 36.7% Never married41.3% Now married2.2% Separated4.4% Widowed15.3% DivorcedWomen who gave birth in the past 12 months Now married:
47.5% (140)Unmarried:
52.5% (155)
Women who did not give birth in the past 12 months Now married:
37.0% (7,052)Unmarried:
63.0% (12,029)
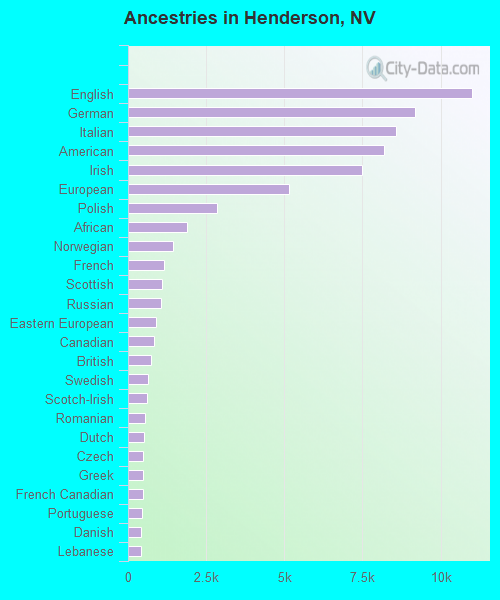
Ancestries in Henderson
10,997 7.0% English9,190 5.9% German8,584 5.5% Italian8,182 5.2% American7,485 4.8% Irish5,162 3.3% European2,851 1.8% Polish1,880 1.2% African1,427 0.9% Norwegian1,166 0.7% French1,089 0.7% Scottish1,054 0.7% Russian909 0.6% Eastern European817 0.5% Canadian727 0.5% British653 0.4% Swedish605 0.4% Scotch-Irish551 0.4% Romanian512 0.3% Dutch487 0.3% Czech479 0.3% Greek465 0.3% French Canadian439 0.3% Portuguese424 0.3% Danish421 0.3% Lebanese413 0.3% Hungarian405 0.3% Ukrainian384 0.2% Welsh369 0.2% Scandinavian321 0.2% Egyptian312 0.2% Lithuanian280 0.2% Syrian268 0.2% Serbian256 0.2% Armenian226 0.1% Iranian221 0.1% Slovak218 0.1% Jamaican207 0.1% Trinidadian and Tobagonian203 0.1% Belgian172 0.1% Israeli172 0.1% Croatian168 0.1% Finnish167 0.1% Swiss136 0.09% Northern European127 0.08% Bulgarian122 0.08% Haitian116 0.07% Moroccan112 0.07% Iraqi110 0.07% Austrian109 0.07% Kenyan105 0.07% Nigerian97 0.06% South African96 0.06% Czechoslovakian96 0.06% Brazilian85 0.05% Zimbabwean80 0.05% Ghanaian66 0.04% Yugoslavian63 0.04% Icelander61 0.04% Somali55 0.04% British West Indian50 0.03% Albanian49 0.03% Australian47 0.03% Palestinian42 0.03% Cajun40 0.03% Turkish37 0.02% Slavic35 0.02% Assyrian29 0.02% Macedonian29 0.02% Basque26 0.02% Jordanian25 0.02% Latvian15 0.01% Pennsylvania German12 0.01% Arab10 0.01% Cape Verdean9 0.01% Luxembourger
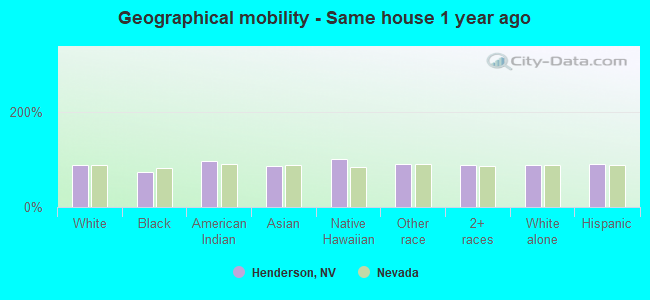
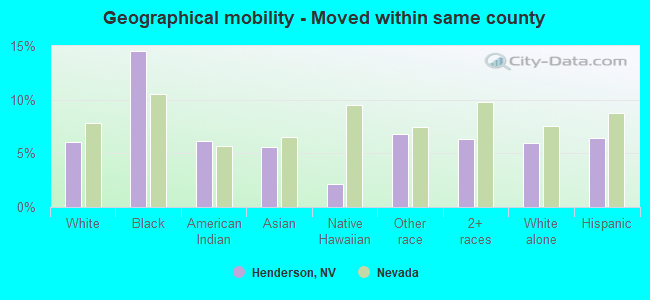
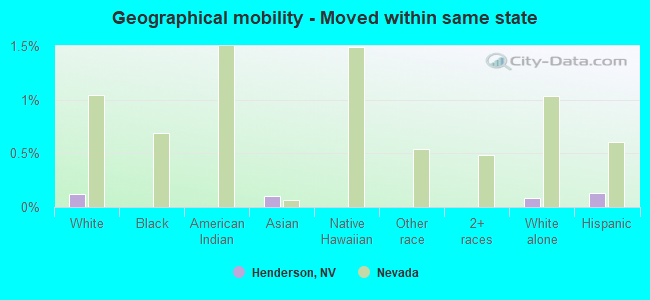
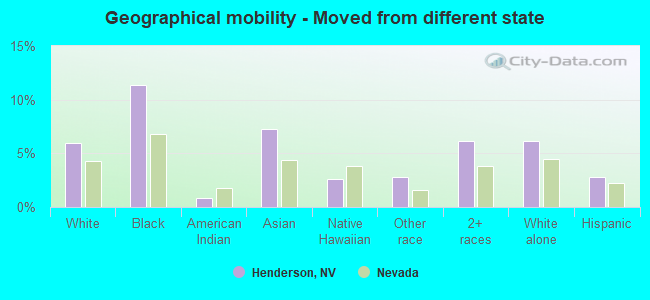
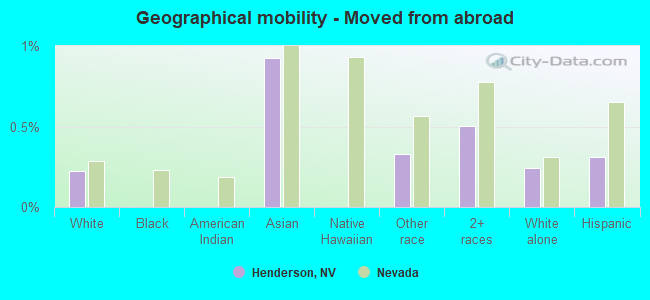
Geographical mobility in Henderson Same house 1 year ago 173,131 87.7% White (Caucasian)17,899 74.2% Black or African American2,942 95.9% American Indian / Alaska Native29,714 86.1% Asian2,322 100.0% Native Hawaiian / Pacific Islander16,904 90.1% Other race43,526 87.0% Two or more races161,781 87.5% White alone, not Hispanic / Latino58,180 90.4% Hispanic or LatinoMoved within same county 11,949 6.1% White / Caucasian3,502 14.5% Black or African American190 6.2% American Indian / Alaska Native1,930 5.6% Asian50 2.2% Native Hawaiian / Pacific Islander1,282 6.8% Other race3,183 6.4% Two or more races11,070 6.0% White alone, not Hispanic / Latino4,113 6.4% Hispanic or LatinoMoved within same state 236 0.1% White / Caucasian36 0.1% Asian149 0.1% White alone, not Hispanic / Latino87 0.1% Hispanic or LatinoMoved from different state 11,688 5.9% White / Caucasian2,734 11.3% Black or African American27 0.9% American Indian / Alaska Native2,521 7.3% Asian61 2.7% Native Hawaiian / Pacific Islander517 2.8% Other race3,063 6.1% Two or more races11,397 6.2% White alone, not Hispanic / Latino1,811 2.8% Hispanic or LatinoMoved from abroad 444 0.2% White319 0.9% Asian62 0.3% Other race252 0.5% Two or more races444 0.2% White alone, not Hispanic / Latino198 0.3% Hispanic or Latino
Children Nativity (place of birth) in Henderson
Children under 6 years - Living with two parents Both parents native 9,495 100.0% NativeBoth parents foreign-born 1,695 96.2% Native67 3.8% Foreign-bornOne native, one foreign-born parent 2,243 100.0% NativeChildren under 6 years - Living with one parent Native parent 5,214 100.0% NativeForeign-born parent 223 100.0% NativeChildren 6 to 17 years - Living with two parents Both parents native 22,045 100.0% NativeBoth parents foreign-born 3,399 87.6% Native480 12.4% Foreign-bornOne native, one foreign-born parent 4,676 100.0% NativeChildren 6 to 17 years - Living with one parent Native parent 12,761 100.0% NativeForeign-born parent 3,396 53.9% Native2,906 46.1% Foreign-born
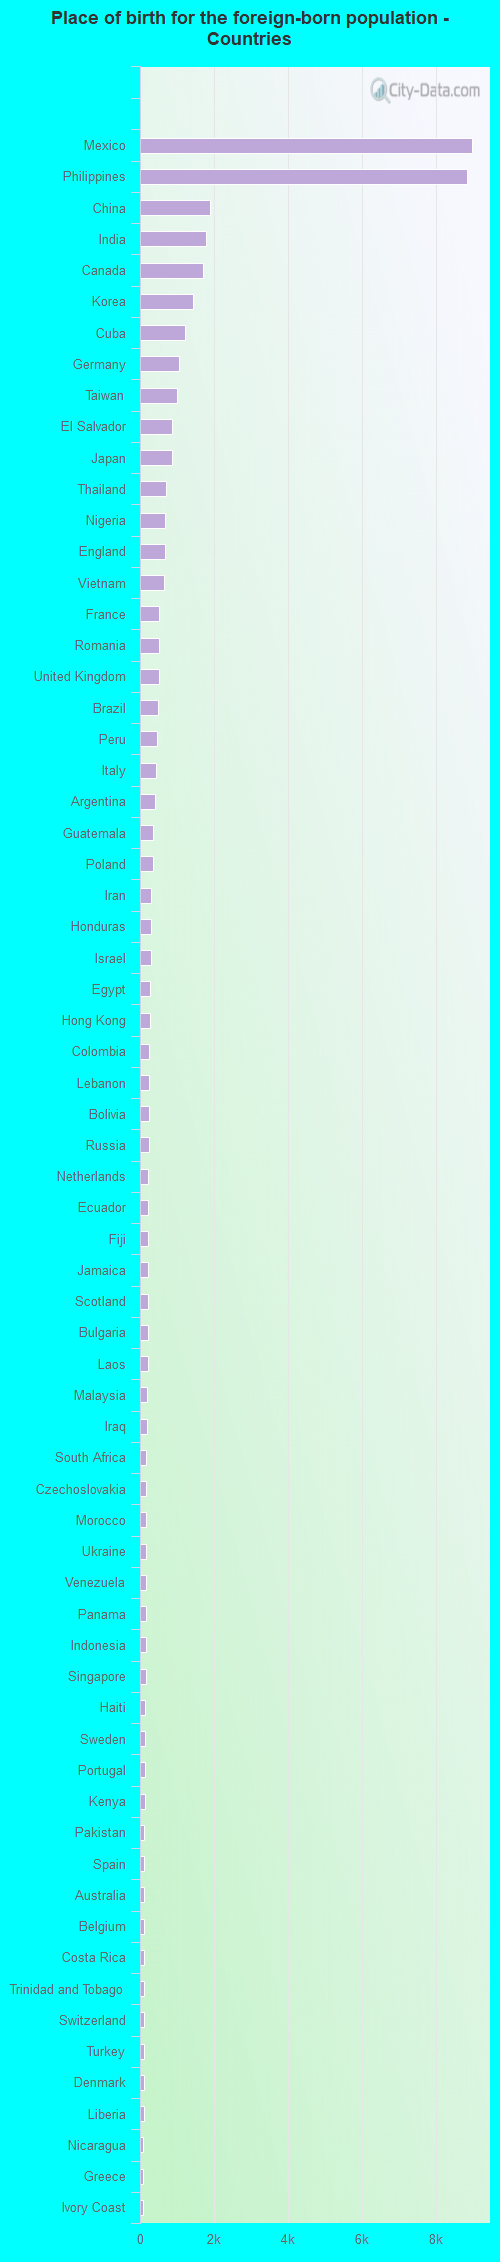
Place of birth for residents in Henderson 19,835 Asia16,788 Americas15,071 Latin America10,986 South Eastern Asia10,904 Central America6,677 Europe5,437 Eastern Asia3,143 China2,372 South Central Asia2,358 South America2,149 Eastern Europe2,087 Western Europe1,930 Africa1,808 Caribbean1,717 Northern America1,690 Northern Europe1,013 Western Asia918 Western Africa750 Southern Europe514 Oceania445 Northern Africa271 Eastern Africa198 Australia and New Zealand Subregion170 Southern Africa81 Middle Africa8,998 Mexico8,840 Philippines1,886 China1,780 India1,717 Canada1,432 Korea1,224 Cuba1,048 Germany995 Taiwan876 El Salvador860 Japan708 Thailand672 Nigeria666 England653 Vietnam511 France505 Romania503 United Kingdom497 Brazil470 Peru420 Italy393 Argentina353 Guatemala344 Poland309 Iran308 Honduras293 Israel276 Egypt261 Hong Kong252 Colombia247 Lebanon246 Bolivia242 Russia228 Netherlands219 Ecuador219 Fiji218 Jamaica213 Scotland212 Bulgaria212 Laos188 Malaysia178 Iraq170 South Africa169 Czechoslovakia168 Morocco167 Ukraine155 Venezuela151 Panama150 Indonesia150 Singapore139 Haiti136 Sweden124 Portugal122 Kenya121 Pakistan117 Spain116 Australia112 Belgium110 Costa Rica108 Trinidad and Tobago102 Switzerland99 Turkey97 Denmark96 Liberia89 Nicaragua87 Greece82 Ivory Coast81 New Zealand74 Cambodia71 Chile69 Ethiopia65 Sri Lanka64 Cameroon63 Albania61 Hungary59 Austria58 Somalia51 Bangladesh51 Serbia49 Dominican Republic44 Lithuania44 Syria44 Armenia41 Georgia40 Ireland36 Latvia36 Ghana32 Saudi Arabia31 Norway29 Belarus27 North Macedonia (Macedonia)21 Croatia19 Dominica18 Grenada17 Azores Islands16 Zimbabwe16 Nepal12 West Indies12 Jordan10 Guyana9 Bosnia and Herzegovina9 Burma (Myanmar)7 Uzbekistan6 Bahamas5 Uganda4 Moldova
Grandparents responsible for own grandchildren in Henderson
Grandparents (30 to 59 years) White / Caucasian 303 21.4% Responsible for grandchildren1,112 78.6% Not responsible for grandchildrenBlack or African American 566 85.9% Responsible for grandchildren93 14.1% Not responsible for grandchildrenAsian 35 48.9% Responsible for grandchildren37 51.1% Not responsible for grandchildrenOther race 79 64.1% Responsible for grandchildren44 35.9% Not responsible for grandchildrenTwo or more races 26 7.6% Responsible for grandchildren322 92.4% Not responsible for grandchildrenWhite alone, not Hispanic / Latino 303 23.1% Responsible for grandchildren1,007 76.9% Not responsible for grandchildrenHispanic or Latino 160 24.8% Responsible for grandchildren483 75.2% Not responsible for grandchildrenGrandparents (60 years and over) White / Caucasian 868 34.6% Responsible for grandchildren1,638 65.4% Not responsible for grandchildrenBlack or African American 300 61.1% Responsible for grandchildren192 38.9% Not responsible for grandchildrenAsian 59 6.1% Responsible for grandchildren909 93.9% Not responsible for grandchildrenOther race 75 25.0% Responsible for grandchildren224 75.0% Not responsible for grandchildrenTwo or more races 7 0.9% Responsible for grandchildren773 99.1% Not responsible for grandchildrenWhite alone, not Hispanic / Latino 868 36.5% Responsible for grandchildren1,510 63.5% Not responsible for grandchildrenHispanic or Latino 105 9.0% Responsible for grandchildren1,056 91.0% Not responsible for grandchildren