Races in Hillside, New Jersey (NJ) Detailed Stats
Ancestries, Foreign-born residents, place of birth

Recent posts about races in Hillside, New Jersey on our local forum with over 2,400,000 registered users:

27.4% of Hillside, NJ residents are foreign-born (12.6% born in Latin America, 9.2% born in Europe, 3.2% born in Asia), which is 16.1% greater than the foreign-born rate of 23.0% across the entire state of New Jersey.
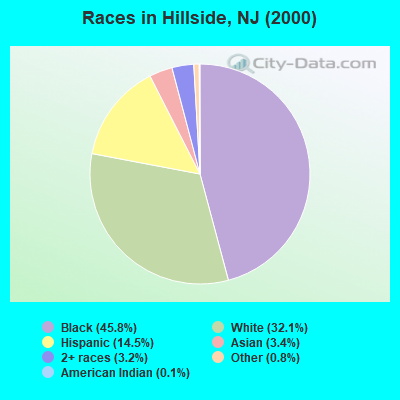
Race distribution in Hillside

- 9,96145.8%Black alone
- 6,99132.1%White alone
- 3,15314.5%Hispanic
- 7443.4%Asian alone
- 6913.2%Two or more races
- 1800.8%Other race alone
- 250.1%American Indian alone
- 20.01%Native Hawaiian and Other
Pacific Islander alone
2000
2022
-
- 5,557,20966.0%White alone
- 1,117,19113.3%Hispanic
- 1,096,17113.0%Black alone
- 477,0125.7%Asian alone
- 133,6891.6%Two or more races
- 19,5650.2%Other race alone
- 11,3380.1%American Indian alone
- 2,1750.03%Native Hawaiian and Other
Pacific Islander alone

-
- 4,766,47651.5%White alone
- 2,028,47021.9%Hispanic
- 1,111,63212.0%Black alone
- 923,54610.0%Asian alone
- 332,2373.6%Two or more races
- 89,8471.0%Other race alone
- 8,5570.09%American Indian alone
- 9340.01%Native Hawaiian and Other
Pacific Islander alone

Income and house value in Hillside
- Median household income in 2022
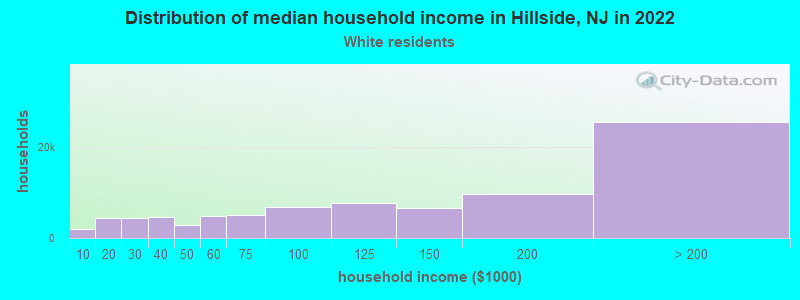
- $109,163White non-Hispanic householders
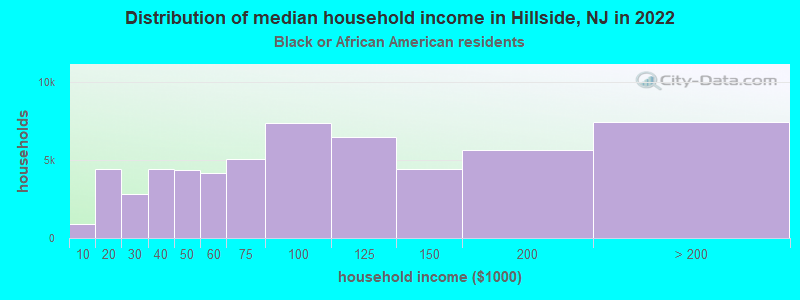
- $114,369Black householders
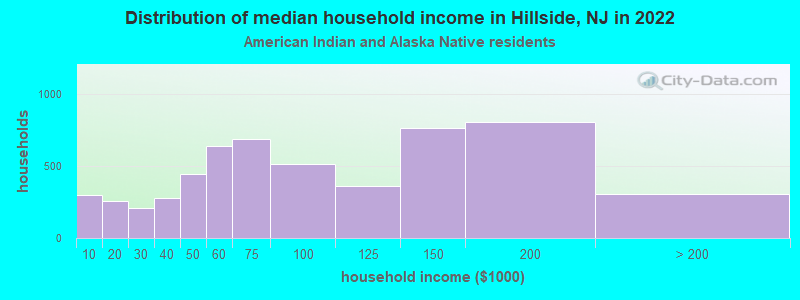
- $19,588American Indian and Alaska Native householders
- $114,906Asian householders
- $108,994Some other race householders
- $108,584Two or more races householders
- $108,337Hispanic or Latino race householders
- Median 2022 house value
- $361,014White Non-Hispanic householders
- $361,284Black or African American householders
- $202,362American Indian or Alaska Native householders
- $389,345Asian householders
- $395,281Some other race householders
- $389,075Two or more races householders
- $419,024Hispanic or Latino householders
Household income for White non-Hispanic householders
Household income for Black householders
Household income for American Indian and Alaska Native householders
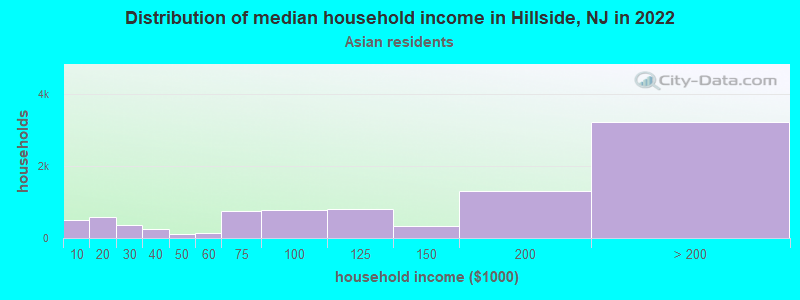
Household income for Asian householders
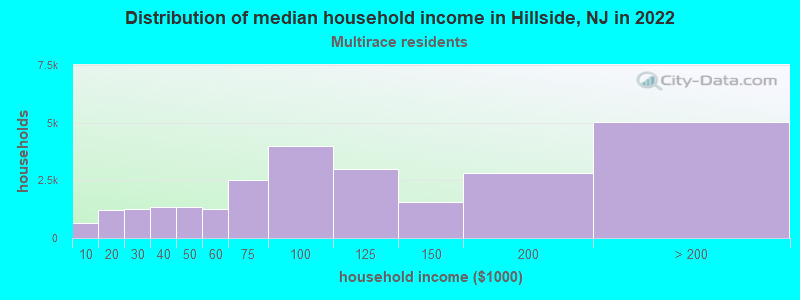
Household income for Two or more races householders
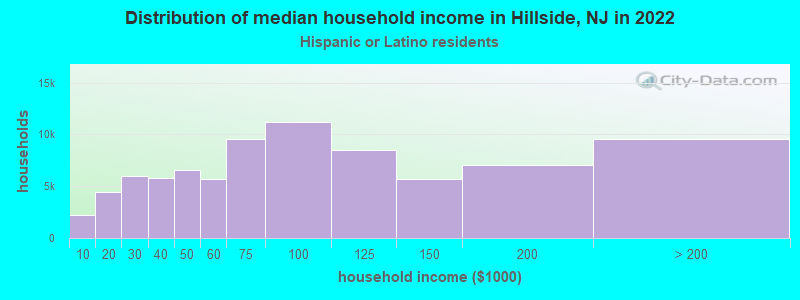
Household income for Hispanic or Latino race householders
Foreign-born residents in Hillside
5,959 residents are foreign born (12.6% Latin America, 9.2% Europe, 3.2% Asia).
| This city: | 27.4% |
| New Jersey: | 17.5% |
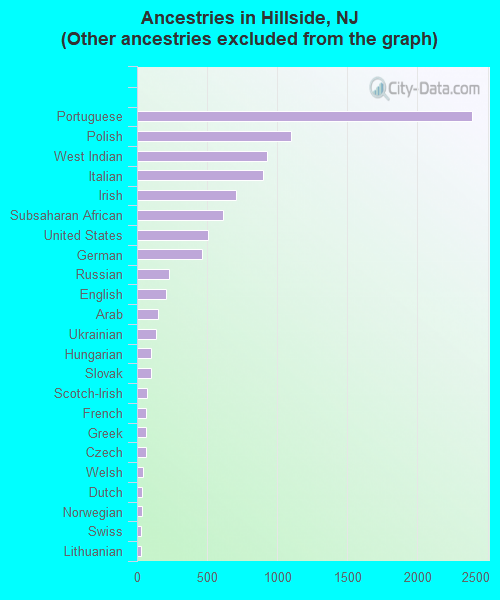
Ancestries in Hillside

- 12,34358.0%Other
- 2,39111.2%Portuguese
- 1,0955.1%Polish
- 9284.4%West Indian
- 8964.2%Italian
- 7073.3%Irish
- 6152.9%Subsaharan African
- 5032.4%United States
- 4622.2%German
- 2291.1%Russian
- 2051.0%English
- 1510.7%Arab
- 1360.6%Ukrainian
- 1010.5%Hungarian
- 990.5%Slovak
- 680.3%Scotch-Irish
- 640.3%French
- 640.3%Greek
- 620.3%Czech
- 460.2%Welsh
- 350.2%Dutch
- 340.2%Norwegian
- 280.1%Swiss
- 270.1%Lithuanian
- 60.03%Scottish
- 30.01%Swedish
Zip codes: 07205.