Races in Hinsdale, Illinois (IL) Detailed Stats
Data:
Races - White alone (%)
Races - White alone (% change since 2000)
Races - Black alone (%)
Races - Black alone (% change since 2000)
Races - American Indian alone (%)
Races - American Indian alone (% change since 2000)
Races - Asian alone (%)
Races - Asian alone (% change since 2000)
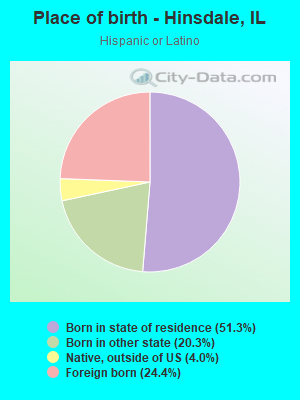
Races - Hispanic (%)
Races - Hispanic (% change since 2000)
Races - Native Hawaiian and Other Pacific Islander alone (%)
Races - Native Hawaiian and Other Pacific Islander alone (% change since 2000)
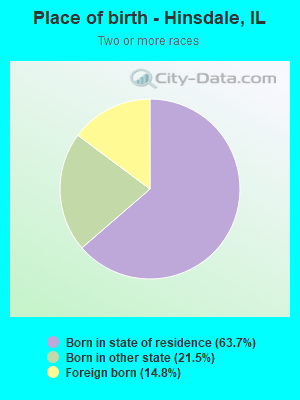
Races - Two or more races(%)
Races - Two or more races(% change since 2000)
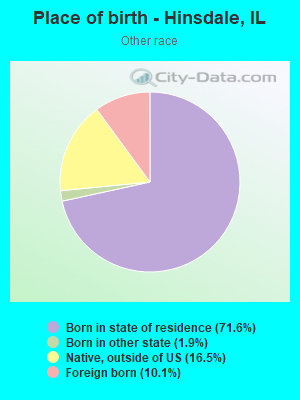
Races - Other race alone (%)
Races - Other race alone (% change since 2000)
Racial diversity
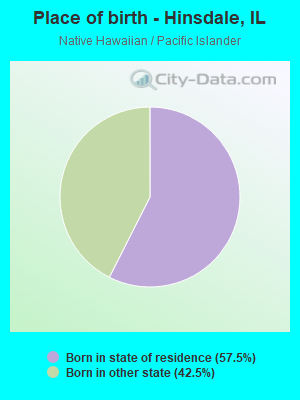
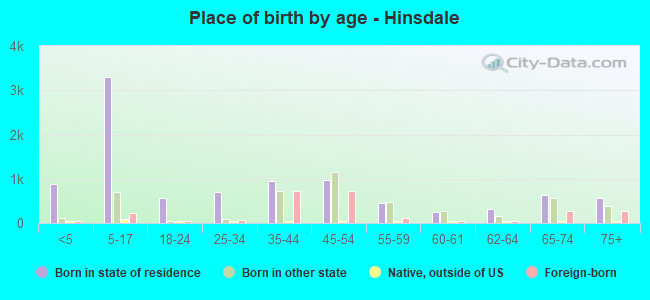
Place of birth - Born in state of residence (%)
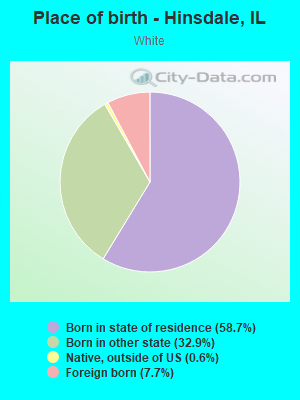
Place of birth - Born in state of residence (%) - White
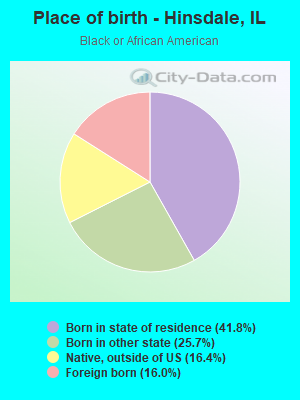
Place of birth - Born in state of residence (%) - Black or African American
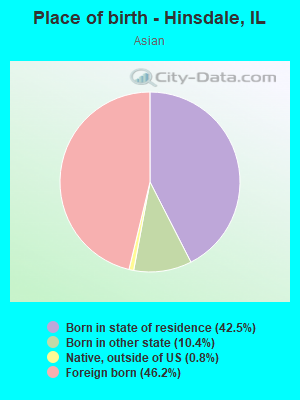
Place of birth - Born in state of residence (%) - Asian
Place of birth - Born in state of residence (%) - Hispanic or Latino
Place of birth - Born in state of residence (%) - American Indian and Alaska Native
Place of birth - Born in state of residence (%) - Multirace
Place of birth - Born in state of residence (%) - Other Race
Place of birth - Born in other state (%)
Place of birth - Born in other state (%) - White
Place of birth - Born in other state (%) - Black or African American
Place of birth - Born in other state (%) - Asian
Place of birth - Born in other state (%) - Hispanic or Latino
Place of birth - Born in other state (%) - American Indian and Alaska Native
Place of birth - Born in other state (%) - Multirace
Place of birth - Born in other state (%) - Other Race
Place of birth - Native, outside of US (%)
Place of birth - Native, outside of US (%) - White
Place of birth - Native, outside of US (%) - Black or African American
Place of birth - Native, outside of US (%) - Asian
Place of birth - Native, outside of US (%) - Hispanic or Latino
Place of birth - Native, outside of US (%) - American Indian and Alaska Native
Place of birth - Native, outside of US (%) - Multirace
Place of birth - Native, outside of US (%) - Other Race
Place of birth - Foreign born (%)
Place of birth - Foreign born (%) - White
Place of birth - Foreign born (%) - Black or African American
Place of birth - Foreign born (%) - Asian
Place of birth - Foreign born (%) - Hispanic or Latino
Place of birth - Foreign born (%) - American Indian and Alaska Native
Place of birth - Foreign born (%) - Multirace
Place of birth - Foreign born (%) - Other Race
Residents speaking English at home (%)
Residents speaking English at home - Born in the United States (%)
Residents speaking English at home - Native, born elsewhere (%)
Residents speaking English at home - Foreign born (%)
Residents speaking Spanish at home (%)
Residents speaking Spanish at home - Born in the United States (%)
Residents speaking Spanish at home - Native, born elsewhere (%)
Residents speaking Spanish at home - Foreign born (%)
Residents speaking other language at home (%)
Residents speaking other language at home - Born in the United States (%)
Residents speaking other language at home - Native, born elsewhere (%)
Residents speaking other language at home - Foreign born (%)
Marital status - Never married (%)
Marital status - Now married (%)
Marital status - Separated (%)
Marital status - Widowed (%)
Marital status - Divorced (%)
Ancestries Reported - Arab (%)
Ancestries Reported - Czech (%)
Ancestries Reported - Danish (%)
Ancestries Reported - Dutch (%)
Ancestries Reported - English (%)
Ancestries Reported - French (%)
Ancestries Reported - French Canadian (%)
Ancestries Reported - German (%)
Ancestries Reported - Greek (%)
Ancestries Reported - Hungarian (%)
Ancestries Reported - Irish (%)
Ancestries Reported - Italian (%)
Ancestries Reported - Lithuanian (%)
Ancestries Reported - Norwegian (%)
Ancestries Reported - Polish (%)
Ancestries Reported - Portuguese (%)
Ancestries Reported - Russian (%)
Ancestries Reported - Scotch-Irish (%)
Ancestries Reported - Scottish (%)
Ancestries Reported - Slovak (%)
Ancestries Reported - Subsaharan African (%)
Ancestries Reported - Swedish (%)
Ancestries Reported - Swiss (%)
Ancestries Reported - Ukrainian (%)
Ancestries Reported - United States (%)
Ancestries Reported - Welsh (%)
Ancestries Reported - West Indian (%)
Ancestries Reported - Other (%)
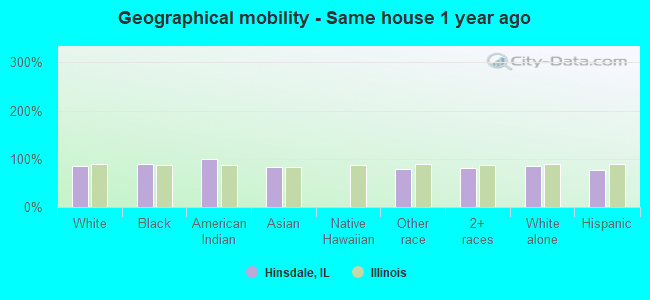
Geographical mobility - Same house 1 year ago (%)
Geographical mobility - Same house 1 year ago (%) - White
Geographical mobility - Same house 1 year ago (%) - Black or African American
Geographical mobility - Same house 1 year ago (%) - Asian
Geographical mobility - Same house 1 year ago (%) - Hispanic or Latino
Geographical mobility - Same house 1 year ago (%) - American Indian and Alaska Native
Geographical mobility - Same house 1 year ago (%) - Multirace
Geographical mobility - Same house 1 year ago (%) - Other Race
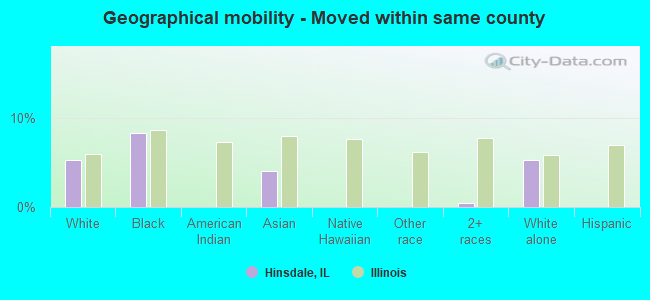
Geographical mobility - Moved within same county (%)
Geographical mobility - Moved within same county (%) - White
Geographical mobility - Moved within same county (%) - Black or African American
Geographical mobility - Moved within same county (%) - Asian
Geographical mobility - Moved within same county (%) - Hispanic or Latino
Geographical mobility - Moved within same county (%) - American Indian and Alaska Native
Geographical mobility - Moved within same county (%) - Multirace
Geographical mobility - Moved within same county (%) - Other Race
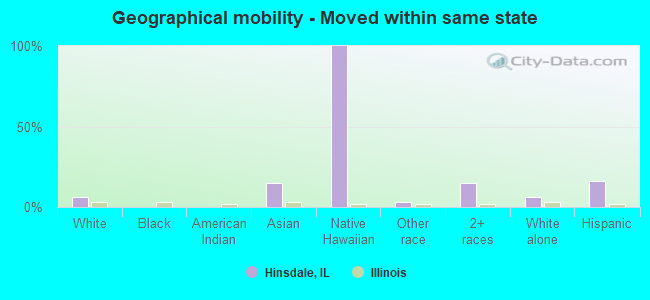
Geographical mobility - Moved from different county within same state (%)
Geographical mobility - Moved from different county within same state (%) - White
Geographical mobility - Moved from different county within same state (%) - Black or African American
Geographical mobility - Moved from different county within same state (%) - Asian
Geographical mobility - Moved from different county within same state (%) - Hispanic or Latino
Geographical mobility - Moved from different county within same state (%) - American Indian and Alaska Native
Geographical mobility - Moved from different county within same state (%) - Multirace
Geographical mobility - Moved from different county within same state (%) - Other Race
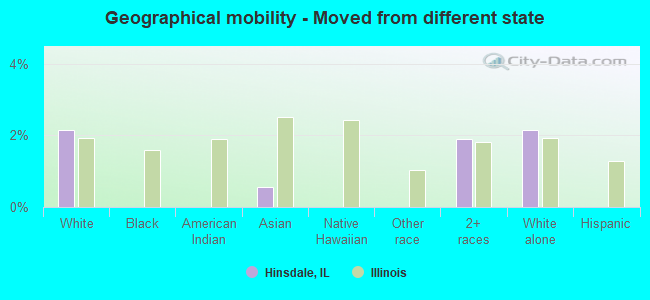
Geographical mobility - Moved from different state (%)
Geographical mobility - Moved from different state (%) - White
Geographical mobility - Moved from different state (%) - Black or African American
Geographical mobility - Moved from different state (%) - Asian
Geographical mobility - Moved from different state (%) - Hispanic or Latino
Geographical mobility - Moved from different state (%) - American Indian and Alaska Native
Geographical mobility - Moved from different state (%) - Multirace
Geographical mobility - Moved from different state (%) - Other Race
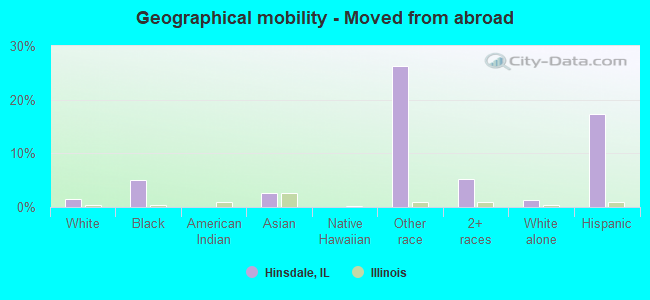
Geographical mobility - Moved from abroad (%)
Geographical mobility - Moved from abroad (%) - White
Geographical mobility - Moved from abroad (%) - Black or African American
Geographical mobility - Moved from abroad (%) - Asian
Geographical mobility - Moved from abroad (%) - Hispanic or Latino
Geographical mobility - Moved from abroad (%) - American Indian and Alaska Native
Geographical mobility - Moved from abroad (%) - Multirace
Geographical mobility - Moved from abroad (%) - Other Race
Place of birth for the foreign-born population - Ireland (%)
Place of birth for the foreign-born population - Denmark (%)
Place of birth for the foreign-born population - Norway (%)
Place of birth for the foreign-born population - Sweden (%)
Place of birth for the foreign-born population - United Kingdom (%)
Place of birth for the foreign-born population - England (%)
Place of birth for the foreign-born population - Scotland (%)
Place of birth for the foreign-born population - Other Northern Europe (%)
Place of birth for the foreign-born population - Austria (%)
Place of birth for the foreign-born population - Belgium (%)
Place of birth for the foreign-born population - France (%)
Place of birth for the foreign-born population - Germany (%)
Place of birth for the foreign-born population - Netherlands (%)
Place of birth for the foreign-born population - Switzerland (%)
Place of birth for the foreign-born population - Other Western Europe (%)
Place of birth for the foreign-born population - Greece (%)
Place of birth for the foreign-born population - Italy (%)
Place of birth for the foreign-born population - Portugal (%)
Place of birth for the foreign-born population - Spain (%)
Place of birth for the foreign-born population - Other Southern Europe (%)
Place of birth for the foreign-born population - Albania (%)
Place of birth for the foreign-born population - Belarus (%)
Place of birth for the foreign-born population - Bosnia and Herzegovina (%)
Place of birth for the foreign-born population - Bulgaria (%)
Place of birth for the foreign-born population - Croatia (%)
Place of birth for the foreign-born population - Czechoslovakia (%)
Place of birth for the foreign-born population - Hungary (%)
Place of birth for the foreign-born population - Latvia (%)
Place of birth for the foreign-born population - Lithuania (%)
Place of birth for the foreign-born population - North Macedonia (Macedonia) (%)
Place of birth for the foreign-born population - Moldova (%)
Place of birth for the foreign-born population - Poland (%)
Place of birth for the foreign-born population - Romania (%)
Place of birth for the foreign-born population - Russia (%)
Place of birth for the foreign-born population - Serbia (%)
Place of birth for the foreign-born population - Ukraine (%)
Place of birth for the foreign-born population - Other Eastern Europe (%)
Place of birth for the foreign-born population - China (%)
Place of birth for the foreign-born population - Hong Kong (%)
Place of birth for the foreign-born population - Taiwan (%)
Place of birth for the foreign-born population - Japan (%)
Place of birth for the foreign-born population - Korea (%)
Place of birth for the foreign-born population - Other Eastern Asia (%)
Place of birth for the foreign-born population - Afghanistan (%)
Place of birth for the foreign-born population - Bangladesh (%)
Place of birth for the foreign-born population - India (%)
Place of birth for the foreign-born population - Iran (%)
Place of birth for the foreign-born population - Kazakhstan (%)
Place of birth for the foreign-born population - Nepal (%)
Place of birth for the foreign-born population - Pakistan (%)
Place of birth for the foreign-born population - Sri Lanka (%)
Place of birth for the foreign-born population - Uzbekistan (%)
Place of birth for the foreign-born population - Other South Central Asia (%)
Place of birth for the foreign-born population - Burma (%)
Place of birth for the foreign-born population - Cambodia (%)
Place of birth for the foreign-born population - Indonesia (%)
Place of birth for the foreign-born population - Laos (%)
Place of birth for the foreign-born population - Malaysia (%)
Place of birth for the foreign-born population - Philippines (%)
Place of birth for the foreign-born population - Singapore (%)
Place of birth for the foreign-born population - Thailand (%)
Place of birth for the foreign-born population - Vietnam (%)
Place of birth for the foreign-born population - Other South Eastern Asia (%)
Place of birth for the foreign-born population - Armenia (%)
Place of birth for the foreign-born population - Iraq (%)
Place of birth for the foreign-born population - Israel (%)
Place of birth for the foreign-born population - Jordan (%)
Place of birth for the foreign-born population - Kuwait (%)
Place of birth for the foreign-born population - Lebanon (%)
Place of birth for the foreign-born population - Saudi Arabia (%)
Place of birth for the foreign-born population - Syria (%)
Place of birth for the foreign-born population - Turkey (%)
Place of birth for the foreign-born population - Yemen (%)
Place of birth for the foreign-born population - Other Western Asia (%)
Place of birth for the foreign-born population - Eritrea (%)
Place of birth for the foreign-born population - Ethiopia (%)
Place of birth for the foreign-born population - Kenya (%)
Place of birth for the foreign-born population - Somalia (%)
Place of birth for the foreign-born population - Uganda (%)
Place of birth for the foreign-born population - Zimbabwe (%)
Place of birth for the foreign-born population - Other Eastern Africa (%)
Place of birth for the foreign-born population - Cameroon (%)
Place of birth for the foreign-born population - Congo (%)
Place of birth for the foreign-born population - Democratic Republic of Congo (Zaire) (%)
Place of birth for the foreign-born population - Other Middle Africa (%)
Place of birth for the foreign-born population - Egypt (%)
Place of birth for the foreign-born population - Morocco (%)
Place of birth for the foreign-born population - Sudan (%)
Place of birth for the foreign-born population - Other Northern Africa (%)
Place of birth for the foreign-born population - South Africa (%)
Place of birth for the foreign-born population - Other Southern Africa (%)
Place of birth for the foreign-born population - Cabo Verde (%)
Place of birth for the foreign-born population - Ghana (%)
Place of birth for the foreign-born population - Liberia (%)
Place of birth for the foreign-born population - Nigeria (%)
Place of birth for the foreign-born population - Senegal (%)
Place of birth for the foreign-born population - Sierra Leone (%)
Place of birth for the foreign-born population - Other Western Africa (%)
Place of birth for the foreign-born population - Australia (%)
Place of birth for the foreign-born population - New Zealand (%)
Place of birth for the foreign-born population - Fiji (%)
Place of birth for the foreign-born population - Micronesia (%)
Place of birth for the foreign-born population - Bahamas (%)
Place of birth for the foreign-born population - Barbados (%)
Place of birth for the foreign-born population - Cuba (%)
Place of birth for the foreign-born population - Dominica (%)
Place of birth for the foreign-born population - Dominican Republic (%)
Place of birth for the foreign-born population - Grenada (%)
Place of birth for the foreign-born population - Haiti (%)
Place of birth for the foreign-born population - Jamaica (%)
Place of birth for the foreign-born population - St. Vincent and the Grenadines (%)
Place of birth for the foreign-born population - Trinidad and Tobago (%)
Place of birth for the foreign-born population - West Indies (%)
Place of birth for the foreign-born population - Other Caribbean (%)
Place of birth for the foreign-born population - Belize (%)
Place of birth for the foreign-born population - Costa Rica (%)
Place of birth for the foreign-born population - El Salvador (%)
Place of birth for the foreign-born population - Guatemala (%)
Place of birth for the foreign-born population - Honduras (%)
Place of birth for the foreign-born population - Mexico (%)
Place of birth for the foreign-born population - Nicaragua (%)
Place of birth for the foreign-born population - Panama (%)
Place of birth for the foreign-born population - Other Central America (%)
Place of birth for the foreign-born population - Argentina (%)
Place of birth for the foreign-born population - Bolivia (%)
Place of birth for the foreign-born population - Brazil (%)
Place of birth for the foreign-born population - Chile (%)
Place of birth for the foreign-born population - Colombia (%)
Place of birth for the foreign-born population - Ecuador (%)
Place of birth for the foreign-born population - Guyana (%)
Place of birth for the foreign-born population - Peru (%)
Place of birth for the foreign-born population - Uruguay (%)
Place of birth for the foreign-born population - Venezuela (%)
Place of birth for the foreign-born population - Other South America (%)
Place of birth for the foreign-born population - Canada (%)
Place of birth for the foreign-born population - Other Northern America (%)
Place of birth for the foreign-born population - Other (%)
Latest news about races in Hinsdale, IL collected exclusively by city-data.com from local newspapers, TV, and radio stations
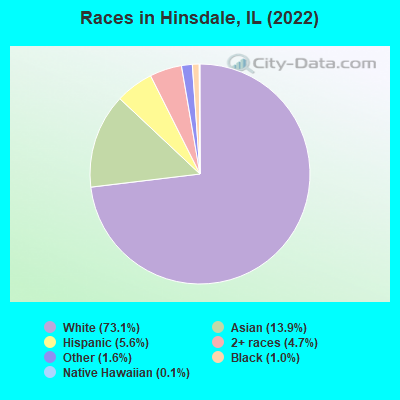
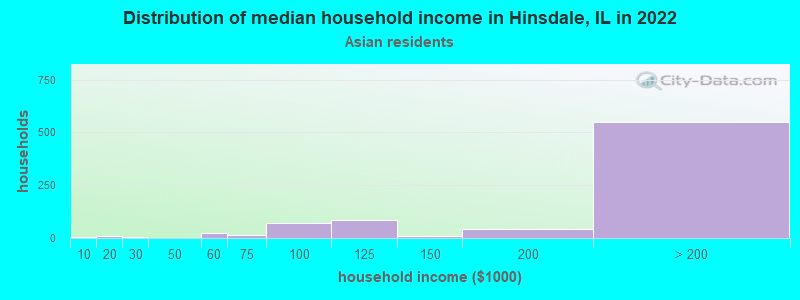
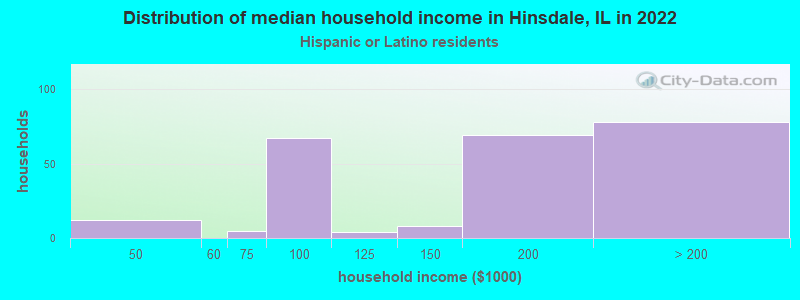
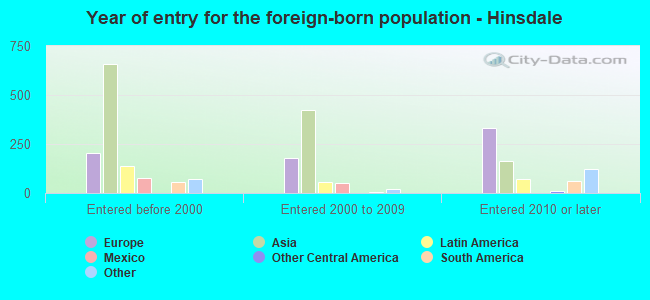
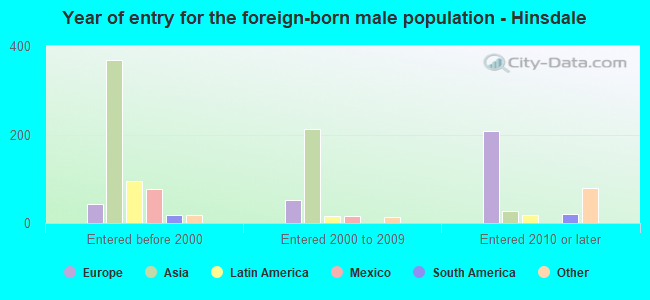
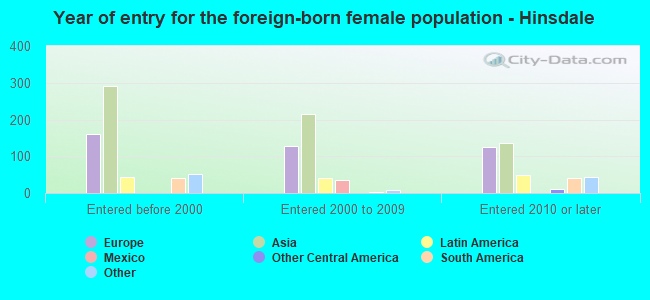
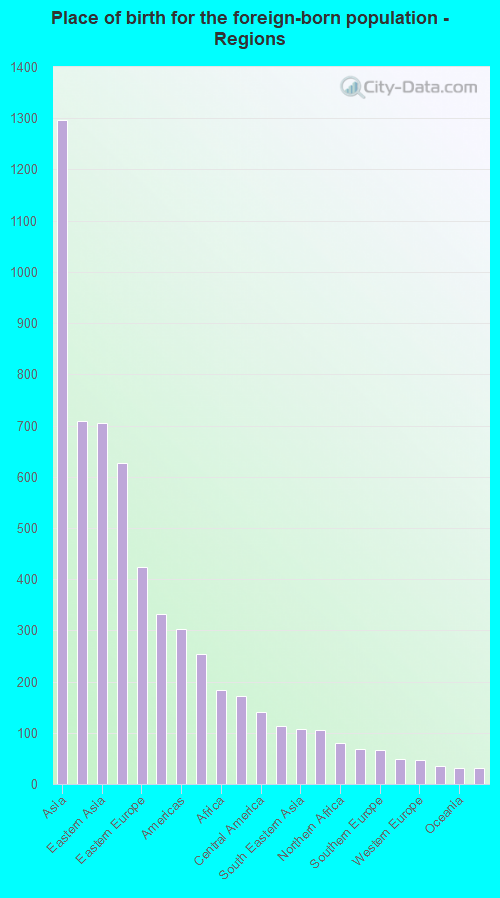
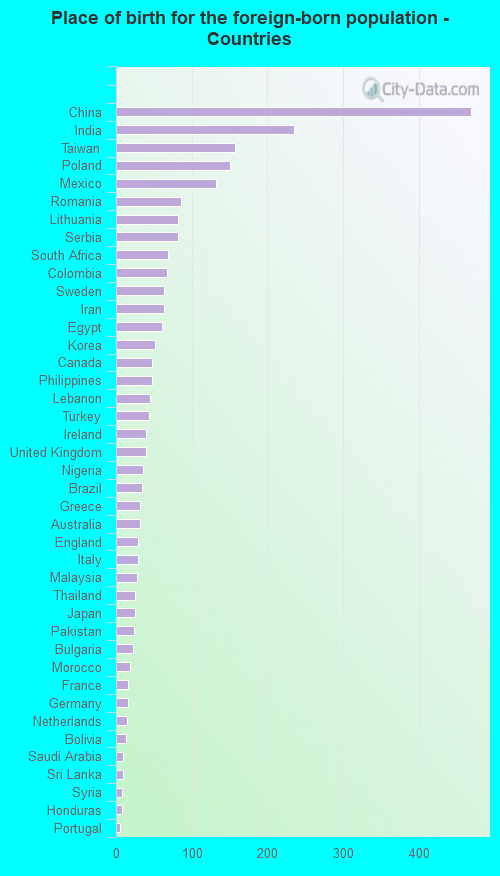
According to 2022 data, the most numerous races in Hinsdale, IL are White alone (12,424 residents), Hispanic (951 residents), and Black alone (167 residents). 79.9% of Hinsdale residents speak English at home. 14.8% of Hinsdale, IL residents are foreign-born (7.5% born in Asia, 4.1% born in Europe), which is 5.7% greater than the foreign-born rate of 14.0% across the entire state of Illinois.
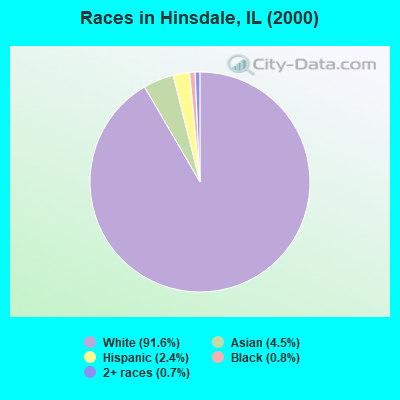
Race distribution in Hinsdale
2000 2022
8,424,140 67.8% White alone 1,856,152 14.9% Black alone 1,530,262 12.3% Hispanic 419,916 3.4% Asian alone 153,996 1.2% Two or more races 13,479 0.1% Other race alone 18,232 0.1% American Indian alone 3,116 0.03% Native Hawaiian and Other
7,356,301 58.5% White alone 2,299,726 18.3% Hispanic 1,660,423 13.2% Black alone 747,296 5.9% Asian alone 458,599 3.6% Two or more races 45,386 0.4% Other race alone 10,405 0.08% American Indian alone 3,896 0.03% Native Hawaiian and Other
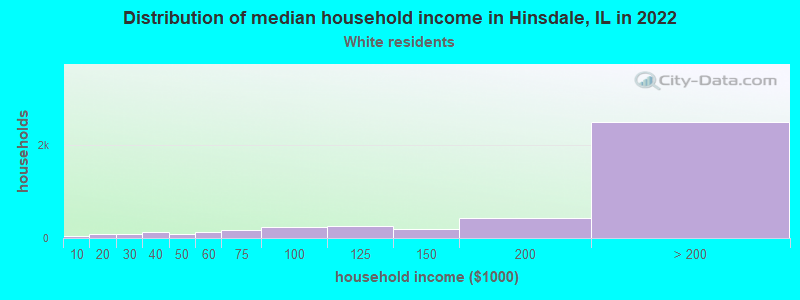
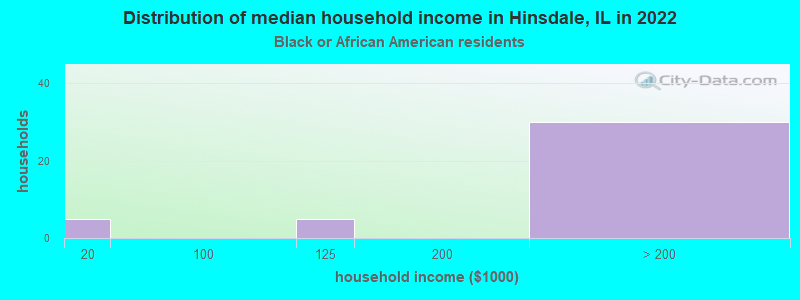
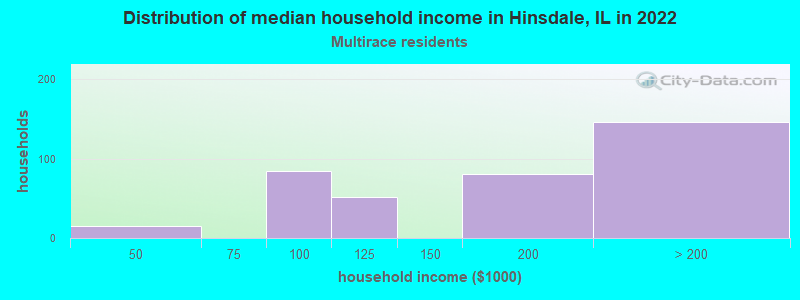
Income and house value in Hinsdale Median household income in 2022 over $200,000 White non-Hispanic householdersover $200,000 Black householdersover $200,000 Asian householdersover $200,000 Some other race householders$183,169 Two or more races householders$167,758 Hispanic or Latino race householdersMedian 2022 house value over $1,000,000 White Non-Hispanic householders$455,970 Black or African American householders $597,123 Asian householders$837,994 Two or more races householdersover $1,000,000 Hispanic or Latino householders
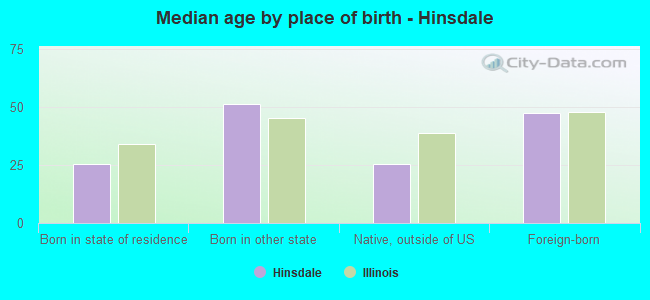
Median age by race in Hinsdale
45.4 Median age for White residents44.3 46.3 40.5 Median age for Black or African American residents42.2 39.8 -699,421,964.6 Median age for American Indian / Alaska Native residents-721,943,047.9 -545,253,862.6 39.9 Median age for Asian residents41.2 37.8 7.8 Median age for Native Hawaiian / Pacific Islander residents-658,536,584.7 -576,015,108.0 14.7 Median age for Other race residents14.2 30.2 33.7 Median age for Two or more races residents30.6 31.0 44.6 Median age for White alone residents43.8 45.7 42.6 Median age for Hispanic or Latino residents40.6 45.4
Owner/renter occupied households by race in Hinsdale
House owners and renters - White residents 4,076 90.1% Owner occupied448 9.9% Renter occupiedHouse owners and renters - Black or African American residents 20 60.0% Owner occupied14 40.0% Renter occupiedHouse owners and renters - Asian residents 749 94.4% Owner occupied45 5.6% Renter occupiedHouse owners and renters - Native Hawaiian / Pacific Islander residents 10 100.0% Owner occupiedHouse owners and renters - Other race residents 57 100.0% Owner occupiedHouse owners and renters - Two or more races residents 369 96.3% Owner occupied14 3.7% Renter occupiedHouse owners and renters - White alone residents 4,118 89.5% Owner occupied484 10.5% Renter occupiedHouse owners and renters - Hispanic or Latino residents 232 94.1% Owner occupied15 5.9% Renter occupied
Language usage in Hinsdale
English speakers - Total 79.9% of residents of Hinsdale speak English at home.
4.1% of residents speak Spanish at home 560 85.8% Speak English very well93 14.2% Speak English less than very well15.5% of residents speak other language at home 1,969 79.7% Speak English very well500 20.3% Speak English less than very well
English speakers - Born in the United States 94.7% of residents of Hinsdale speak English at home.
1.2% of residents speak Spanish at home 53 100.0% Speak English very well4.4% of residents speak other language at home 201 100.0% Speak English very well
English speakers - Native, born elsewhere 72.7% of residents of Hinsdale speak English at home.
21.4% of residents speak Spanish at home 40 100.0% Speak English less than very well8.6% of residents speak other language at home 16 100.0% Speak English very well
English speakers - Foreign-born 23.3% of residents of Hinsdale speak English at home.
7.0% of residents speak Spanish at home 135 77.6% Speak English very well39 22.4% Speak English less than very well66.9% of residents speak other language at home 1,178 70.7% Speak English very well489 29.3% Speak English less than very well
White (Caucasian) - Speak only English Native:
96.5% (10,031)Foreign-born:
36.1% (333)
White (Caucasian) - Speak another language Native:
4.1% (428)Foreign-born:
66.5% (614)
Black or African American - Speak only English Native:
77.1% (103)Foreign-born:
63.9% (17)
Black or African American - Speak another language Native:
17.4% (23)Foreign-born:
100.0% (26)
Asian - Speak only English Native:
67.7% (787)Foreign-born:
12.3% (138)
Asian - Speak another language Native:
34.1% (397)Foreign-born:
87.2% (975)
Other race - Speak only English Native:
100.0% (255)Foreign-born:
70.9% (21)
Two or more races - Speak only English Native:
69.2% (947)Foreign-born:
32.0% (82)
Two or more races - Speak another language Native:
30.2% (413)Foreign-born:
63.7% (163)
White alone - Speak only English Native:
95.1% (10,107)Foreign-born:
33.7% (346)
White alone - Speak another language Native:
4.9% (520)Foreign-born:
67.0% (688)
Hispanic or Latino - Speak only English Native:
51.7% (368)Foreign-born:
16.1% (37)
Hispanic or Latino - Speak another language Native:
47.8% (340)Foreign-born:
82.6% (191)
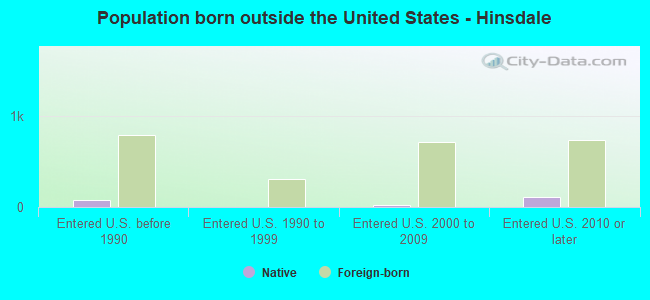
Foreign-born residents in Hinsdale 2,523 residents are foreign born (7.5% Asia , 4.1% Europe ).
This city:
14.8%Illinois:
14.1%
Marital status for residents in Hinsdale Marital status - White (Caucasian) population 15 years and over
Males 18.3% Never married74.0% Now married0.5% Separated2.1% Widowed5.2% DivorcedFemales 19.3% Never married64.3% Now married0.2% Separated9.8% Widowed6.4% DivorcedWomen who gave birth in the past 12 months Now married:
100.0% (121)Unmarried:
0.0% (0)
Women who did not give birth in the past 12 months Now married:
58.3% (1,305)Unmarried:
41.7% (935)
Marital status - Black or African American population 15 years and over
Males 30.2% Never married69.8% Now married0.0% Separated0.0% Widowed0.0% DivorcedFemales 40.0% Never married36.4% Now married0.0% Separated14.5% Widowed9.1% DivorcedWomen who did not give birth in the past 12 months Now married:
66.7% (20)Unmarried:
33.3% (10)
Marital status - Asian population 15 years and over
Males 6.7% Never married90.7% Now married1.7% Separated0.8% Widowed0.0% DivorcedFemales 9.5% Never married82.0% Now married1.4% Separated4.0% Widowed3.1% DivorcedWomen who gave birth in the past 12 months Now married:
100.0% (55)Unmarried:
0.0% (0)
Women who did not give birth in the past 12 months Now married:
85.2% (447)Unmarried:
14.8% (78)
Marital status - Other race population 15 years and over
Males 20.5% Never married79.5% Now married0.0% Separated0.0% Widowed0.0% DivorcedFemales 21.6% Never married78.4% Now married0.0% Separated0.0% Widowed0.0% DivorcedWomen who did not give birth in the past 12 months Now married:
26.7% (6)Unmarried:
73.3% (15)
Marital status - Two or more races population 15 years and over
Males 20.6% Never married67.3% Now married0.0% Separated3.8% Widowed8.4% DivorcedFemales 31.9% Never married62.0% Now married0.9% Separated0.0% Widowed5.3% DivorcedWomen who did not give birth in the past 12 months Now married:
45.7% (152)Unmarried:
54.3% (181)
Marital status - White alone, not Hispanic / Latino population 15 years and over
Males 18.4% Never married73.8% Now married0.5% Separated2.1% Widowed5.2% DivorcedFemales 19.0% Never married64.4% Now married0.2% Separated10.0% Widowed6.5% DivorcedWomen who gave birth in the past 12 months Now married:
100.0% (129)Unmarried:
0.0% (0)
Women who did not give birth in the past 12 months Now married:
58.5% (1,358)Unmarried:
41.5% (964)
Marital status - Hispanic or Latino population 15 years and over
Males 17.3% Never married73.1% Now married3.5% Separated6.1% Widowed0.0% DivorcedFemales 37.4% Never married56.6% Now married0.0% Separated0.0% Widowed6.1% DivorcedWomen who did not give birth in the past 12 months Now married:
35.8% (95)Unmarried:
64.2% (171)
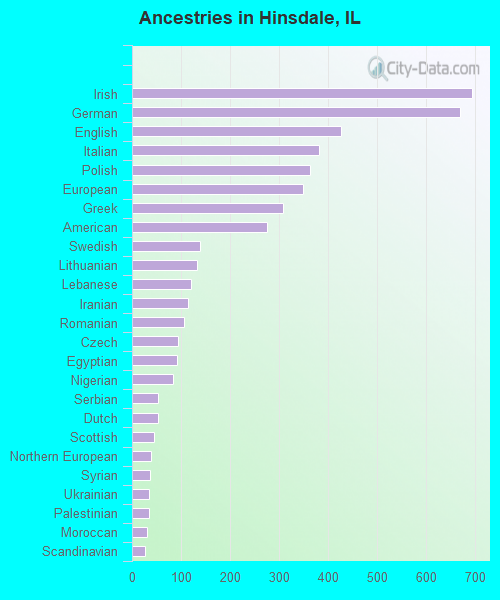
Ancestries in Hinsdale
693 9.5% Irish669 9.2% German425 5.8% English381 5.2% Italian362 5.0% Polish348 4.8% European308 4.2% Greek276 3.8% American138 1.9% Swedish133 1.8% Lithuanian121 1.7% Lebanese114 1.6% Iranian105 1.4% Romanian93 1.3% Czech92 1.3% Egyptian84 1.2% Nigerian54 0.7% Serbian52 0.7% Dutch45 0.6% Scottish38 0.5% Northern European36 0.5% Syrian35 0.5% Ukrainian34 0.5% Palestinian30 0.4% Moroccan26 0.4% Scandinavian26 0.4% British25 0.3% Hungarian23 0.3% Eastern European23 0.3% Turkish21 0.3% Czechoslovakian18 0.2% French16 0.2% Norwegian15 0.2% Croatian15 0.2% Russian13 0.2% Portuguese13 0.2% Brazilian12 0.2% French Canadian7 0.10% Armenian7 0.10% Bulgarian7 0.10% Belgian7 0.10% Welsh6 0.08% Danish6 0.08% South African6 0.08% Yugoslavian5 0.07% Scotch-Irish5 0.07% Swiss4 0.05% Jordanian4 0.05% Finnish2 0.03% Luxembourger
Children Nativity (place of birth) in Hinsdale
Children under 6 years - Living with two parents Both parents native 826 98.5% Native13 1.5% Foreign-bornBoth parents foreign-born 163 79.3% Native43 20.7% Foreign-bornOne native, one foreign-born parent 146 100.0% NativeChildren under 6 years - Living with one parent Native parent 32 100.0% NativeChildren 6 to 17 years - Living with two parents Both parents native 2,450 100.0% NativeBoth parents foreign-born 575 75.3% Native189 24.7% Foreign-bornOne native, one foreign-born parent 473 98.8% Native6 1.2% Foreign-bornChildren 6 to 17 years - Living with one parent Native parent 368 100.0% NativeForeign-born parent 16 48.1% Native18 51.9% Foreign-born