Races in Homer Glen, Illinois (IL) Detailed Stats
Data:
Races - White alone (%)
Races - White alone (% change since 2000)
Races - Black alone (%)
Races - Black alone (% change since 2000)
Races - American Indian alone (%)
Races - American Indian alone (% change since 2000)
Races - Asian alone (%)
Races - Asian alone (% change since 2000)
Races - Hispanic (%)
Races - Hispanic (% change since 2000)
Races - Native Hawaiian and Other Pacific Islander alone (%)
Races - Native Hawaiian and Other Pacific Islander alone (% change since 2000)
Races - Two or more races(%)
Races - Two or more races(% change since 2000)
Races - Other race alone (%)
Races - Other race alone (% change since 2000)
Racial diversity
Place of birth - Born in state of residence (%)
Place of birth - Born in state of residence (%) - White
Place of birth - Born in state of residence (%) - Black or African American
Place of birth - Born in state of residence (%) - Asian
Place of birth - Born in state of residence (%) - Hispanic or Latino
Place of birth - Born in state of residence (%) - American Indian and Alaska Native
Place of birth - Born in state of residence (%) - Multirace
Place of birth - Born in state of residence (%) - Other Race
Place of birth - Born in other state (%)
Place of birth - Born in other state (%) - White
Place of birth - Born in other state (%) - Black or African American
Place of birth - Born in other state (%) - Asian
Place of birth - Born in other state (%) - Hispanic or Latino
Place of birth - Born in other state (%) - American Indian and Alaska Native
Place of birth - Born in other state (%) - Multirace
Place of birth - Born in other state (%) - Other Race
Place of birth - Native, outside of US (%)
Place of birth - Native, outside of US (%) - White
Place of birth - Native, outside of US (%) - Black or African American
Place of birth - Native, outside of US (%) - Asian
Place of birth - Native, outside of US (%) - Hispanic or Latino
Place of birth - Native, outside of US (%) - American Indian and Alaska Native
Place of birth - Native, outside of US (%) - Multirace
Place of birth - Native, outside of US (%) - Other Race
Place of birth - Foreign born (%)
Place of birth - Foreign born (%) - White
Place of birth - Foreign born (%) - Black or African American
Place of birth - Foreign born (%) - Asian
Place of birth - Foreign born (%) - Hispanic or Latino
Place of birth - Foreign born (%) - American Indian and Alaska Native
Place of birth - Foreign born (%) - Multirace
Place of birth - Foreign born (%) - Other Race
Residents speaking English at home (%)
Residents speaking English at home - Born in the United States (%)
Residents speaking English at home - Native, born elsewhere (%)
Residents speaking English at home - Foreign born (%)
Residents speaking Spanish at home (%)
Residents speaking Spanish at home - Born in the United States (%)
Residents speaking Spanish at home - Native, born elsewhere (%)
Residents speaking Spanish at home - Foreign born (%)
Residents speaking other language at home (%)
Residents speaking other language at home - Born in the United States (%)
Residents speaking other language at home - Native, born elsewhere (%)
Residents speaking other language at home - Foreign born (%)
Marital status - Never married (%)
Marital status - Now married (%)
Marital status - Separated (%)
Marital status - Widowed (%)
Marital status - Divorced (%)
Ancestries Reported - Arab (%)
Ancestries Reported - Czech (%)
Ancestries Reported - Danish (%)
Ancestries Reported - Dutch (%)
Ancestries Reported - English (%)
Ancestries Reported - French (%)
Ancestries Reported - French Canadian (%)
Ancestries Reported - German (%)
Ancestries Reported - Greek (%)
Ancestries Reported - Hungarian (%)
Ancestries Reported - Irish (%)
Ancestries Reported - Italian (%)
Ancestries Reported - Lithuanian (%)
Ancestries Reported - Norwegian (%)
Ancestries Reported - Polish (%)
Ancestries Reported - Portuguese (%)
Ancestries Reported - Russian (%)
Ancestries Reported - Scotch-Irish (%)
Ancestries Reported - Scottish (%)
Ancestries Reported - Slovak (%)
Ancestries Reported - Subsaharan African (%)
Ancestries Reported - Swedish (%)
Ancestries Reported - Swiss (%)
Ancestries Reported - Ukrainian (%)
Ancestries Reported - United States (%)
Ancestries Reported - Welsh (%)
Ancestries Reported - West Indian (%)
Ancestries Reported - Other (%)
Geographical mobility - Same house 1 year ago (%)
Geographical mobility - Same house 1 year ago (%) - White
Geographical mobility - Same house 1 year ago (%) - Black or African American
Geographical mobility - Same house 1 year ago (%) - Asian
Geographical mobility - Same house 1 year ago (%) - Hispanic or Latino
Geographical mobility - Same house 1 year ago (%) - American Indian and Alaska Native
Geographical mobility - Same house 1 year ago (%) - Multirace
Geographical mobility - Same house 1 year ago (%) - Other Race
Geographical mobility - Moved within same county (%)
Geographical mobility - Moved within same county (%) - White
Geographical mobility - Moved within same county (%) - Black or African American
Geographical mobility - Moved within same county (%) - Asian
Geographical mobility - Moved within same county (%) - Hispanic or Latino
Geographical mobility - Moved within same county (%) - American Indian and Alaska Native
Geographical mobility - Moved within same county (%) - Multirace
Geographical mobility - Moved within same county (%) - Other Race
Geographical mobility - Moved from different county within same state (%)
Geographical mobility - Moved from different county within same state (%) - White
Geographical mobility - Moved from different county within same state (%) - Black or African American
Geographical mobility - Moved from different county within same state (%) - Asian
Geographical mobility - Moved from different county within same state (%) - Hispanic or Latino
Geographical mobility - Moved from different county within same state (%) - American Indian and Alaska Native
Geographical mobility - Moved from different county within same state (%) - Multirace
Geographical mobility - Moved from different county within same state (%) - Other Race
Geographical mobility - Moved from different state (%)
Geographical mobility - Moved from different state (%) - White
Geographical mobility - Moved from different state (%) - Black or African American
Geographical mobility - Moved from different state (%) - Asian
Geographical mobility - Moved from different state (%) - Hispanic or Latino
Geographical mobility - Moved from different state (%) - American Indian and Alaska Native
Geographical mobility - Moved from different state (%) - Multirace
Geographical mobility - Moved from different state (%) - Other Race
Geographical mobility - Moved from abroad (%)
Geographical mobility - Moved from abroad (%) - White
Geographical mobility - Moved from abroad (%) - Black or African American
Geographical mobility - Moved from abroad (%) - Asian
Geographical mobility - Moved from abroad (%) - Hispanic or Latino
Geographical mobility - Moved from abroad (%) - American Indian and Alaska Native
Geographical mobility - Moved from abroad (%) - Multirace
Geographical mobility - Moved from abroad (%) - Other Race
Place of birth for the foreign-born population - Ireland (%)
Place of birth for the foreign-born population - Denmark (%)
Place of birth for the foreign-born population - Norway (%)
Place of birth for the foreign-born population - Sweden (%)
Place of birth for the foreign-born population - United Kingdom (%)
Place of birth for the foreign-born population - England (%)
Place of birth for the foreign-born population - Scotland (%)
Place of birth for the foreign-born population - Other Northern Europe (%)
Place of birth for the foreign-born population - Austria (%)
Place of birth for the foreign-born population - Belgium (%)
Place of birth for the foreign-born population - France (%)
Place of birth for the foreign-born population - Germany (%)
Place of birth for the foreign-born population - Netherlands (%)
Place of birth for the foreign-born population - Switzerland (%)
Place of birth for the foreign-born population - Other Western Europe (%)
Place of birth for the foreign-born population - Greece (%)
Place of birth for the foreign-born population - Italy (%)
Place of birth for the foreign-born population - Portugal (%)
Place of birth for the foreign-born population - Spain (%)
Place of birth for the foreign-born population - Other Southern Europe (%)
Place of birth for the foreign-born population - Albania (%)
Place of birth for the foreign-born population - Belarus (%)
Place of birth for the foreign-born population - Bosnia and Herzegovina (%)
Place of birth for the foreign-born population - Bulgaria (%)
Place of birth for the foreign-born population - Croatia (%)
Place of birth for the foreign-born population - Czechoslovakia (%)
Place of birth for the foreign-born population - Hungary (%)
Place of birth for the foreign-born population - Latvia (%)
Place of birth for the foreign-born population - Lithuania (%)
Place of birth for the foreign-born population - North Macedonia (Macedonia) (%)
Place of birth for the foreign-born population - Moldova (%)
Place of birth for the foreign-born population - Poland (%)
Place of birth for the foreign-born population - Romania (%)
Place of birth for the foreign-born population - Russia (%)
Place of birth for the foreign-born population - Serbia (%)
Place of birth for the foreign-born population - Ukraine (%)
Place of birth for the foreign-born population - Other Eastern Europe (%)
Place of birth for the foreign-born population - China (%)
Place of birth for the foreign-born population - Hong Kong (%)
Place of birth for the foreign-born population - Taiwan (%)
Place of birth for the foreign-born population - Japan (%)
Place of birth for the foreign-born population - Korea (%)
Place of birth for the foreign-born population - Other Eastern Asia (%)
Place of birth for the foreign-born population - Afghanistan (%)
Place of birth for the foreign-born population - Bangladesh (%)
Place of birth for the foreign-born population - India (%)
Place of birth for the foreign-born population - Iran (%)
Place of birth for the foreign-born population - Kazakhstan (%)
Place of birth for the foreign-born population - Nepal (%)
Place of birth for the foreign-born population - Pakistan (%)
Place of birth for the foreign-born population - Sri Lanka (%)
Place of birth for the foreign-born population - Uzbekistan (%)
Place of birth for the foreign-born population - Other South Central Asia (%)
Place of birth for the foreign-born population - Burma (%)
Place of birth for the foreign-born population - Cambodia (%)
Place of birth for the foreign-born population - Indonesia (%)
Place of birth for the foreign-born population - Laos (%)
Place of birth for the foreign-born population - Malaysia (%)
Place of birth for the foreign-born population - Philippines (%)
Place of birth for the foreign-born population - Singapore (%)
Place of birth for the foreign-born population - Thailand (%)
Place of birth for the foreign-born population - Vietnam (%)
Place of birth for the foreign-born population - Other South Eastern Asia (%)
Place of birth for the foreign-born population - Armenia (%)
Place of birth for the foreign-born population - Iraq (%)
Place of birth for the foreign-born population - Israel (%)
Place of birth for the foreign-born population - Jordan (%)
Place of birth for the foreign-born population - Kuwait (%)
Place of birth for the foreign-born population - Lebanon (%)
Place of birth for the foreign-born population - Saudi Arabia (%)
Place of birth for the foreign-born population - Syria (%)
Place of birth for the foreign-born population - Turkey (%)
Place of birth for the foreign-born population - Yemen (%)
Place of birth for the foreign-born population - Other Western Asia (%)
Place of birth for the foreign-born population - Eritrea (%)
Place of birth for the foreign-born population - Ethiopia (%)
Place of birth for the foreign-born population - Kenya (%)
Place of birth for the foreign-born population - Somalia (%)
Place of birth for the foreign-born population - Uganda (%)
Place of birth for the foreign-born population - Zimbabwe (%)
Place of birth for the foreign-born population - Other Eastern Africa (%)
Place of birth for the foreign-born population - Cameroon (%)
Place of birth for the foreign-born population - Congo (%)
Place of birth for the foreign-born population - Democratic Republic of Congo (Zaire) (%)
Place of birth for the foreign-born population - Other Middle Africa (%)
Place of birth for the foreign-born population - Egypt (%)
Place of birth for the foreign-born population - Morocco (%)
Place of birth for the foreign-born population - Sudan (%)
Place of birth for the foreign-born population - Other Northern Africa (%)
Place of birth for the foreign-born population - South Africa (%)
Place of birth for the foreign-born population - Other Southern Africa (%)
Place of birth for the foreign-born population - Cabo Verde (%)
Place of birth for the foreign-born population - Ghana (%)
Place of birth for the foreign-born population - Liberia (%)
Place of birth for the foreign-born population - Nigeria (%)
Place of birth for the foreign-born population - Senegal (%)
Place of birth for the foreign-born population - Sierra Leone (%)
Place of birth for the foreign-born population - Other Western Africa (%)
Place of birth for the foreign-born population - Australia (%)
Place of birth for the foreign-born population - New Zealand (%)
Place of birth for the foreign-born population - Fiji (%)
Place of birth for the foreign-born population - Micronesia (%)
Place of birth for the foreign-born population - Bahamas (%)
Place of birth for the foreign-born population - Barbados (%)
Place of birth for the foreign-born population - Cuba (%)
Place of birth for the foreign-born population - Dominica (%)
Place of birth for the foreign-born population - Dominican Republic (%)
Place of birth for the foreign-born population - Grenada (%)
Place of birth for the foreign-born population - Haiti (%)
Place of birth for the foreign-born population - Jamaica (%)
Place of birth for the foreign-born population - St. Vincent and the Grenadines (%)
Place of birth for the foreign-born population - Trinidad and Tobago (%)
Place of birth for the foreign-born population - West Indies (%)
Place of birth for the foreign-born population - Other Caribbean (%)
Place of birth for the foreign-born population - Belize (%)
Place of birth for the foreign-born population - Costa Rica (%)
Place of birth for the foreign-born population - El Salvador (%)
Place of birth for the foreign-born population - Guatemala (%)
Place of birth for the foreign-born population - Honduras (%)
Place of birth for the foreign-born population - Mexico (%)
Place of birth for the foreign-born population - Nicaragua (%)
Place of birth for the foreign-born population - Panama (%)
Place of birth for the foreign-born population - Other Central America (%)
Place of birth for the foreign-born population - Argentina (%)
Place of birth for the foreign-born population - Bolivia (%)
Place of birth for the foreign-born population - Brazil (%)
Place of birth for the foreign-born population - Chile (%)
Place of birth for the foreign-born population - Colombia (%)
Place of birth for the foreign-born population - Ecuador (%)
Place of birth for the foreign-born population - Guyana (%)
Place of birth for the foreign-born population - Peru (%)
Place of birth for the foreign-born population - Uruguay (%)
Place of birth for the foreign-born population - Venezuela (%)
Place of birth for the foreign-born population - Other South America (%)
Place of birth for the foreign-born population - Canada (%)
Place of birth for the foreign-born population - Other Northern America (%)
Place of birth for the foreign-born population - Other (%)
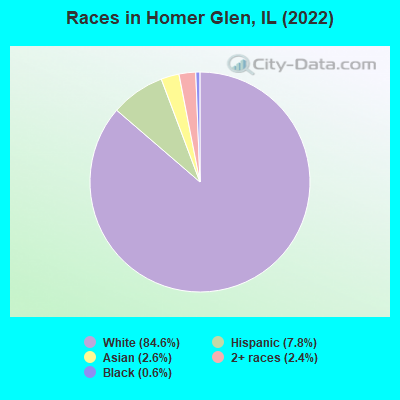
According to 2022 data, the most numerous races in Homer Glen, IL are White alone (20,720 residents), Hispanic (1,917 residents), and Black alone (158 residents). 76.4% of Homer Glen residents speak English at home.
Race distribution in Homer Glen 20,720 84.6% White alone 1,917 7.8% Hispanic 644 2.6% Asian alone 578 2.4% Two or more races 158 0.6% Black alone
2000 2022
8,424,140 67.8% White alone 1,856,152 14.9% Black alone 1,530,262 12.3% Hispanic 419,916 3.4% Asian alone 153,996 1.2% Two or more races 13,479 0.1% Other race alone 18,232 0.1% American Indian alone 3,116 0.03% Native Hawaiian and Other
7,356,301 58.5% White alone 2,299,726 18.3% Hispanic 1,660,423 13.2% Black alone 747,296 5.9% Asian alone 458,599 3.6% Two or more races 45,386 0.4% Other race alone 10,405 0.08% American Indian alone 3,896 0.03% Native Hawaiian and Other
Income and house value in Homer Glen Median household income in 2022 $121,773 White non-Hispanic householders$148,404 Some other race householders$147,996 Hispanic or Latino race householders
Median age by race in Homer Glen
44.4 Median age for White residents43.0 45.8 34.8 Median age for Black or African American residents36.1 26.0 23.2 Median age for American Indian / Alaska Native residents22.1 -844,733,984.0 48.6 Median age for Asian residents36.9 49.2 -593,236,714.4 Median age for Native Hawaiian / Pacific Islander residents-658,536,584.7 -576,015,108.0 44.2 Median age for Other race residents55.4 40.3 32.7 Median age for Two or more races residents30.8 32.0 44.0 Median age for White alone residents43.2 44.9 37.1 Median age for Hispanic or Latino residents34.2 41.5
Owner/renter occupied households by race in Homer Glen
House owners and renters - White residents 6,825 94.8% Owner occupied371 5.2% Renter occupiedHouse owners and renters - Black or African American residents 41 72.9% Owner occupied15 27.1% Renter occupiedHouse owners and renters - American Indian / Alaska Native residents 10 100.0% Owner occupiedHouse owners and renters - Asian residents 180 100.0% Owner occupiedHouse owners and renters - Other race residents 31 52.5% Owner occupied28 47.5% Renter occupiedHouse owners and renters - Two or more races residents 385 100.0% Owner occupiedHouse owners and renters - White alone residents 6,844 94.7% Owner occupied385 5.3% Renter occupiedHouse owners and renters - Hispanic or Latino residents 299 88.2% Owner occupied40 11.8% Renter occupied
Language usage in Homer Glen
English speakers - Total 76.4% of residents of Homer Glen speak English at home.
3.3% of residents speak Spanish at home 462 59.6% Speak English very well313 40.4% Speak English less than very well21.8% of residents speak other language at home 3,806 75.2% Speak English very well1,253 24.8% Speak English less than very well
English speakers - Born in the United States 92.4% of residents of Homer Glen speak English at home.
0.8% of residents speak Spanish at home 17 100.0% Speak English very well7.0% of residents speak other language at home 124 80.0% Speak English very well31 20.0% Speak English less than very well
English speakers - Native, born elsewhere 67.0% of residents of Homer Glen speak English at home.
9.5% of residents speak Spanish at home 9 34.6% Speak English very well17 65.4% Speak English less than very well30.0% of residents speak other language at home 42 51.2% Speak English very well40 48.8% Speak English less than very well
English speakers - Foreign-born 13.6% of residents of Homer Glen speak English at home.
10.2% of residents speak Spanish at home 108 30.0% Speak English very well252 70.0% Speak English less than very well79.0% of residents speak other language at home 1,662 59.6% Speak English very well1,126 40.4% Speak English less than very well
White (Caucasian) - Speak only English Native:
91.0% (15,443)Foreign-born:
17.0% (363)
White (Caucasian) - Speak another language Native:
7.6% (1,299)Foreign-born:
82.7% (1,769)
Black or African American - Speak only English Native:
99.5% (129)Foreign-born:
61.9% (3)
Asian - Speak only English Native:
57.4% (138)Foreign-born:
17.8% (71)
Asian - Speak another language Native:
39.2% (94)Foreign-born:
78.2% (310)
Other race - Speak only English Native:
65.7% (268)Foreign-born:
2.7% (7)
Other race - Speak another language Native:
37.2% (152)Foreign-born:
96.7% (234)
Two or more races - Speak only English Native:
81.1% (993)Foreign-born:
14.1% (21)
Two or more races - Speak another language Native:
16.8% (206)Foreign-born:
86.0% (130)
White alone - Speak only English Native:
89.5% (15,216)Foreign-born:
14.3% (403)
White alone - Speak another language Native:
10.8% (1,844)Foreign-born:
86.1% (2,428)
Hispanic or Latino - Speak only English Native:
77.6% (1,166)Foreign-born:
7.0% (25)
Hispanic or Latino - Speak another language Native:
24.2% (364)Foreign-born:
93.0% (338)
Foreign-born residents in Homer Glen
Marital status for residents in Homer Glen Marital status - White (Caucasian) population 15 years and over
Males 25.4% Never married67.2% Now married0.5% Separated2.5% Widowed4.2% DivorcedFemales 21.7% Never married63.2% Now married0.6% Separated9.3% Widowed5.2% DivorcedWomen who gave birth in the past 12 months Now married:
93.0% (271)Unmarried:
7.0% (20)
Women who did not give birth in the past 12 months Now married:
51.6% (1,773)Unmarried:
48.4% (1,666)
Marital status - Black or African American population 15 years and over
Males 51.1% Never married0.0% Now married48.9% Separated0.0% Widowed0.0% DivorcedFemales 76.1% Never married0.0% Now married0.0% Separated0.0% Widowed23.9% DivorcedWomen who did not give birth in the past 12 months Now married:
0.0% (0)Unmarried:
100.0% (52)
Marital status - Asian population 15 years and over
Males 39.7% Never married54.3% Now married0.0% Separated0.0% Widowed6.0% DivorcedFemales 20.5% Never married59.3% Now married0.0% Separated16.6% Widowed3.6% DivorcedWomen who did not give birth in the past 12 months Now married:
64.9% (104)Unmarried:
35.1% (56)
Marital status - Other race population 15 years and over
Males 11.9% Never married25.2% Now married0.0% Separated50.0% Widowed12.8% DivorcedFemales 31.4% Never married35.4% Now married0.0% Separated25.7% Widowed7.4% DivorcedWomen who did not give birth in the past 12 months Now married:
29.5% (35)Unmarried:
70.5% (84)
Marital status - Two or more races population 15 years and over
Males 40.6% Never married53.1% Now married0.0% Separated2.1% Widowed4.2% DivorcedFemales 39.1% Never married55.2% Now married0.0% Separated3.8% Widowed1.9% DivorcedWomen who did not give birth in the past 12 months Now married:
24.2% (68)Unmarried:
75.8% (213)
Marital status - White alone, not Hispanic / Latino population 15 years and over
Males 24.7% Never married67.8% Now married0.6% Separated2.6% Widowed4.3% DivorcedFemales 21.4% Never married63.5% Now married0.6% Separated9.4% Widowed5.1% DivorcedWomen who gave birth in the past 12 months Now married:
93.0% (288)Unmarried:
7.0% (22)
Women who did not give birth in the past 12 months Now married:
51.5% (1,830)Unmarried:
48.5% (1,722)
Marital status - Hispanic or Latino population 15 years and over
Males 34.6% Never married45.5% Now married0.0% Separated14.2% Widowed5.7% DivorcedFemales 28.8% Never married55.3% Now married0.0% Separated10.1% Widowed5.7% DivorcedWomen who did not give birth in the past 12 months Now married:
39.5% (110)Unmarried:
60.5% (168)
Ancestries in Homer Glen
3,364 30.4% Polish1,134 10.2% Irish1,037 9.4% Italian624 5.6% Lithuanian622 5.6% Palestinian616 5.6% German499 4.5% American332 3.0% English226 2.0% Dutch206 1.9% Arab168 1.5% Czech105 0.9% European102 0.9% Greek79 0.7% Jordanian79 0.7% Swedish73 0.7% Syrian67 0.6% Ukrainian52 0.5% Eastern European41 0.4% Croatian41 0.4% Slovak39 0.4% Scottish31 0.3% Scotch-Irish29 0.3% French25 0.2% Norwegian22 0.2% French Canadian22 0.2% Belgian22 0.2% Serbian14 0.1% Latvian13 0.1% British13 0.1% Slovene13 0.1% Austrian11 0.10% Danish10 0.09% Israeli10 0.09% Northern European9 0.08% Assyrian8 0.07% Hungarian8 0.07% Albanian7 0.06% Welsh7 0.06% Yugoslavian5 0.05% Russian3 0.03% Ethiopian
Children Nativity (place of birth) in Homer Glen
Children under 6 years - Living with two parents Both parents native 854 100.0% NativeBoth parents foreign-born 543 99.4% Native3 0.6% Foreign-bornOne native, one foreign-born parent 29 100.0% NativeChildren under 6 years - Living with one parent Native parent 156 100.0% NativeForeign-born parent 71 100.0% NativeChildren 6 to 17 years - Living with two parents Both parents native 2,164 99.2% Native17 0.8% Foreign-bornBoth parents foreign-born 768 95.9% Native33 4.1% Foreign-bornOne native, one foreign-born parent 399 100.0% NativeChildren 6 to 17 years - Living with one parent Native parent 454 100.0% NativeForeign-born parent 7 47.4% Native7 52.6% Foreign-born
Grandparents responsible for own grandchildren in Homer Glen
Grandparents (30 to 59 years) White / Caucasian 102 100.0% Not responsible for grandchildrenAsian 28 100.0% Not responsible for grandchildrenWhite alone, not Hispanic / Latino 127 100.0% Not responsible for grandchildrenGrandparents (60 years and over) White / Caucasian 42 11.8% Responsible for grandchildren319 88.2% Not responsible for grandchildrenWhite alone, not Hispanic / Latino 36 10.2% Responsible for grandchildren315 89.8% Not responsible for grandchildren