Races in Hutto, Texas (TX) Detailed Stats
Data:
Races - White alone (%)
Races - White alone (% change since 2000)
Races - Black alone (%)
Races - Black alone (% change since 2000)
Races - American Indian alone (%)
Races - American Indian alone (% change since 2000)
Races - Asian alone (%)
Races - Asian alone (% change since 2000)
Races - Hispanic (%)
Races - Hispanic (% change since 2000)
Races - Native Hawaiian and Other Pacific Islander alone (%)
Races - Native Hawaiian and Other Pacific Islander alone (% change since 2000)
Races - Two or more races(%)
Races - Two or more races(% change since 2000)
Races - Other race alone (%)
Races - Other race alone (% change since 2000)
Racial diversity
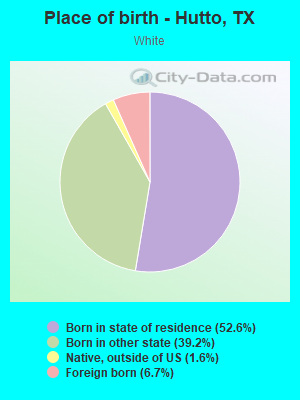
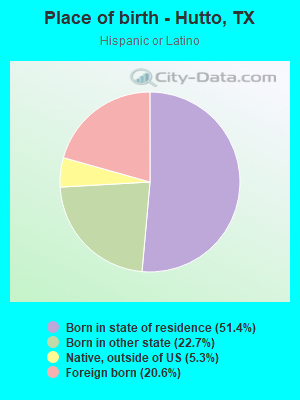
Place of birth - Born in state of residence (%)
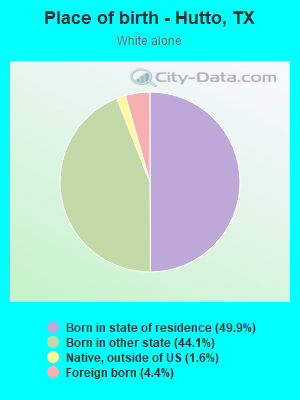
Place of birth - Born in state of residence (%) - White
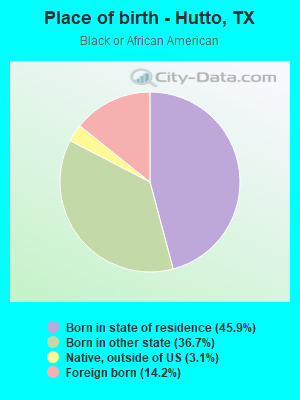
Place of birth - Born in state of residence (%) - Black or African American
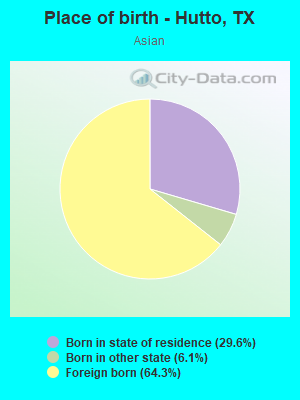
Place of birth - Born in state of residence (%) - Asian
Place of birth - Born in state of residence (%) - Hispanic or Latino
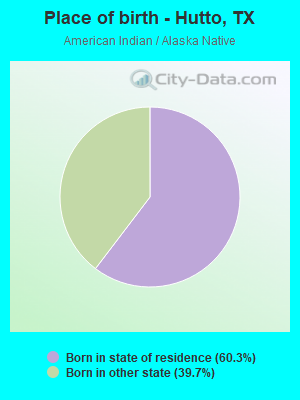
Place of birth - Born in state of residence (%) - American Indian and Alaska Native
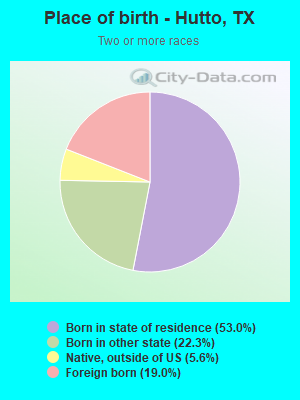
Place of birth - Born in state of residence (%) - Multirace
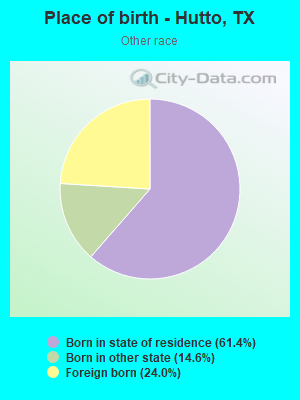
Place of birth - Born in state of residence (%) - Other Race
Place of birth - Born in other state (%)
Place of birth - Born in other state (%) - White
Place of birth - Born in other state (%) - Black or African American
Place of birth - Born in other state (%) - Asian
Place of birth - Born in other state (%) - Hispanic or Latino
Place of birth - Born in other state (%) - American Indian and Alaska Native
Place of birth - Born in other state (%) - Multirace
Place of birth - Born in other state (%) - Other Race
Place of birth - Native, outside of US (%)
Place of birth - Native, outside of US (%) - White
Place of birth - Native, outside of US (%) - Black or African American
Place of birth - Native, outside of US (%) - Asian
Place of birth - Native, outside of US (%) - Hispanic or Latino
Place of birth - Native, outside of US (%) - American Indian and Alaska Native
Place of birth - Native, outside of US (%) - Multirace
Place of birth - Native, outside of US (%) - Other Race
Place of birth - Foreign born (%)
Place of birth - Foreign born (%) - White
Place of birth - Foreign born (%) - Black or African American
Place of birth - Foreign born (%) - Asian
Place of birth - Foreign born (%) - Hispanic or Latino
Place of birth - Foreign born (%) - American Indian and Alaska Native
Place of birth - Foreign born (%) - Multirace
Place of birth - Foreign born (%) - Other Race
Residents speaking English at home (%)
Residents speaking English at home - Born in the United States (%)
Residents speaking English at home - Native, born elsewhere (%)
Residents speaking English at home - Foreign born (%)
Residents speaking Spanish at home (%)
Residents speaking Spanish at home - Born in the United States (%)
Residents speaking Spanish at home - Native, born elsewhere (%)
Residents speaking Spanish at home - Foreign born (%)
Residents speaking other language at home (%)
Residents speaking other language at home - Born in the United States (%)
Residents speaking other language at home - Native, born elsewhere (%)
Residents speaking other language at home - Foreign born (%)
Marital status - Never married (%)
Marital status - Now married (%)
Marital status - Separated (%)
Marital status - Widowed (%)
Marital status - Divorced (%)
Ancestries Reported - Arab (%)
Ancestries Reported - Czech (%)
Ancestries Reported - Danish (%)
Ancestries Reported - Dutch (%)
Ancestries Reported - English (%)
Ancestries Reported - French (%)
Ancestries Reported - French Canadian (%)
Ancestries Reported - German (%)
Ancestries Reported - Greek (%)
Ancestries Reported - Hungarian (%)
Ancestries Reported - Irish (%)
Ancestries Reported - Italian (%)
Ancestries Reported - Lithuanian (%)
Ancestries Reported - Norwegian (%)
Ancestries Reported - Polish (%)
Ancestries Reported - Portuguese (%)
Ancestries Reported - Russian (%)
Ancestries Reported - Scotch-Irish (%)
Ancestries Reported - Scottish (%)
Ancestries Reported - Slovak (%)
Ancestries Reported - Subsaharan African (%)
Ancestries Reported - Swedish (%)
Ancestries Reported - Swiss (%)
Ancestries Reported - Ukrainian (%)
Ancestries Reported - United States (%)
Ancestries Reported - Welsh (%)
Ancestries Reported - West Indian (%)
Ancestries Reported - Other (%)
Geographical mobility - Same house 1 year ago (%)
Geographical mobility - Same house 1 year ago (%) - White
Geographical mobility - Same house 1 year ago (%) - Black or African American
Geographical mobility - Same house 1 year ago (%) - Asian
Geographical mobility - Same house 1 year ago (%) - Hispanic or Latino
Geographical mobility - Same house 1 year ago (%) - American Indian and Alaska Native
Geographical mobility - Same house 1 year ago (%) - Multirace
Geographical mobility - Same house 1 year ago (%) - Other Race
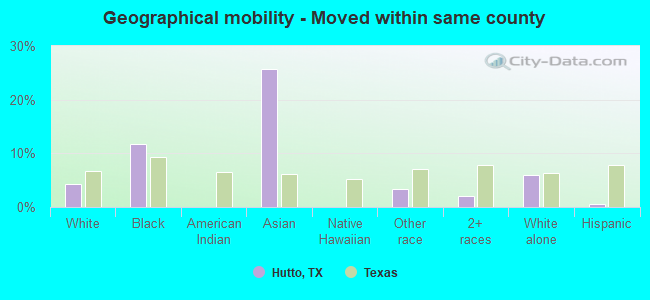
Geographical mobility - Moved within same county (%)
Geographical mobility - Moved within same county (%) - White
Geographical mobility - Moved within same county (%) - Black or African American
Geographical mobility - Moved within same county (%) - Asian
Geographical mobility - Moved within same county (%) - Hispanic or Latino
Geographical mobility - Moved within same county (%) - American Indian and Alaska Native
Geographical mobility - Moved within same county (%) - Multirace
Geographical mobility - Moved within same county (%) - Other Race
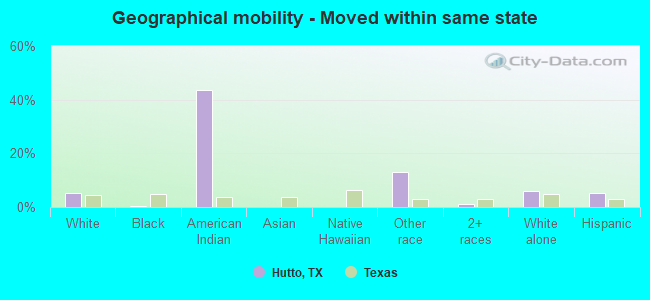
Geographical mobility - Moved from different county within same state (%)
Geographical mobility - Moved from different county within same state (%) - White
Geographical mobility - Moved from different county within same state (%) - Black or African American
Geographical mobility - Moved from different county within same state (%) - Asian
Geographical mobility - Moved from different county within same state (%) - Hispanic or Latino
Geographical mobility - Moved from different county within same state (%) - American Indian and Alaska Native
Geographical mobility - Moved from different county within same state (%) - Multirace
Geographical mobility - Moved from different county within same state (%) - Other Race
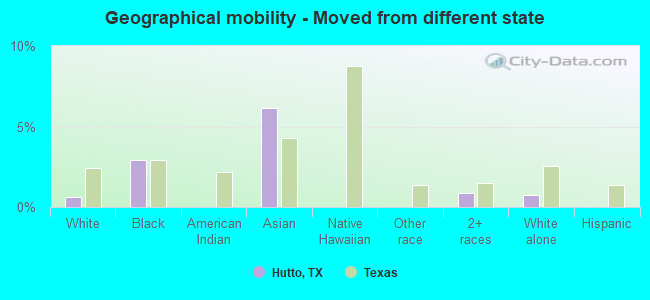
Geographical mobility - Moved from different state (%)
Geographical mobility - Moved from different state (%) - White
Geographical mobility - Moved from different state (%) - Black or African American
Geographical mobility - Moved from different state (%) - Asian
Geographical mobility - Moved from different state (%) - Hispanic or Latino
Geographical mobility - Moved from different state (%) - American Indian and Alaska Native
Geographical mobility - Moved from different state (%) - Multirace
Geographical mobility - Moved from different state (%) - Other Race
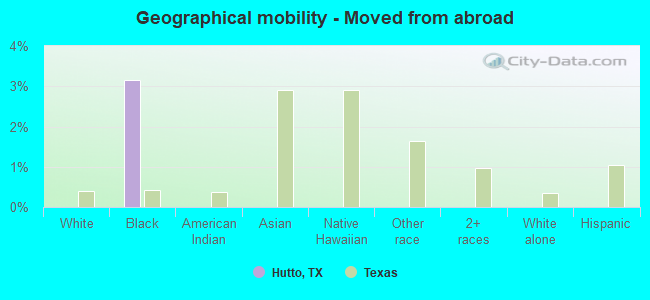
Geographical mobility - Moved from abroad (%)
Geographical mobility - Moved from abroad (%) - White
Geographical mobility - Moved from abroad (%) - Black or African American
Geographical mobility - Moved from abroad (%) - Asian
Geographical mobility - Moved from abroad (%) - Hispanic or Latino
Geographical mobility - Moved from abroad (%) - American Indian and Alaska Native
Geographical mobility - Moved from abroad (%) - Multirace
Geographical mobility - Moved from abroad (%) - Other Race
Place of birth for the foreign-born population - Ireland (%)
Place of birth for the foreign-born population - Denmark (%)
Place of birth for the foreign-born population - Norway (%)
Place of birth for the foreign-born population - Sweden (%)
Place of birth for the foreign-born population - United Kingdom (%)
Place of birth for the foreign-born population - England (%)
Place of birth for the foreign-born population - Scotland (%)
Place of birth for the foreign-born population - Other Northern Europe (%)
Place of birth for the foreign-born population - Austria (%)
Place of birth for the foreign-born population - Belgium (%)
Place of birth for the foreign-born population - France (%)
Place of birth for the foreign-born population - Germany (%)
Place of birth for the foreign-born population - Netherlands (%)
Place of birth for the foreign-born population - Switzerland (%)
Place of birth for the foreign-born population - Other Western Europe (%)
Place of birth for the foreign-born population - Greece (%)
Place of birth for the foreign-born population - Italy (%)
Place of birth for the foreign-born population - Portugal (%)
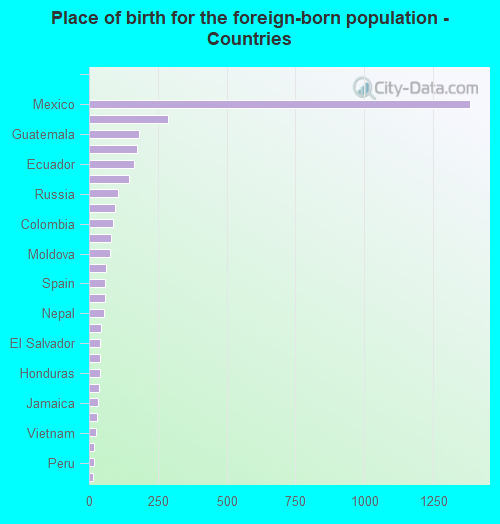
Place of birth for the foreign-born population - Spain (%)
Place of birth for the foreign-born population - Other Southern Europe (%)
Place of birth for the foreign-born population - Albania (%)
Place of birth for the foreign-born population - Belarus (%)
Place of birth for the foreign-born population - Bosnia and Herzegovina (%)
Place of birth for the foreign-born population - Bulgaria (%)
Place of birth for the foreign-born population - Croatia (%)
Place of birth for the foreign-born population - Czechoslovakia (%)
Place of birth for the foreign-born population - Hungary (%)
Place of birth for the foreign-born population - Latvia (%)
Place of birth for the foreign-born population - Lithuania (%)
Place of birth for the foreign-born population - North Macedonia (Macedonia) (%)
Place of birth for the foreign-born population - Moldova (%)
Place of birth for the foreign-born population - Poland (%)
Place of birth for the foreign-born population - Romania (%)
Place of birth for the foreign-born population - Russia (%)
Place of birth for the foreign-born population - Serbia (%)
Place of birth for the foreign-born population - Ukraine (%)
Place of birth for the foreign-born population - Other Eastern Europe (%)
Place of birth for the foreign-born population - China (%)
Place of birth for the foreign-born population - Hong Kong (%)
Place of birth for the foreign-born population - Taiwan (%)
Place of birth for the foreign-born population - Japan (%)
Place of birth for the foreign-born population - Korea (%)
Place of birth for the foreign-born population - Other Eastern Asia (%)
Place of birth for the foreign-born population - Afghanistan (%)
Place of birth for the foreign-born population - Bangladesh (%)
Place of birth for the foreign-born population - India (%)
Place of birth for the foreign-born population - Iran (%)
Place of birth for the foreign-born population - Kazakhstan (%)
Place of birth for the foreign-born population - Nepal (%)
Place of birth for the foreign-born population - Pakistan (%)
Place of birth for the foreign-born population - Sri Lanka (%)
Place of birth for the foreign-born population - Uzbekistan (%)
Place of birth for the foreign-born population - Other South Central Asia (%)
Place of birth for the foreign-born population - Burma (%)
Place of birth for the foreign-born population - Cambodia (%)
Place of birth for the foreign-born population - Indonesia (%)
Place of birth for the foreign-born population - Laos (%)
Place of birth for the foreign-born population - Malaysia (%)
Place of birth for the foreign-born population - Philippines (%)
Place of birth for the foreign-born population - Singapore (%)
Place of birth for the foreign-born population - Thailand (%)
Place of birth for the foreign-born population - Vietnam (%)
Place of birth for the foreign-born population - Other South Eastern Asia (%)
Place of birth for the foreign-born population - Armenia (%)
Place of birth for the foreign-born population - Iraq (%)
Place of birth for the foreign-born population - Israel (%)
Place of birth for the foreign-born population - Jordan (%)
Place of birth for the foreign-born population - Kuwait (%)
Place of birth for the foreign-born population - Lebanon (%)
Place of birth for the foreign-born population - Saudi Arabia (%)
Place of birth for the foreign-born population - Syria (%)
Place of birth for the foreign-born population - Turkey (%)
Place of birth for the foreign-born population - Yemen (%)
Place of birth for the foreign-born population - Other Western Asia (%)
Place of birth for the foreign-born population - Eritrea (%)
Place of birth for the foreign-born population - Ethiopia (%)
Place of birth for the foreign-born population - Kenya (%)
Place of birth for the foreign-born population - Somalia (%)
Place of birth for the foreign-born population - Uganda (%)
Place of birth for the foreign-born population - Zimbabwe (%)
Place of birth for the foreign-born population - Other Eastern Africa (%)
Place of birth for the foreign-born population - Cameroon (%)
Place of birth for the foreign-born population - Congo (%)
Place of birth for the foreign-born population - Democratic Republic of Congo (Zaire) (%)
Place of birth for the foreign-born population - Other Middle Africa (%)
Place of birth for the foreign-born population - Egypt (%)
Place of birth for the foreign-born population - Morocco (%)
Place of birth for the foreign-born population - Sudan (%)
Place of birth for the foreign-born population - Other Northern Africa (%)
Place of birth for the foreign-born population - South Africa (%)
Place of birth for the foreign-born population - Other Southern Africa (%)
Place of birth for the foreign-born population - Cabo Verde (%)
Place of birth for the foreign-born population - Ghana (%)
Place of birth for the foreign-born population - Liberia (%)
Place of birth for the foreign-born population - Nigeria (%)
Place of birth for the foreign-born population - Senegal (%)
Place of birth for the foreign-born population - Sierra Leone (%)
Place of birth for the foreign-born population - Other Western Africa (%)
Place of birth for the foreign-born population - Australia (%)
Place of birth for the foreign-born population - New Zealand (%)
Place of birth for the foreign-born population - Fiji (%)
Place of birth for the foreign-born population - Micronesia (%)
Place of birth for the foreign-born population - Bahamas (%)
Place of birth for the foreign-born population - Barbados (%)
Place of birth for the foreign-born population - Cuba (%)
Place of birth for the foreign-born population - Dominica (%)
Place of birth for the foreign-born population - Dominican Republic (%)
Place of birth for the foreign-born population - Grenada (%)
Place of birth for the foreign-born population - Haiti (%)
Place of birth for the foreign-born population - Jamaica (%)
Place of birth for the foreign-born population - St. Vincent and the Grenadines (%)
Place of birth for the foreign-born population - Trinidad and Tobago (%)
Place of birth for the foreign-born population - West Indies (%)
Place of birth for the foreign-born population - Other Caribbean (%)
Place of birth for the foreign-born population - Belize (%)
Place of birth for the foreign-born population - Costa Rica (%)
Place of birth for the foreign-born population - El Salvador (%)
Place of birth for the foreign-born population - Guatemala (%)
Place of birth for the foreign-born population - Honduras (%)
Place of birth for the foreign-born population - Mexico (%)
Place of birth for the foreign-born population - Nicaragua (%)
Place of birth for the foreign-born population - Panama (%)
Place of birth for the foreign-born population - Other Central America (%)
Place of birth for the foreign-born population - Argentina (%)
Place of birth for the foreign-born population - Bolivia (%)
Place of birth for the foreign-born population - Brazil (%)
Place of birth for the foreign-born population - Chile (%)
Place of birth for the foreign-born population - Colombia (%)
Place of birth for the foreign-born population - Ecuador (%)
Place of birth for the foreign-born population - Guyana (%)
Place of birth for the foreign-born population - Peru (%)
Place of birth for the foreign-born population - Uruguay (%)
Place of birth for the foreign-born population - Venezuela (%)
Place of birth for the foreign-born population - Other South America (%)
Place of birth for the foreign-born population - Canada (%)
Place of birth for the foreign-born population - Other Northern America (%)
Place of birth for the foreign-born population - Other (%)
Latest news about races in Hutto, TX collected exclusively by city-data.com from local newspapers, TV, and radio stations
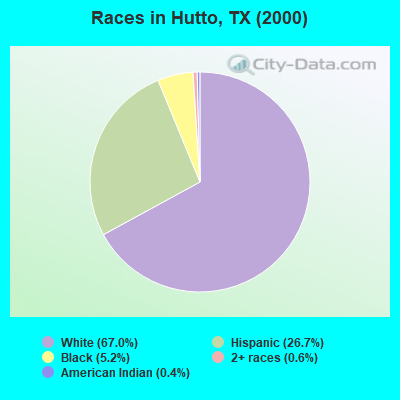
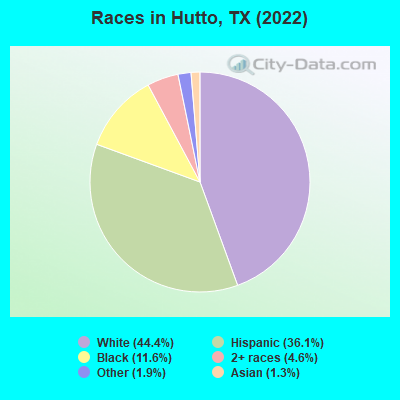
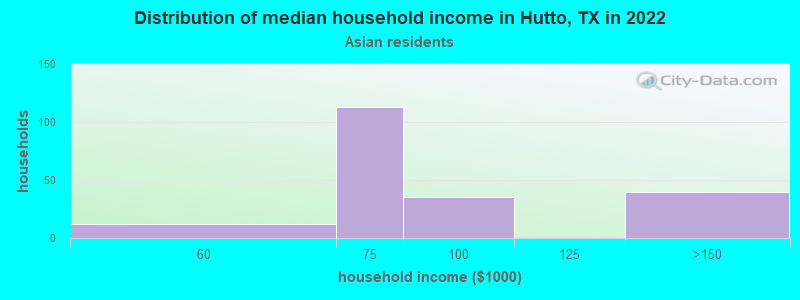
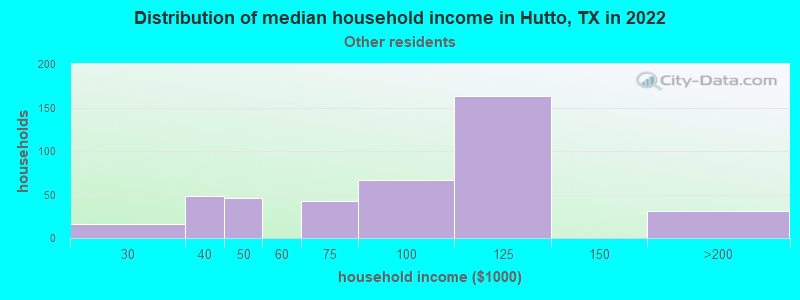
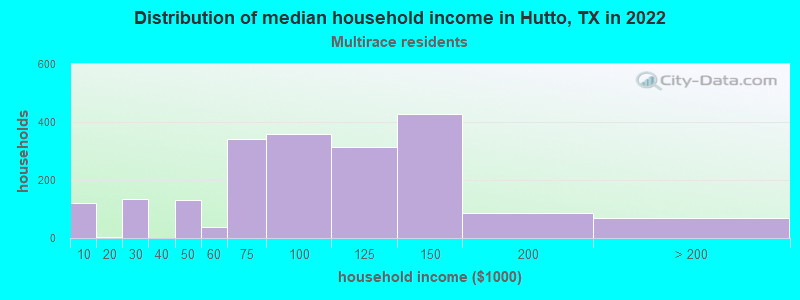
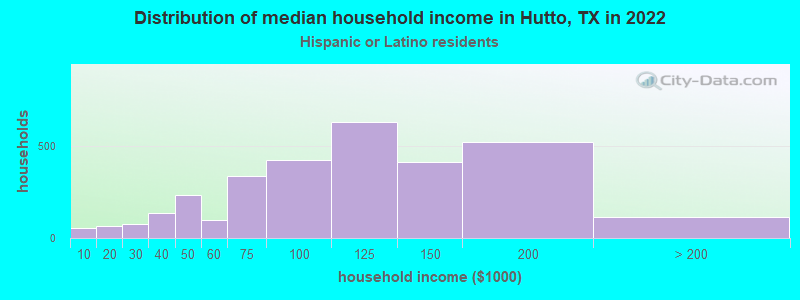
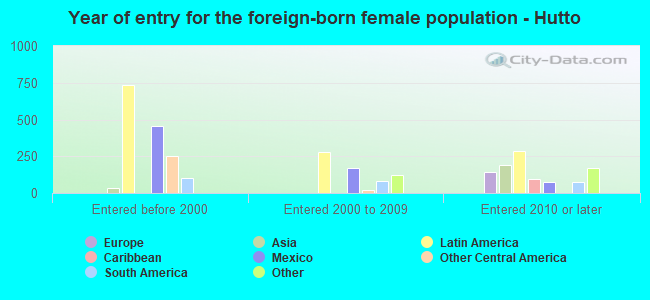
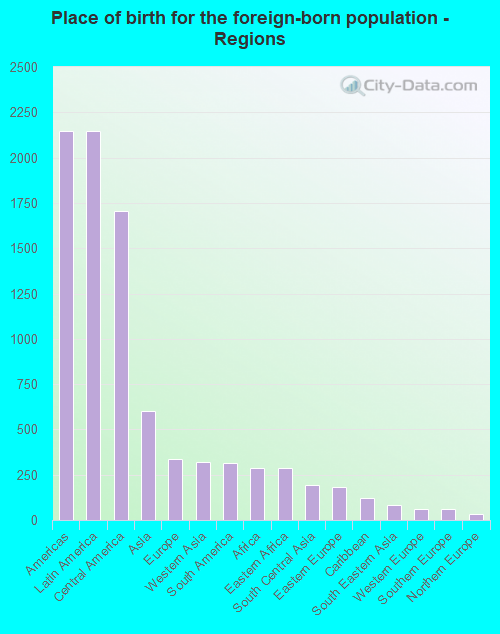
According to 2022 data, the most numerous races in Hutto, TX are Hispanic (11,572 residents), White alone (14,230 residents), and Black alone (3,717 residents). 71.0% of Hutto residents speak English at home. 10.5% of Hutto, TX residents are foreign-born (7.0% born in Latin America, 2.0% born in Asia, 1.1% born in Europe), which is 61.8% less than the foreign-born rate of 17.0% across the entire state of Texas.
Race distribution in Hutto
2000 2022
10,933,313 52.4% White alone 6,669,666 32.0% Hispanic 2,364,255 11.3% Black alone 554,445 2.7% Asian alone 230,567 1.1% Two or more races 68,859 0.3% American Indian alone 19,958 0.10% Other race alone 10,757 0.05% Native Hawaiian and Other
12,070,642 40.2% Hispanic 11,683,430 38.9% White alone 3,508,706 11.7% Black alone 1,608,173 5.4% Asian alone 956,560 3.2% Two or more races 125,763 0.4% Other race alone 47,023 0.2% American Indian alone 29,275 0.10% Native Hawaiian and Other
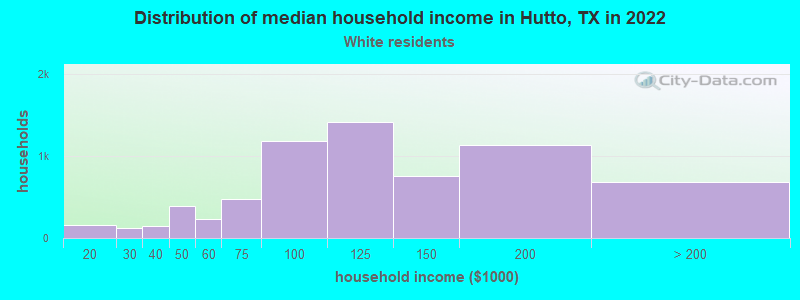
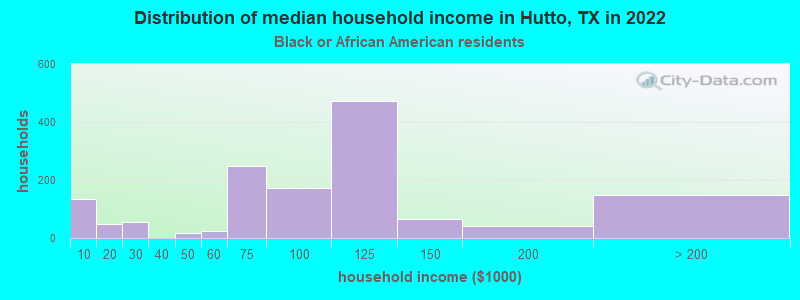
Income and house value in Hutto Median household income in 2022 $104,053 White non-Hispanic householders$108,016 Black householders$64,244 Asian householders$106,401 Some other race householders$95,357 Two or more races householders$111,340 Hispanic or Latino race householdersMedian 2022 house value $357,603 White Non-Hispanic householders$378,278 Black or African American householders$143,577 American Indian or Alaska Native householders$268,011 Some other race householders$430,732 Two or more races householders$263,416 Hispanic or Latino householders
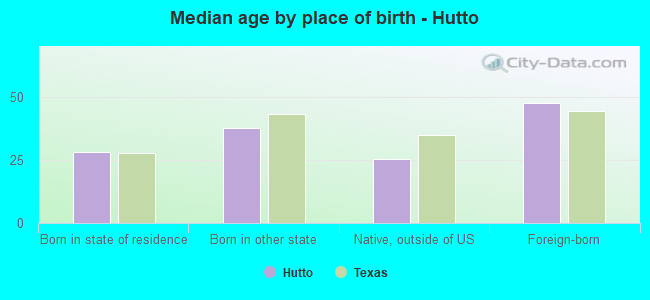
Median age by race in Hutto
36.2 Median age for White residents36.1 36.3 42.4 Median age for Black or African American residents43.2 46.6 -786,008,229.7 Median age for American Indian / Alaska Native residents-897,347,173.3 -635,991,819.4 39.0 Median age for Asian residents42.9 30.1 -682,125,603.2 Median age for Native Hawaiian / Pacific Islander residents-612,729,233.5 -577,777,777.2 38.3 Median age for Other race residents26.1 40.3 28.7 Median age for Two or more races residents31.1 29.5 36.3 Median age for White alone residents36.8 36.0 32.7 Median age for Hispanic or Latino residents24.5 34.6
Owner/renter occupied households by race in Hutto
House owners and renters - White residents 5,415 79.3% Owner occupied1,415 20.7% Renter occupiedHouse owners and renters - Black or African American residents 846 79.3% Owner occupied221 20.7% Renter occupiedHouse owners and renters - American Indian / Alaska Native residents 31 100.0% Owner occupiedHouse owners and renters - Asian residents 198 93.5% Owner occupied14 6.5% Renter occupiedHouse owners and renters - Other race residents 585 93.6% Owner occupied40 6.4% Renter occupiedHouse owners and renters - Two or more races residents 1,831 90.0% Owner occupied203 10.0% Renter occupiedHouse owners and renters - White alone residents 4,471 77.4% Owner occupied1,309 22.6% Renter occupiedHouse owners and renters - Hispanic or Latino residents 2,738 88.0% Owner occupied375 12.0% Renter occupied
Language usage in Hutto
English speakers - Total 71.0% of residents of Hutto speak English at home.
22.5% of residents speak Spanish at home 4,502 67.2% Speak English very well2,200 32.8% Speak English less than very well5.9% of residents speak other language at home 1,411 80.1% Speak English very well351 19.9% Speak English less than very well
English speakers - Born in the United States 85.7% of residents of Hutto speak English at home.
14.7% of residents speak Spanish at home 964 65.3% Speak English very well512 34.7% Speak English less than very well0.6% of residents speak other language at home 59 100.0% Speak English very well
English speakers - Native, born elsewhere 46.5% of residents of Hutto speak English at home.
47.3% of residents speak Spanish at home 320 80.6% Speak English very well77 19.4% Speak English less than very well
English speakers - Foreign-born 10.7% of residents of Hutto speak English at home.
55.2% of residents speak Spanish at home 689 30.4% Speak English very well1,578 69.6% Speak English less than very well31.2% of residents speak other language at home 982 76.8% Speak English very well297 23.2% Speak English less than very well
White (Caucasian) - Speak only English Native:
87.5% (13,542)Foreign-born:
23.4% (282)
White (Caucasian) - Speak another language Native:
10.2% (1,572)Foreign-born:
76.1% (916)
Black or African American - Speak only English Native:
94.2% (3,056)Foreign-born:
16.9% (91)
Black or African American - Speak another language Native:
5.8% (188)Foreign-born:
81.1% (438)
Asian - Speak another language Native:
73.2% (101)Foreign-born:
100.0% (293)
Other race - Speak only English Native:
56.4% (1,135)Foreign-born:
3.7% (25)
Other race - Speak another language Native:
40.8% (821)Foreign-born:
97.0% (659)
Two or more races - Speak only English Native:
62.5% (3,105)Foreign-born:
1.2% (16)
Two or more races - Speak another language Native:
38.0% (1,888)Foreign-born:
100.0% (1,349)
White alone - Speak only English Native:
94.4% (12,143)Foreign-born:
23.7% (150)
White alone - Speak another language Native:
5.6% (714)Foreign-born:
77.8% (491)
Hispanic or Latino - Speak only English Native:
52.1% (4,115)Foreign-born:
5.0% (122)
Hispanic or Latino - Speak another language Native:
48.5% (3,830)Foreign-born:
94.4% (2,293)
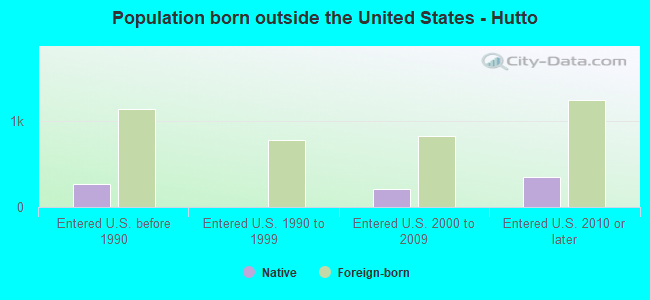
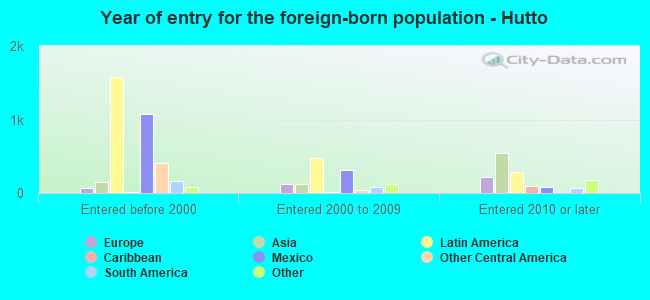
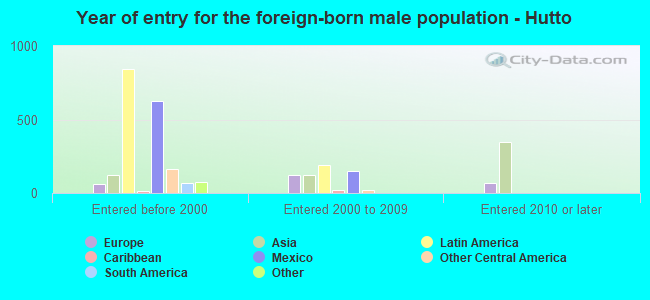
Foreign-born residents in Hutto 3,370 residents are foreign born (7.0% Latin America , 2.0% Asia , 1.1% Europe ).
This city:
10.5%Texas:
17.1%
Marital status for residents in Hutto Marital status - White (Caucasian) population 15 years and over
Males 27.1% Never married60.8% Now married1.8% Separated0.8% Widowed9.5% DivorcedFemales 24.5% Never married60.8% Now married1.1% Separated2.9% Widowed10.7% DivorcedWomen who gave birth in the past 12 months Now married:
100.0% (480)Unmarried:
0.0% (0)
Women who did not give birth in the past 12 months Now married:
61.2% (3,088)Unmarried:
38.8% (1,962)
Marital status - Black or African American population 15 years and over
Males 55.1% Never married37.9% Now married0.0% Separated1.0% Widowed5.9% DivorcedFemales 27.4% Never married49.5% Now married0.0% Separated0.0% Widowed23.0% DivorcedWomen who did not give birth in the past 12 months Now married:
42.9% (460)Unmarried:
57.1% (612)
Marital status - Asian population 15 years and over
Males 28.8% Never married71.2% Now married0.0% Separated0.0% Widowed0.0% DivorcedFemales 14.5% Never married85.5% Now married0.0% Separated0.0% Widowed0.0% DivorcedWomen who gave birth in the past 12 months Now married:
100.0% (33)Unmarried:
0.0% (0)
Women who did not give birth in the past 12 months Now married:
81.5% (98)Unmarried:
18.5% (22)
Marital status - Other race population 15 years and over
Males 45.0% Never married40.8% Now married0.0% Separated0.0% Widowed14.2% DivorcedFemales 16.2% Never married55.3% Now married0.0% Separated5.7% Widowed22.8% DivorcedWomen who gave birth in the past 12 months Now married:
48.8% (103)Unmarried:
51.2% (108)
Women who did not give birth in the past 12 months Now married:
55.1% (350)Unmarried:
44.9% (286)
Marital status - Two or more races population 15 years and over
Males 31.3% Never married52.2% Now married8.1% Separated0.0% Widowed8.3% DivorcedFemales 34.0% Never married52.3% Now married4.8% Separated3.1% Widowed5.8% DivorcedWomen who gave birth in the past 12 months Now married:
81.6% (177)Unmarried:
18.4% (40)
Women who did not give birth in the past 12 months Now married:
50.2% (1,054)Unmarried:
49.8% (1,044)
Marital status - White alone, not Hispanic / Latino population 15 years and over
Males 28.2% Never married61.9% Now married2.4% Separated0.6% Widowed6.9% DivorcedFemales 24.1% Never married59.9% Now married1.1% Separated3.1% Widowed11.7% DivorcedWomen who gave birth in the past 12 months Now married:
100.0% (346)Unmarried:
0.0% (0)
Women who did not give birth in the past 12 months Now married:
61.9% (2,583)Unmarried:
38.1% (1,590)
Marital status - Hispanic or Latino population 15 years and over
Males 30.2% Never married53.9% Now married2.0% Separated0.6% Widowed13.2% DivorcedFemales 26.1% Never married59.7% Now married2.5% Separated3.4% Widowed8.4% DivorcedWomen who gave birth in the past 12 months Now married:
87.4% (498)Unmarried:
12.6% (72)
Women who did not give birth in the past 12 months Now married:
55.0% (1,786)Unmarried:
45.0% (1,461)
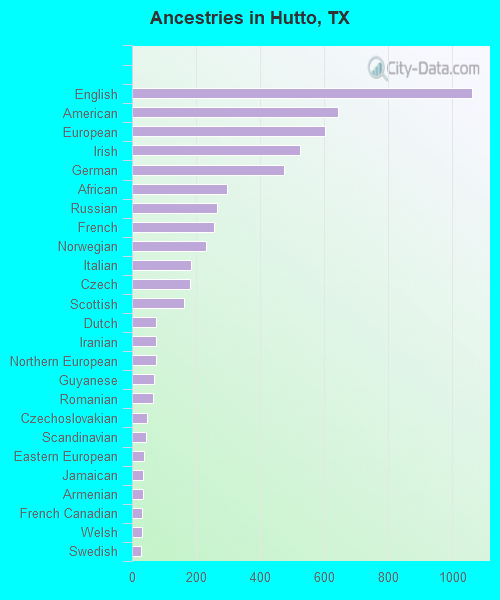
Ancestries in Hutto
1,061 7.6% English642 4.6% American602 4.3% European523 3.7% Irish475 3.4% German296 2.1% African266 1.9% Russian256 1.8% French230 1.6% Norwegian183 1.3% Italian180 1.3% Czech161 1.1% Scottish74 0.5% Dutch74 0.5% Iranian74 0.5% Northern European68 0.5% Guyanese67 0.5% Romanian47 0.3% Czechoslovakian45 0.3% Scandinavian37 0.3% Eastern European35 0.2% Jamaican34 0.2% Armenian32 0.2% French Canadian32 0.2% Welsh29 0.2% Swedish26 0.2% Scotch-Irish24 0.2% Swiss19 0.1% British13 0.09% Polish
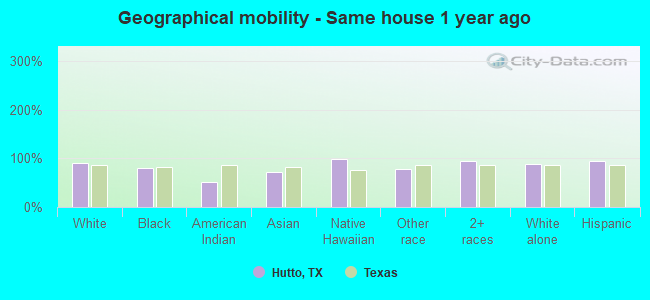
Geographical mobility in Hutto Same house 1 year ago 15,947 90.2% White (Caucasian)3,100 80.1% Black or African American27 51.3% American Indian / Alaska Native309 72.3% Asian110 98.2% Native Hawaiian / Pacific Islander2,291 77.2% Other race6,556 95.2% Two or more races12,384 87.5% White alone, not Hispanic / Latino10,500 93.7% Hispanic or LatinoMoved within same county 748 4.2% White / Caucasian457 11.8% Black or African American110 25.7% Asian100 3.4% Other race141 2.0% Two or more races834 5.9% White alone, not Hispanic / Latino70 0.6% Hispanic or LatinoMoved within same state 926 5.2% White / Caucasian15 0.4% Black or African American23 43.7% American Indian / Alaska Native390 13.2% Other race75 1.1% Two or more races862 6.1% White alone, not Hispanic / Latino579 5.2% Hispanic or LatinoMoved from different state 106 0.6% White / Caucasian112 2.9% Black or African American26 6.1% Asian58 0.8% Two or more races103 0.7% White alone, not Hispanic / LatinoMoved from abroad 122 3.2% Black or African American
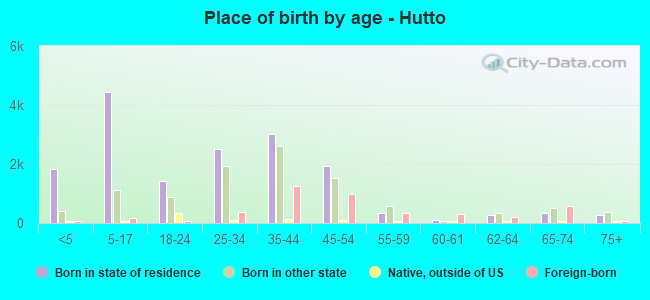
Children Nativity (place of birth) in Hutto
Children under 6 years - Living with two parents Both parents native 1,880 100.0% NativeBoth parents foreign-born 302 100.0% NativeOne native, one foreign-born parent 49 100.0% NativeChildren under 6 years - Living with one parent Native parent 409 100.0% NativeChildren 6 to 17 years - Living with two parents Both parents native 3,299 100.0% NativeBoth parents foreign-born 586 76.0% Native185 24.0% Foreign-bornOne native, one foreign-born parent 99 100.0% NativeChildren 6 to 17 years - Living with one parent Native parent 748 100.0% NativeForeign-born parent 212 48.1% Native228 51.9% Foreign-born
Grandparents responsible for own grandchildren in Hutto
Grandparents (30 to 59 years) White / Caucasian 15 100.0% Not responsible for grandchildrenOther race 36 100.0% Not responsible for grandchildrenTwo or more races 21 100.0% Not responsible for grandchildrenWhite alone, not Hispanic / Latino 24 100.0% Not responsible for grandchildrenHispanic or Latino 41 100.0% Not responsible for grandchildrenGrandparents (60 years and over) White / Caucasian 128 40.5% Responsible for grandchildren188 59.5% Not responsible for grandchildrenOther race 37 100.0% Responsible for grandchildrenTwo or more races 7 10.0% Responsible for grandchildren58 90.0% Not responsible for grandchildrenWhite alone, not Hispanic / Latino 4 6.4% Responsible for grandchildren58 93.6% Not responsible for grandchildrenHispanic or Latino 113 34.6% Responsible for grandchildren214 65.4% Not responsible for grandchildren