Races in Iowa City, Iowa (IA) Detailed Stats
Data:
Races - White alone (%)
Races - White alone (% change since 2000)
Races - Black alone (%)
Races - Black alone (% change since 2000)
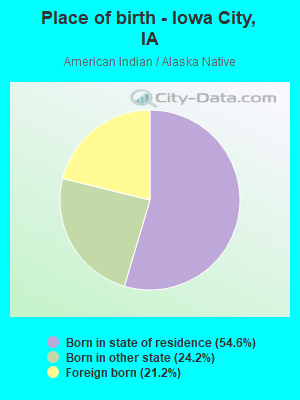
Races - American Indian alone (%)
Races - American Indian alone (% change since 2000)
Races - Asian alone (%)
Races - Asian alone (% change since 2000)
Races - Hispanic (%)
Races - Hispanic (% change since 2000)
Races - Native Hawaiian and Other Pacific Islander alone (%)
Races - Native Hawaiian and Other Pacific Islander alone (% change since 2000)
Races - Two or more races(%)
Races - Two or more races(% change since 2000)
Races - Other race alone (%)
Races - Other race alone (% change since 2000)
Racial diversity
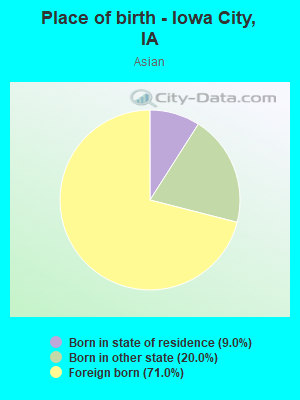
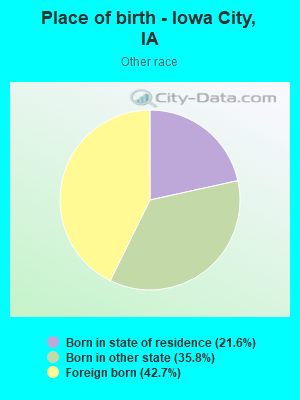
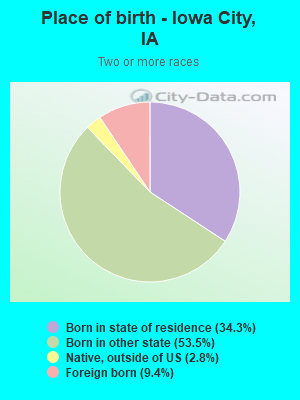
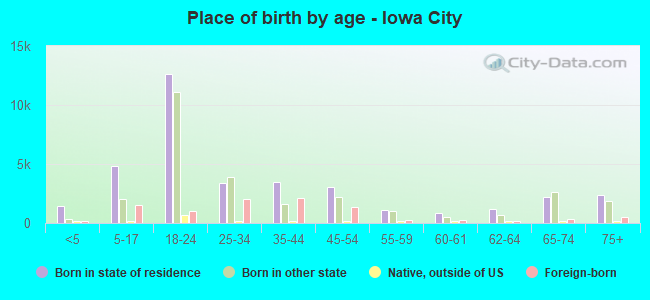
Place of birth - Born in state of residence (%)
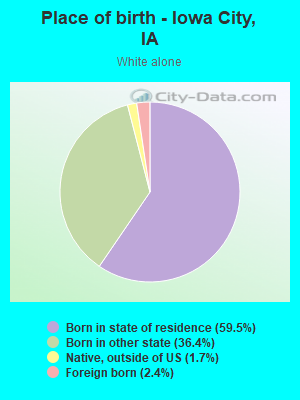
Place of birth - Born in state of residence (%) - White
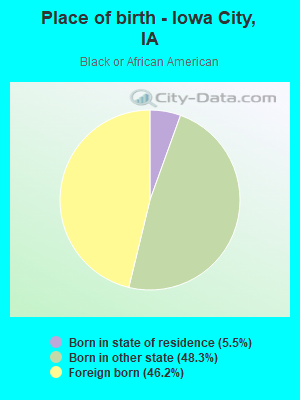
Place of birth - Born in state of residence (%) - Black or African American
Place of birth - Born in state of residence (%) - Asian
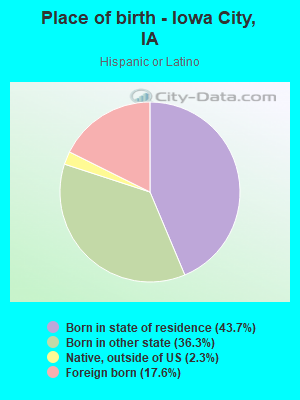
Place of birth - Born in state of residence (%) - Hispanic or Latino
Place of birth - Born in state of residence (%) - American Indian and Alaska Native
Place of birth - Born in state of residence (%) - Multirace
Place of birth - Born in state of residence (%) - Other Race
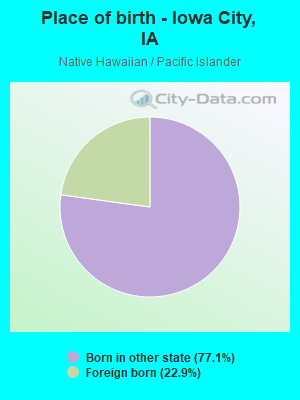
Place of birth - Born in other state (%)
Place of birth - Born in other state (%) - White
Place of birth - Born in other state (%) - Black or African American
Place of birth - Born in other state (%) - Asian
Place of birth - Born in other state (%) - Hispanic or Latino
Place of birth - Born in other state (%) - American Indian and Alaska Native
Place of birth - Born in other state (%) - Multirace
Place of birth - Born in other state (%) - Other Race
Place of birth - Native, outside of US (%)
Place of birth - Native, outside of US (%) - White
Place of birth - Native, outside of US (%) - Black or African American
Place of birth - Native, outside of US (%) - Asian
Place of birth - Native, outside of US (%) - Hispanic or Latino
Place of birth - Native, outside of US (%) - American Indian and Alaska Native
Place of birth - Native, outside of US (%) - Multirace
Place of birth - Native, outside of US (%) - Other Race
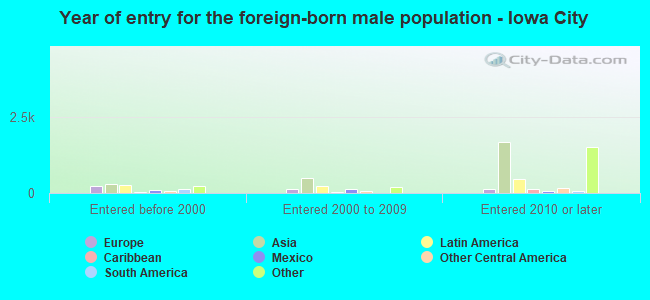
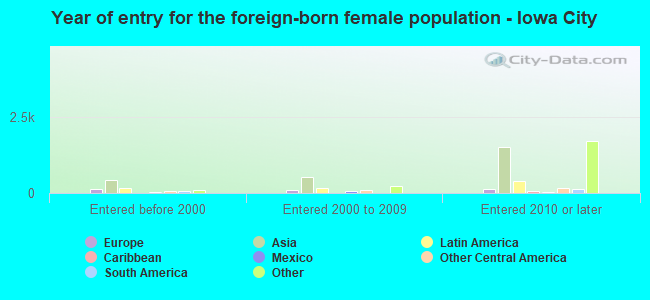
Place of birth - Foreign born (%)
Place of birth - Foreign born (%) - White
Place of birth - Foreign born (%) - Black or African American
Place of birth - Foreign born (%) - Asian
Place of birth - Foreign born (%) - Hispanic or Latino
Place of birth - Foreign born (%) - American Indian and Alaska Native
Place of birth - Foreign born (%) - Multirace
Place of birth - Foreign born (%) - Other Race
Residents speaking English at home (%)
Residents speaking English at home - Born in the United States (%)
Residents speaking English at home - Native, born elsewhere (%)
Residents speaking English at home - Foreign born (%)
Residents speaking Spanish at home (%)
Residents speaking Spanish at home - Born in the United States (%)
Residents speaking Spanish at home - Native, born elsewhere (%)
Residents speaking Spanish at home - Foreign born (%)
Residents speaking other language at home (%)
Residents speaking other language at home - Born in the United States (%)
Residents speaking other language at home - Native, born elsewhere (%)
Residents speaking other language at home - Foreign born (%)
Marital status - Never married (%)
Marital status - Now married (%)
Marital status - Separated (%)
Marital status - Widowed (%)
Marital status - Divorced (%)
Ancestries Reported - Arab (%)
Ancestries Reported - Czech (%)
Ancestries Reported - Danish (%)
Ancestries Reported - Dutch (%)
Ancestries Reported - English (%)
Ancestries Reported - French (%)
Ancestries Reported - French Canadian (%)
Ancestries Reported - German (%)
Ancestries Reported - Greek (%)
Ancestries Reported - Hungarian (%)
Ancestries Reported - Irish (%)
Ancestries Reported - Italian (%)
Ancestries Reported - Lithuanian (%)
Ancestries Reported - Norwegian (%)
Ancestries Reported - Polish (%)
Ancestries Reported - Portuguese (%)
Ancestries Reported - Russian (%)
Ancestries Reported - Scotch-Irish (%)
Ancestries Reported - Scottish (%)
Ancestries Reported - Slovak (%)
Ancestries Reported - Subsaharan African (%)
Ancestries Reported - Swedish (%)
Ancestries Reported - Swiss (%)
Ancestries Reported - Ukrainian (%)
Ancestries Reported - United States (%)
Ancestries Reported - Welsh (%)
Ancestries Reported - West Indian (%)
Ancestries Reported - Other (%)
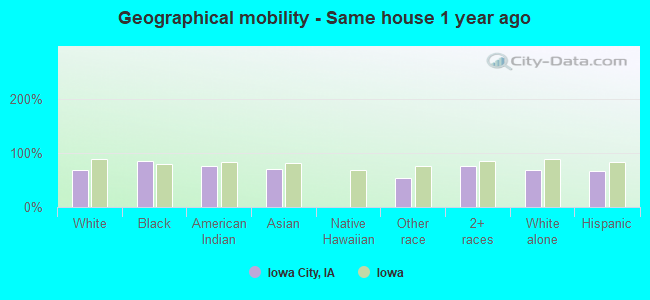
Geographical mobility - Same house 1 year ago (%)
Geographical mobility - Same house 1 year ago (%) - White
Geographical mobility - Same house 1 year ago (%) - Black or African American
Geographical mobility - Same house 1 year ago (%) - Asian
Geographical mobility - Same house 1 year ago (%) - Hispanic or Latino
Geographical mobility - Same house 1 year ago (%) - American Indian and Alaska Native
Geographical mobility - Same house 1 year ago (%) - Multirace
Geographical mobility - Same house 1 year ago (%) - Other Race
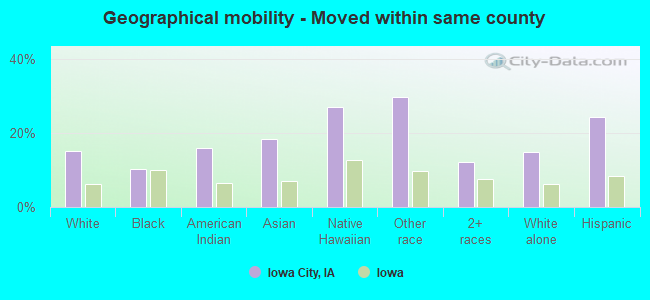
Geographical mobility - Moved within same county (%)
Geographical mobility - Moved within same county (%) - White
Geographical mobility - Moved within same county (%) - Black or African American
Geographical mobility - Moved within same county (%) - Asian
Geographical mobility - Moved within same county (%) - Hispanic or Latino
Geographical mobility - Moved within same county (%) - American Indian and Alaska Native
Geographical mobility - Moved within same county (%) - Multirace
Geographical mobility - Moved within same county (%) - Other Race
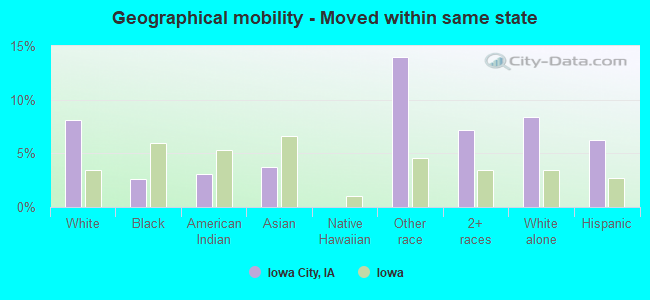
Geographical mobility - Moved from different county within same state (%)
Geographical mobility - Moved from different county within same state (%) - White
Geographical mobility - Moved from different county within same state (%) - Black or African American
Geographical mobility - Moved from different county within same state (%) - Asian
Geographical mobility - Moved from different county within same state (%) - Hispanic or Latino
Geographical mobility - Moved from different county within same state (%) - American Indian and Alaska Native
Geographical mobility - Moved from different county within same state (%) - Multirace
Geographical mobility - Moved from different county within same state (%) - Other Race
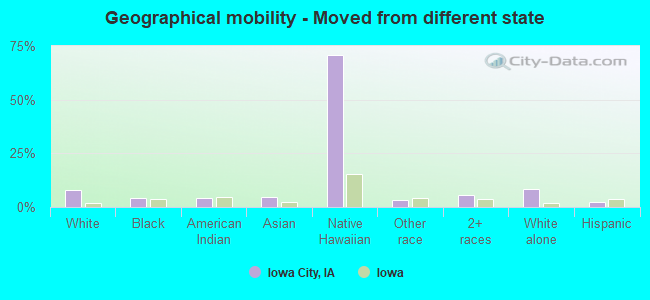
Geographical mobility - Moved from different state (%)
Geographical mobility - Moved from different state (%) - White
Geographical mobility - Moved from different state (%) - Black or African American
Geographical mobility - Moved from different state (%) - Asian
Geographical mobility - Moved from different state (%) - Hispanic or Latino
Geographical mobility - Moved from different state (%) - American Indian and Alaska Native
Geographical mobility - Moved from different state (%) - Multirace
Geographical mobility - Moved from different state (%) - Other Race
Geographical mobility - Moved from abroad (%)
Geographical mobility - Moved from abroad (%) - White
Geographical mobility - Moved from abroad (%) - Black or African American
Geographical mobility - Moved from abroad (%) - Asian
Geographical mobility - Moved from abroad (%) - Hispanic or Latino
Geographical mobility - Moved from abroad (%) - American Indian and Alaska Native
Geographical mobility - Moved from abroad (%) - Multirace
Geographical mobility - Moved from abroad (%) - Other Race
Place of birth for the foreign-born population - Ireland (%)
Place of birth for the foreign-born population - Denmark (%)
Place of birth for the foreign-born population - Norway (%)
Place of birth for the foreign-born population - Sweden (%)
Place of birth for the foreign-born population - United Kingdom (%)
Place of birth for the foreign-born population - England (%)
Place of birth for the foreign-born population - Scotland (%)
Place of birth for the foreign-born population - Other Northern Europe (%)
Place of birth for the foreign-born population - Austria (%)
Place of birth for the foreign-born population - Belgium (%)
Place of birth for the foreign-born population - France (%)
Place of birth for the foreign-born population - Germany (%)
Place of birth for the foreign-born population - Netherlands (%)
Place of birth for the foreign-born population - Switzerland (%)
Place of birth for the foreign-born population - Other Western Europe (%)
Place of birth for the foreign-born population - Greece (%)
Place of birth for the foreign-born population - Italy (%)
Place of birth for the foreign-born population - Portugal (%)
Place of birth for the foreign-born population - Spain (%)
Place of birth for the foreign-born population - Other Southern Europe (%)
Place of birth for the foreign-born population - Albania (%)
Place of birth for the foreign-born population - Belarus (%)
Place of birth for the foreign-born population - Bosnia and Herzegovina (%)
Place of birth for the foreign-born population - Bulgaria (%)
Place of birth for the foreign-born population - Croatia (%)
Place of birth for the foreign-born population - Czechoslovakia (%)
Place of birth for the foreign-born population - Hungary (%)
Place of birth for the foreign-born population - Latvia (%)
Place of birth for the foreign-born population - Lithuania (%)
Place of birth for the foreign-born population - North Macedonia (Macedonia) (%)
Place of birth for the foreign-born population - Moldova (%)
Place of birth for the foreign-born population - Poland (%)
Place of birth for the foreign-born population - Romania (%)
Place of birth for the foreign-born population - Russia (%)
Place of birth for the foreign-born population - Serbia (%)
Place of birth for the foreign-born population - Ukraine (%)
Place of birth for the foreign-born population - Other Eastern Europe (%)
Place of birth for the foreign-born population - China (%)
Place of birth for the foreign-born population - Hong Kong (%)
Place of birth for the foreign-born population - Taiwan (%)
Place of birth for the foreign-born population - Japan (%)
Place of birth for the foreign-born population - Korea (%)
Place of birth for the foreign-born population - Other Eastern Asia (%)
Place of birth for the foreign-born population - Afghanistan (%)
Place of birth for the foreign-born population - Bangladesh (%)
Place of birth for the foreign-born population - India (%)
Place of birth for the foreign-born population - Iran (%)
Place of birth for the foreign-born population - Kazakhstan (%)
Place of birth for the foreign-born population - Nepal (%)
Place of birth for the foreign-born population - Pakistan (%)
Place of birth for the foreign-born population - Sri Lanka (%)
Place of birth for the foreign-born population - Uzbekistan (%)
Place of birth for the foreign-born population - Other South Central Asia (%)
Place of birth for the foreign-born population - Burma (%)
Place of birth for the foreign-born population - Cambodia (%)
Place of birth for the foreign-born population - Indonesia (%)
Place of birth for the foreign-born population - Laos (%)
Place of birth for the foreign-born population - Malaysia (%)
Place of birth for the foreign-born population - Philippines (%)
Place of birth for the foreign-born population - Singapore (%)
Place of birth for the foreign-born population - Thailand (%)
Place of birth for the foreign-born population - Vietnam (%)
Place of birth for the foreign-born population - Other South Eastern Asia (%)
Place of birth for the foreign-born population - Armenia (%)
Place of birth for the foreign-born population - Iraq (%)
Place of birth for the foreign-born population - Israel (%)
Place of birth for the foreign-born population - Jordan (%)
Place of birth for the foreign-born population - Kuwait (%)
Place of birth for the foreign-born population - Lebanon (%)
Place of birth for the foreign-born population - Saudi Arabia (%)
Place of birth for the foreign-born population - Syria (%)
Place of birth for the foreign-born population - Turkey (%)
Place of birth for the foreign-born population - Yemen (%)
Place of birth for the foreign-born population - Other Western Asia (%)
Place of birth for the foreign-born population - Eritrea (%)
Place of birth for the foreign-born population - Ethiopia (%)
Place of birth for the foreign-born population - Kenya (%)
Place of birth for the foreign-born population - Somalia (%)
Place of birth for the foreign-born population - Uganda (%)
Place of birth for the foreign-born population - Zimbabwe (%)
Place of birth for the foreign-born population - Other Eastern Africa (%)
Place of birth for the foreign-born population - Cameroon (%)
Place of birth for the foreign-born population - Congo (%)
Place of birth for the foreign-born population - Democratic Republic of Congo (Zaire) (%)
Place of birth for the foreign-born population - Other Middle Africa (%)
Place of birth for the foreign-born population - Egypt (%)
Place of birth for the foreign-born population - Morocco (%)
Place of birth for the foreign-born population - Sudan (%)
Place of birth for the foreign-born population - Other Northern Africa (%)
Place of birth for the foreign-born population - South Africa (%)
Place of birth for the foreign-born population - Other Southern Africa (%)
Place of birth for the foreign-born population - Cabo Verde (%)
Place of birth for the foreign-born population - Ghana (%)
Place of birth for the foreign-born population - Liberia (%)
Place of birth for the foreign-born population - Nigeria (%)
Place of birth for the foreign-born population - Senegal (%)
Place of birth for the foreign-born population - Sierra Leone (%)
Place of birth for the foreign-born population - Other Western Africa (%)
Place of birth for the foreign-born population - Australia (%)
Place of birth for the foreign-born population - New Zealand (%)
Place of birth for the foreign-born population - Fiji (%)
Place of birth for the foreign-born population - Micronesia (%)
Place of birth for the foreign-born population - Bahamas (%)
Place of birth for the foreign-born population - Barbados (%)
Place of birth for the foreign-born population - Cuba (%)
Place of birth for the foreign-born population - Dominica (%)
Place of birth for the foreign-born population - Dominican Republic (%)
Place of birth for the foreign-born population - Grenada (%)
Place of birth for the foreign-born population - Haiti (%)
Place of birth for the foreign-born population - Jamaica (%)
Place of birth for the foreign-born population - St. Vincent and the Grenadines (%)
Place of birth for the foreign-born population - Trinidad and Tobago (%)
Place of birth for the foreign-born population - West Indies (%)
Place of birth for the foreign-born population - Other Caribbean (%)
Place of birth for the foreign-born population - Belize (%)
Place of birth for the foreign-born population - Costa Rica (%)
Place of birth for the foreign-born population - El Salvador (%)
Place of birth for the foreign-born population - Guatemala (%)
Place of birth for the foreign-born population - Honduras (%)
Place of birth for the foreign-born population - Mexico (%)
Place of birth for the foreign-born population - Nicaragua (%)
Place of birth for the foreign-born population - Panama (%)
Place of birth for the foreign-born population - Other Central America (%)
Place of birth for the foreign-born population - Argentina (%)
Place of birth for the foreign-born population - Bolivia (%)
Place of birth for the foreign-born population - Brazil (%)
Place of birth for the foreign-born population - Chile (%)
Place of birth for the foreign-born population - Colombia (%)
Place of birth for the foreign-born population - Ecuador (%)
Place of birth for the foreign-born population - Guyana (%)
Place of birth for the foreign-born population - Peru (%)
Place of birth for the foreign-born population - Uruguay (%)
Place of birth for the foreign-born population - Venezuela (%)
Place of birth for the foreign-born population - Other South America (%)
Place of birth for the foreign-born population - Canada (%)
Place of birth for the foreign-born population - Other Northern America (%)
Place of birth for the foreign-born population - Other (%)
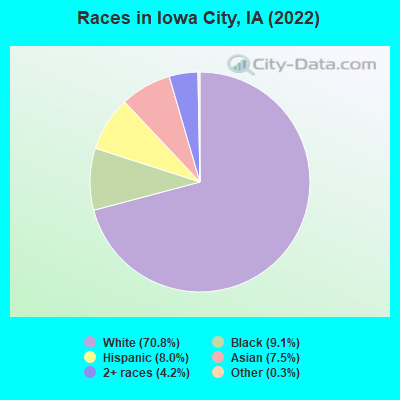
According to 2022 data, the most numerous races in Iowa City, IA are White alone (53,275 residents), Hispanic (5,998 residents), and Black alone (6,837 residents). 80.2% of Iowa City residents speak English at home. 13.7% of Iowa City, IA residents are foreign-born (6.5% born in Asia, 3.8% born in Africa, 2.0% born in Latin America), which is 63.6% greater than the foreign-born rate of 5.0% across the entire state of Iowa.
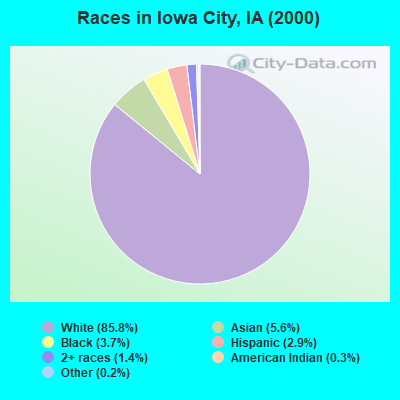
Race distribution in Iowa City
2000 2022
2,710,344 92.6% White alone 82,473 2.8% Hispanic 60,744 2.1% Black alone 36,345 1.2% Asian alone 25,472 0.9% Two or more races 7,955 0.3% American Indian alone 2,103 0.07% Other race alone 888 0.03% Native Hawaiian and Other
2,650,110 82.8% White alone 218,024 6.8% Hispanic 119,004 3.7% Black alone 115,286 3.6% Two or more races 74,892 2.3% Asian alone 9,260 0.3% Other race alone 8,595 0.3% Native Hawaiian and Other 5,346 0.2% American Indian alone
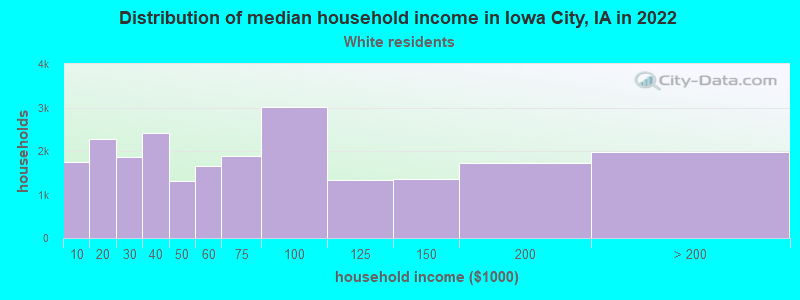
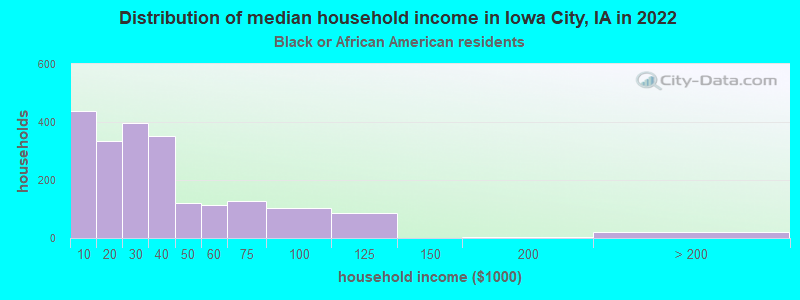
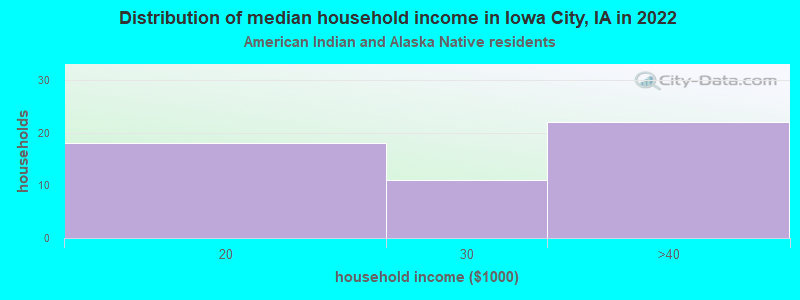
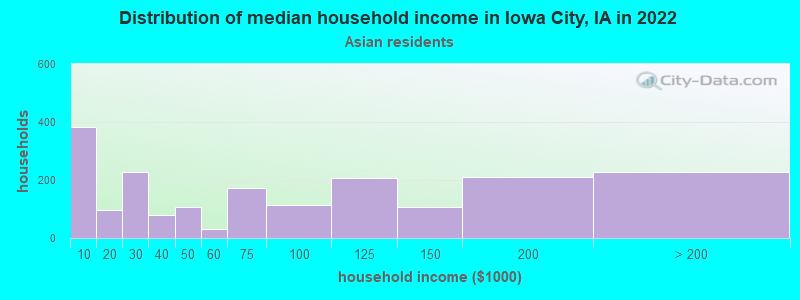
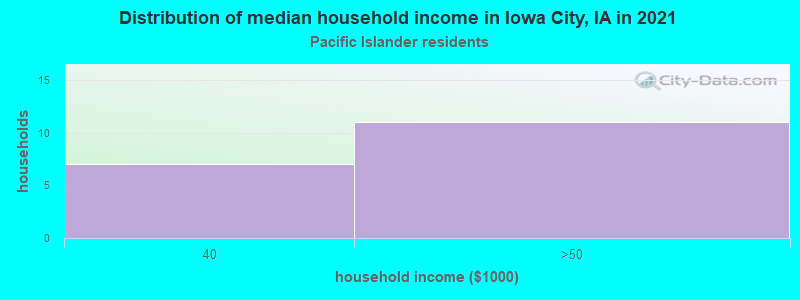
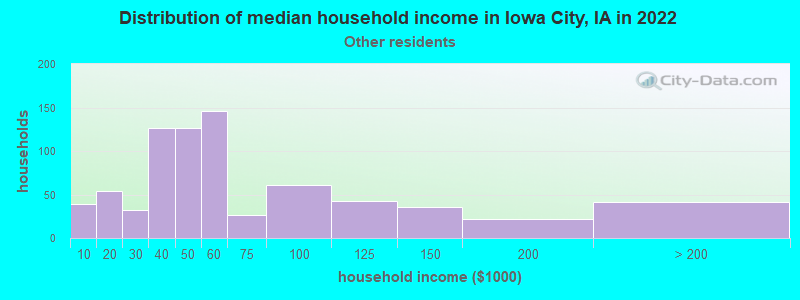
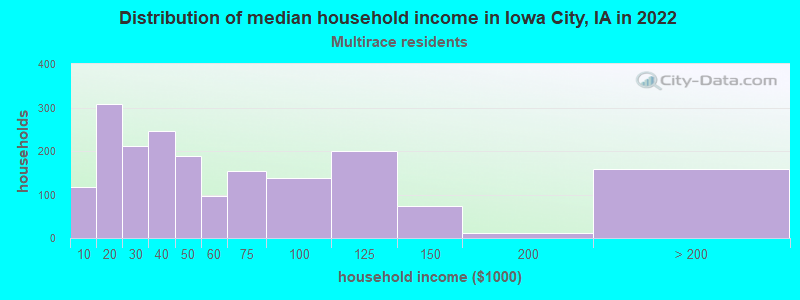
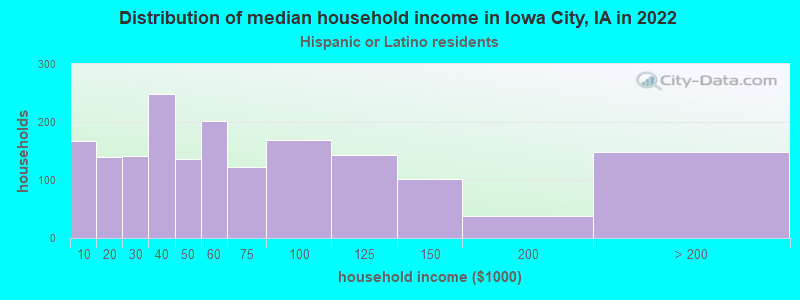
Income and house value in Iowa City Median household income in 2022 $59,937 White non-Hispanic householders$24,399 Black householders$40,292 Asian householders$79,906 Some other race householders$50,260 Two or more races householders$48,655 Hispanic or Latino race householdersMedian 2022 house value $284,115 White Non-Hispanic householders$273,739 Black or African American householders$248,352 American Indian or Alaska Native householders $290,075 Asian householders$213,252 Some other race householders$283,894 Two or more races householders$235,327 Hispanic or Latino householders
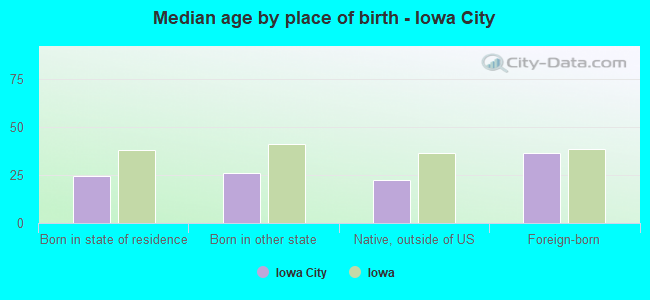
Median age by race in Iowa City
26.4 Median age for White residents27.2 25.2 22.8 Median age for Black or African American residents21.3 25.7 -666,666,666.0 Median age for American Indian / Alaska Native residents-666,666,666.0 -666,666,666.0 29.2 Median age for Asian residents27.3 30.2 -666,666,666.0 Median age for Native Hawaiian / Pacific Islander residents-666,666,666.0 -666,666,666.0 32.9 Median age for Other race residents32.7 36.2 24.7 Median age for Two or more races residents34.9 20.9 26.4 Median age for White alone residents27.2 25.2 28.5 Median age for Hispanic or Latino residents28.1 28.6
Owner/renter occupied households by race in Iowa City
House owners and renters - White residents 12,171 54.0% Owner occupied10,376 46.0% Renter occupiedHouse owners and renters - Black or African American residents 232 11.1% Owner occupied1,860 88.9% Renter occupiedHouse owners and renters - American Indian / Alaska Native residents 66 100.0% Renter occupiedHouse owners and renters - Asian residents 864 39.9% Owner occupied1,301 60.1% Renter occupiedHouse owners and renters - Native Hawaiian / Pacific Islander residents 14 100.0% Renter occupiedHouse owners and renters - Other race residents 367 55.0% Owner occupied300 45.0% Renter occupiedHouse owners and renters - Two or more races residents 687 30.0% Owner occupied1,605 70.0% Renter occupiedHouse owners and renters - White alone residents 11,933 53.8% Owner occupied10,228 46.2% Renter occupiedHouse owners and renters - Hispanic or Latino residents 701 35.0% Owner occupied1,299 65.0% Renter occupied
Language usage in Iowa City
English speakers - Total 80.2% of residents of Iowa City speak English at home.
4.4% of residents speak Spanish at home 2,464 75.6% Speak English very well796 24.4% Speak English less than very well15.4% of residents speak other language at home 8,239 73.1% Speak English very well3,036 26.9% Speak English less than very well
English speakers - Born in the United States 86.1% of residents of Iowa City speak English at home.
4.5% of residents speak Spanish at home 1,238 99.5% Speak English very well6 0.5% Speak English less than very well9.4% of residents speak other language at home 2,015 77.7% Speak English very well579 22.3% Speak English less than very well
English speakers - Native, born elsewhere 58.0% of residents of Iowa City speak English at home.
13.7% of residents speak Spanish at home 140 100.0% Speak English less than very well28.3% of residents speak other language at home 289 100.0% Speak English very well
English speakers - Foreign-born 14.1% of residents of Iowa City speak English at home.
7.7% of residents speak Spanish at home 496 67.2% Speak English very well242 32.8% Speak English less than very well78.2% of residents speak other language at home 5,048 67.5% Speak English very well2,430 32.5% Speak English less than very well
White (Caucasian) - Speak only English Native:
93.8% (50,362)Foreign-born:
30.3% (413)
White (Caucasian) - Speak another language Native:
6.2% (3,342)Foreign-born:
69.7% (951)
Black or African American - Speak another language Native:
31.6% (1,085)Foreign-born:
100.0% (3,159)
American Indian / Alaska Native - Speak another language Native:
13.7% (23)Foreign-born:
93.5% (44)
Asian - Speak only English Native:
40.6% (560)Foreign-born:
13.7% (546)
Asian - Speak another language Native:
59.4% (819)Foreign-born:
86.3% (3,427)
Native Hawaiian / Pacific Islander - Speak only English Native:
100.0% (15)Foreign-born:
18.1% (4)
Other race - Speak only English Native:
55.6% (448)Foreign-born:
12.5% (183)
Other race - Speak another language Native:
45.2% (364)Foreign-born:
82.7% (1,204)
Two or more races - Speak only English Native:
88.6% (3,448)Foreign-born:
32.8% (164)
Two or more races - Speak another language Native:
9.8% (381)Foreign-born:
55.0% (275)
White alone - Speak only English Native:
96.0% (48,794)Foreign-born:
32.8% (413)
White alone - Speak another language Native:
4.0% (2,043)Foreign-born:
67.2% (845)
Hispanic or Latino - Speak only English Native:
54.5% (2,694)Foreign-born:
30.2% (320)
Hispanic or Latino - Speak another language Native:
45.5% (2,246)Foreign-born:
69.8% (738)
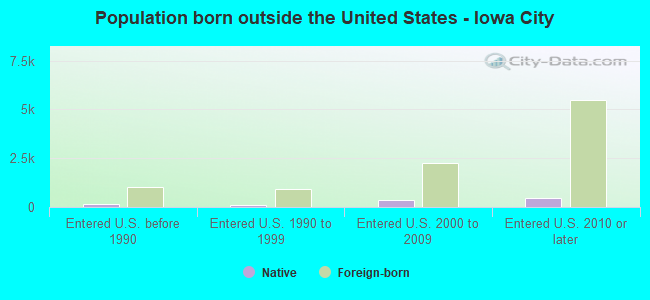
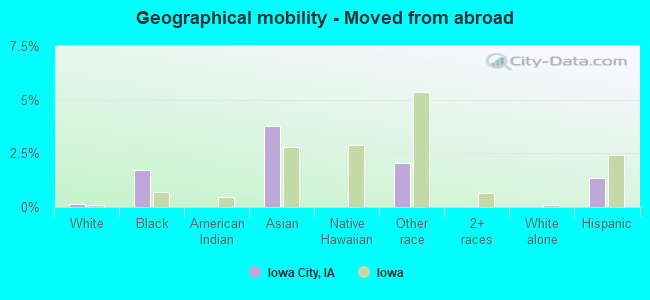
Foreign-born residents in Iowa City 10,490 residents are foreign born (6.5% Asia , 3.8% Africa , 2.0% Latin America ).
Marital status for residents in Iowa City Marital status - White (Caucasian) population 15 years and over
Males 58.6% Never married30.4% Now married0.5% Separated2.4% Widowed8.1% DivorcedFemales 57.5% Never married25.5% Now married0.7% Separated9.1% Widowed7.3% DivorcedWomen who gave birth in the past 12 months Now married:
78.0% (308)Unmarried:
22.0% (87)
Women who did not give birth in the past 12 months Now married:
15.0% (2,699)Unmarried:
85.0% (15,300)
Marital status - Black or African American population 15 years and over
Males 60.9% Never married35.1% Now married0.0% Separated1.1% Widowed3.0% DivorcedFemales 61.4% Never married23.6% Now married0.6% Separated4.5% Widowed9.9% DivorcedWomen who gave birth in the past 12 months Now married:
78.4% (28)Unmarried:
21.6% (8)
Women who did not give birth in the past 12 months Now married:
24.9% (474)Unmarried:
75.1% (1,431)
Marital status - American Indian / Alaska Native population 15 years and over
Males 83.7% Never married0.0% Now married0.0% Separated16.3% Widowed0.0% DivorcedFemales 0.0% Never married23.6% Now married37.5% Separated0.0% Widowed38.9% DivorcedWomen who did not give birth in the past 12 months Now married:
0.0% (0)Unmarried:
100.0% (19)
Marital status - Asian population 15 years and over
Males 65.0% Never married34.5% Now married0.0% Separated0.0% Widowed0.5% DivorcedFemales 57.2% Never married39.1% Now married0.0% Separated1.3% Widowed2.4% DivorcedWomen who gave birth in the past 12 months Now married:
100.0% (70)Unmarried:
0.0% (0)
Women who did not give birth in the past 12 months Now married:
30.3% (710)Unmarried:
69.7% (1,634)
Marital status - Native Hawaiian / Pacific Islander population 15 years and over
Males 33.3% Never married0.0% Now married0.0% Separated0.0% Widowed66.7% DivorcedFemales 100.0% Never married0.0% Now married0.0% Separated0.0% Widowed0.0% DivorcedWomen who did not give birth in the past 12 months Now married:
0.0% (0)Unmarried:
100.0% (9)
Marital status - Other race population 15 years and over
Males 67.2% Never married31.2% Now married0.0% Separated0.0% Widowed1.6% DivorcedFemales 52.6% Never married43.0% Now married0.0% Separated0.0% Widowed4.4% DivorcedWomen who gave birth in the past 12 months Now married:
8.6% (6)Unmarried:
91.4% (69)
Women who did not give birth in the past 12 months Now married:
36.8% (199)Unmarried:
63.2% (342)
Marital status - Two or more races population 15 years and over
Males 56.8% Never married34.8% Now married0.0% Separated0.0% Widowed8.4% DivorcedFemales 59.0% Never married30.1% Now married1.2% Separated0.0% Widowed9.7% DivorcedWomen who gave birth in the past 12 months Now married:
100.0% (61)Unmarried:
0.0% (0)
Women who did not give birth in the past 12 months Now married:
23.7% (419)Unmarried:
76.3% (1,351)
Marital status - White alone, not Hispanic / Latino population 15 years and over
Males 58.2% Never married30.3% Now married0.6% Separated2.5% Widowed8.4% DivorcedFemales 56.0% Never married25.8% Now married0.7% Separated9.7% Widowed7.8% DivorcedWomen who gave birth in the past 12 months Now married:
78.0% (308)Unmarried:
22.0% (87)
Women who did not give birth in the past 12 months Now married:
14.4% (2,336)Unmarried:
85.6% (13,938)
Marital status - Hispanic or Latino population 15 years and over
Males 55.9% Never married40.6% Now married0.0% Separated0.0% Widowed3.4% DivorcedFemales 57.2% Never married33.8% Now married1.4% Separated0.7% Widowed6.9% DivorcedWomen who gave birth in the past 12 months Now married:
8.6% (6)Unmarried:
91.4% (59)
Women who did not give birth in the past 12 months Now married:
30.2% (550)Unmarried:
69.8% (1,273)
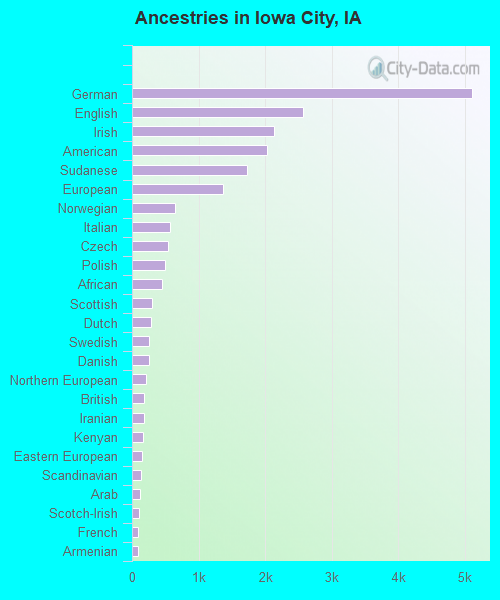
Ancestries in Iowa City
5,107 14.6% German2,568 7.4% English2,127 6.1% Irish2,033 5.8% American1,728 4.9% Sudanese1,367 3.9% European653 1.9% Norwegian577 1.7% Italian535 1.5% Czech501 1.4% Polish446 1.3% African302 0.9% Scottish289 0.8% Dutch255 0.7% Swedish253 0.7% Danish207 0.6% Northern European182 0.5% British179 0.5% Iranian166 0.5% Kenyan146 0.4% Eastern European133 0.4% Scandinavian117 0.3% Arab100 0.3% Scotch-Irish96 0.3% French86 0.2% Armenian84 0.2% Turkish79 0.2% Russian74 0.2% Yugoslavian70 0.2% Moroccan66 0.2% Lebanese65 0.2% Swiss62 0.2% Canadian61 0.2% French Canadian59 0.2% Nigerian53 0.2% Iraqi48 0.1% Greek39 0.1% Jamaican39 0.1% Syrian37 0.1% Lithuanian37 0.1% Palestinian36 0.1% Austrian34 0.10% Celtic33 0.09% Welsh32 0.09% Czechoslovakian31 0.09% Brazilian29 0.08% Croatian24 0.07% Hungarian22 0.06% Jordanian21 0.06% Ukrainian18 0.05% Serbian18 0.05% Belgian15 0.04% Portuguese14 0.04% Assyrian13 0.04% Slovak13 0.04% Finnish13 0.04% Ghanaian11 0.03% Egyptian10 0.03% Israeli10 0.03% Australian10 0.03% Romanian9 0.03% Luxembourger8 0.02% Albanian6 0.02% Slavic6 0.02% South African2 0.01% Pennsylvania German
Geographical mobility in Iowa City Same house 1 year ago 38,241 68.5% White (Caucasian)5,171 84.8% Black or African American163 75.4% American Indian / Alaska Native3,998 69.7% Asian1,189 52.9% Other race3,675 75.0% Two or more races36,142 68.4% White alone, not Hispanic / Latino3,936 65.6% Hispanic or LatinoMoved within same county 8,519 15.3% White / Caucasian631 10.4% Black or African American34 15.9% American Indian / Alaska Native1,049 18.3% Asian8 27.0% Native Hawaiian / Pacific Islander669 29.8% Other race593 12.1% Two or more races7,921 15.0% White alone, not Hispanic / Latino1,454 24.2% Hispanic or LatinoMoved within same state 4,547 8.1% White / Caucasian160 2.6% Black or African American7 3.1% American Indian / Alaska Native213 3.7% Asian315 14.0% Other race350 7.1% Two or more races4,447 8.4% White alone, not Hispanic / Latino377 6.3% Hispanic or LatinoMoved from different state 4,437 7.9% White / Caucasian265 4.3% Black or African American10 4.4% American Indian / Alaska Native261 4.5% Asian21 70.9% Native Hawaiian / Pacific Islander70 3.1% Other race279 5.7% Two or more races4,343 8.2% White alone, not Hispanic / Latino149 2.5% Hispanic or LatinoMoved from abroad 82 0.1% White106 1.7% Black or African American216 3.8% Asian46 2.0% Other race82 1.4% Hispanic or Latino
Children Nativity (place of birth) in Iowa City
Children under 6 years - Living with two parents Both parents native 1,710 99.8% Native4 0.2% Foreign-bornBoth parents foreign-born 658 82.0% Native144 18.0% Foreign-bornOne native, one foreign-born parent 237 100.0% NativeChildren under 6 years - Living with one parent Native parent 343 100.0% NativeForeign-born parent 297 74.9% Native100 25.1% Foreign-bornChildren 6 to 17 years - Living with two parents Both parents native 3,287 100.0% NativeBoth parents foreign-born 962 65.0% Native517 35.0% Foreign-bornOne native, one foreign-born parent 423 98.1% Native8 1.9% Foreign-bornChildren 6 to 17 years - Living with one parent Native parent 1,188 100.0% NativeForeign-born parent 344 58.4% Native245 41.6% Foreign-born
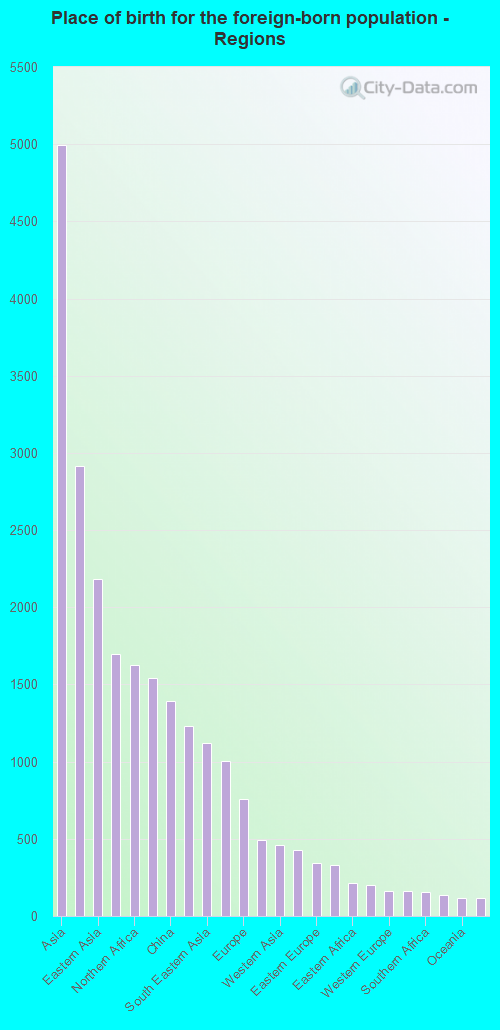
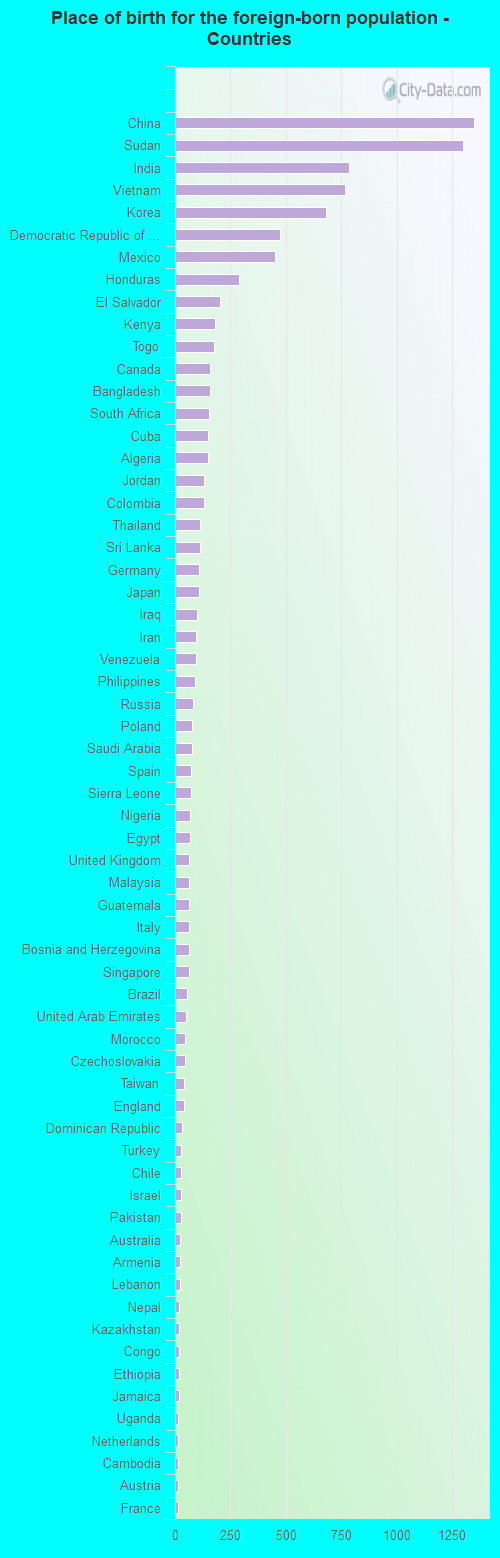
Place of birth for residents in Iowa City 4,994 Asia2,918 Africa2,181 Eastern Asia1,699 Americas1,626 Northern Africa1,539 Latin America1,394 China1,228 South Central Asia1,121 South Eastern Asia1,006 Central America759 Europe492 Middle Africa462 Western Asia429 Western Africa346 Eastern Europe328 South America216 Eastern Africa203 Caribbean161 Western Europe160 Northern America154 Southern Africa134 Southern Europe118 Oceania117 Northern Europe24 Australia and New Zealand Subregion1,350 China1,300 Sudan787 India769 Vietnam680 Korea474 Democratic Republic of Congo (Zaire)452 Mexico287 Honduras201 El Salvador182 Kenya174 Togo160 Canada160 Bangladesh154 South Africa151 Cuba149 Algeria133 Jordan131 Colombia113 Thailand112 Sri Lanka110 Germany107 Japan101 Iraq96 Iran94 Venezuela90 Philippines83 Russia78 Poland76 Saudi Arabia72 Spain70 Sierra Leone68 Nigeria66 Egypt65 United Kingdom64 Malaysia64 Guatemala62 Italy61 Bosnia and Herzegovina61 Singapore53 Brazil49 United Arab Emirates47 Morocco44 Czechoslovakia40 Taiwan40 England32 Dominican Republic29 Turkey27 Chile26 Israel25 Pakistan24 Australia22 Armenia21 Lebanon19 Nepal18 Kazakhstan18 Congo18 Ethiopia17 Jamaica15 Uganda15 Netherlands14 Cambodia14 Austria13 France11 Denmark11 North Macedonia (Macedonia)11 Argentina10 Guyana9 Marshall Islands9 Indonesia8 Ukraine8 Switzerland3 Hong Kong2 Ghana2 St. Lucia
Grandparents responsible for own grandchildren in Iowa City
Grandparents (30 to 59 years) White / Caucasian 4 21.9% Responsible for grandchildren15 78.1% Not responsible for grandchildrenBlack or African American 12 100.0% Not responsible for grandchildrenAsian 11 15.3% Responsible for grandchildren62 84.7% Not responsible for grandchildrenWhite alone, not Hispanic / Latino 4 50.8% Responsible for grandchildren4 49.2% Not responsible for grandchildrenHispanic or Latino 7 100.0% Not responsible for grandchildrenGrandparents (60 years and over) White / Caucasian 11 35.1% Responsible for grandchildren21 64.9% Not responsible for grandchildrenBlack or African American 30 83.8% Responsible for grandchildren6 16.2% Not responsible for grandchildrenAsian 16 20.7% Responsible for grandchildren60 79.3% Not responsible for grandchildrenWhite alone, not Hispanic / Latino 11 34.2% Responsible for grandchildren22 65.8% Not responsible for grandchildren