Races in Irondequoit, New York (NY) Detailed Stats
Data:
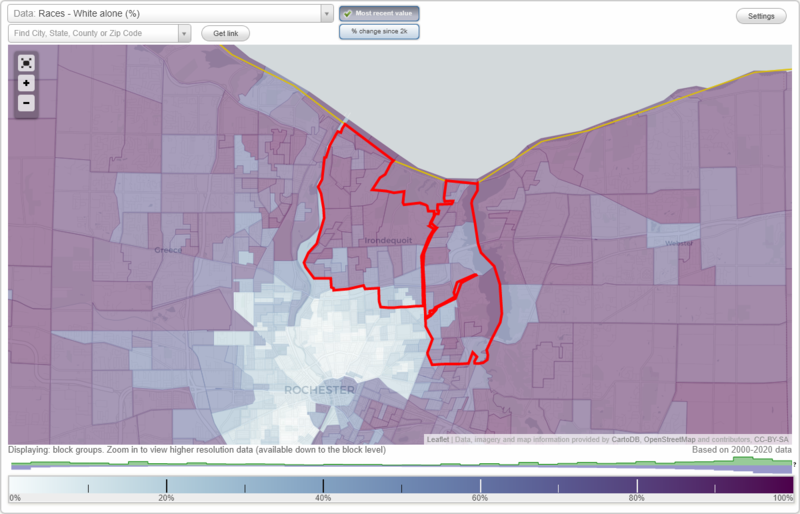
Races - White alone (%)
Races - White alone (% change since 2000)
Races - Black alone (%)
Races - Black alone (% change since 2000)
Races - American Indian alone (%)
Races - American Indian alone (% change since 2000)
Races - Asian alone (%)
Races - Asian alone (% change since 2000)
Races - Hispanic (%)
Races - Hispanic (% change since 2000)
Races - Native Hawaiian and Other Pacific Islander alone (%)
Races - Native Hawaiian and Other Pacific Islander alone (% change since 2000)
Races - Two or more races(%)
Races - Two or more races(% change since 2000)
Races - Other race alone (%)
Races - Other race alone (% change since 2000)
Racial diversity
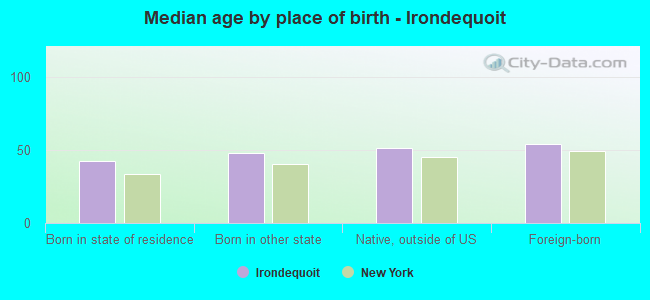
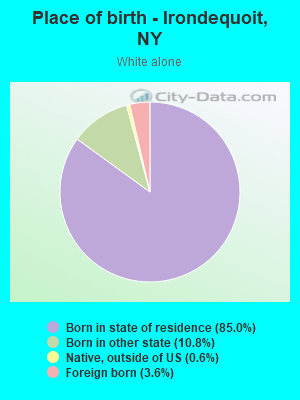
Place of birth - Born in state of residence (%)
Place of birth - Born in state of residence (%) - White
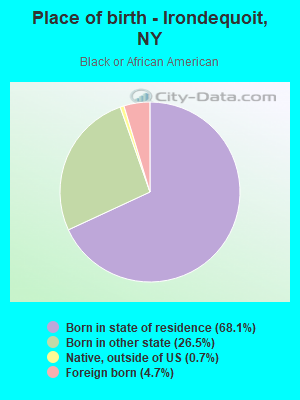
Place of birth - Born in state of residence (%) - Black or African American
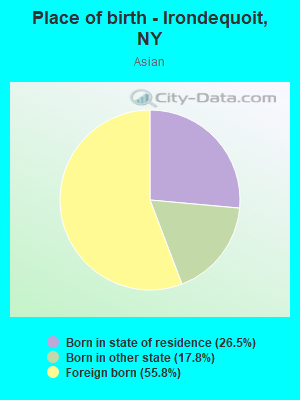
Place of birth - Born in state of residence (%) - Asian
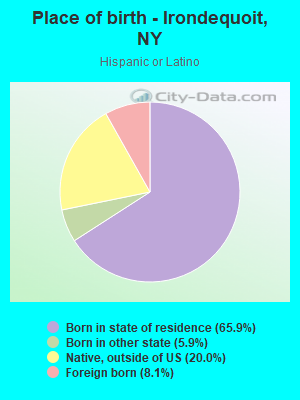
Place of birth - Born in state of residence (%) - Hispanic or Latino
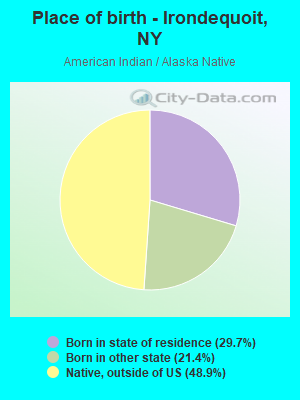
Place of birth - Born in state of residence (%) - American Indian and Alaska Native
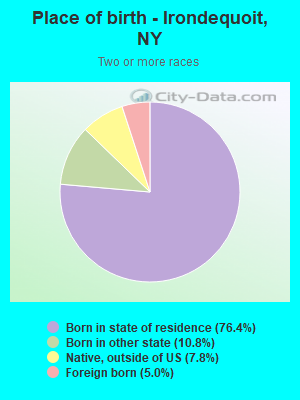
Place of birth - Born in state of residence (%) - Multirace
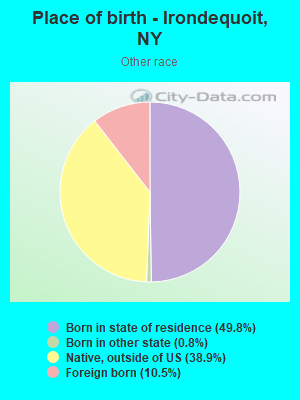
Place of birth - Born in state of residence (%) - Other Race
Place of birth - Born in other state (%)
Place of birth - Born in other state (%) - White
Place of birth - Born in other state (%) - Black or African American
Place of birth - Born in other state (%) - Asian
Place of birth - Born in other state (%) - Hispanic or Latino
Place of birth - Born in other state (%) - American Indian and Alaska Native
Place of birth - Born in other state (%) - Multirace
Place of birth - Born in other state (%) - Other Race
Place of birth - Native, outside of US (%)
Place of birth - Native, outside of US (%) - White
Place of birth - Native, outside of US (%) - Black or African American
Place of birth - Native, outside of US (%) - Asian
Place of birth - Native, outside of US (%) - Hispanic or Latino
Place of birth - Native, outside of US (%) - American Indian and Alaska Native
Place of birth - Native, outside of US (%) - Multirace
Place of birth - Native, outside of US (%) - Other Race
Place of birth - Foreign born (%)
Place of birth - Foreign born (%) - White
Place of birth - Foreign born (%) - Black or African American
Place of birth - Foreign born (%) - Asian
Place of birth - Foreign born (%) - Hispanic or Latino
Place of birth - Foreign born (%) - American Indian and Alaska Native
Place of birth - Foreign born (%) - Multirace
Place of birth - Foreign born (%) - Other Race
Residents speaking English at home (%)
Residents speaking English at home - Born in the United States (%)
Residents speaking English at home - Native, born elsewhere (%)
Residents speaking English at home - Foreign born (%)
Residents speaking Spanish at home (%)
Residents speaking Spanish at home - Born in the United States (%)
Residents speaking Spanish at home - Native, born elsewhere (%)
Residents speaking Spanish at home - Foreign born (%)
Residents speaking other language at home (%)
Residents speaking other language at home - Born in the United States (%)
Residents speaking other language at home - Native, born elsewhere (%)
Residents speaking other language at home - Foreign born (%)
Marital status - Never married (%)
Marital status - Now married (%)
Marital status - Separated (%)
Marital status - Widowed (%)
Marital status - Divorced (%)
Ancestries Reported - Arab (%)
Ancestries Reported - Czech (%)
Ancestries Reported - Danish (%)
Ancestries Reported - Dutch (%)
Ancestries Reported - English (%)
Ancestries Reported - French (%)
Ancestries Reported - French Canadian (%)
Ancestries Reported - German (%)
Ancestries Reported - Greek (%)
Ancestries Reported - Hungarian (%)
Ancestries Reported - Irish (%)
Ancestries Reported - Italian (%)
Ancestries Reported - Lithuanian (%)
Ancestries Reported - Norwegian (%)
Ancestries Reported - Polish (%)
Ancestries Reported - Portuguese (%)
Ancestries Reported - Russian (%)
Ancestries Reported - Scotch-Irish (%)
Ancestries Reported - Scottish (%)
Ancestries Reported - Slovak (%)
Ancestries Reported - Subsaharan African (%)
Ancestries Reported - Swedish (%)
Ancestries Reported - Swiss (%)
Ancestries Reported - Ukrainian (%)
Ancestries Reported - United States (%)
Ancestries Reported - Welsh (%)
Ancestries Reported - West Indian (%)
Ancestries Reported - Other (%)
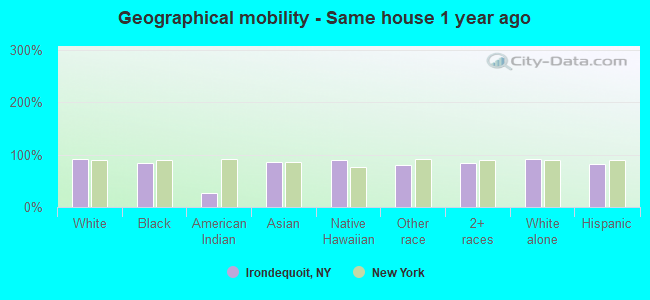
Geographical mobility - Same house 1 year ago (%)
Geographical mobility - Same house 1 year ago (%) - White
Geographical mobility - Same house 1 year ago (%) - Black or African American
Geographical mobility - Same house 1 year ago (%) - Asian
Geographical mobility - Same house 1 year ago (%) - Hispanic or Latino
Geographical mobility - Same house 1 year ago (%) - American Indian and Alaska Native
Geographical mobility - Same house 1 year ago (%) - Multirace
Geographical mobility - Same house 1 year ago (%) - Other Race
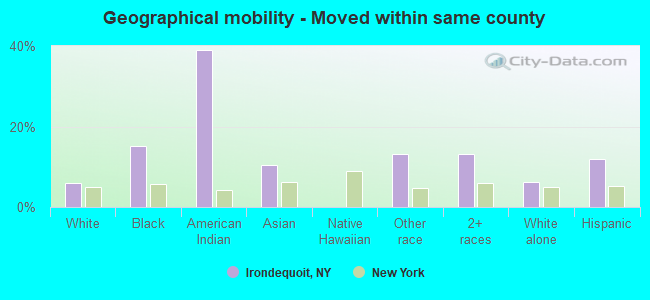
Geographical mobility - Moved within same county (%)
Geographical mobility - Moved within same county (%) - White
Geographical mobility - Moved within same county (%) - Black or African American
Geographical mobility - Moved within same county (%) - Asian
Geographical mobility - Moved within same county (%) - Hispanic or Latino
Geographical mobility - Moved within same county (%) - American Indian and Alaska Native
Geographical mobility - Moved within same county (%) - Multirace
Geographical mobility - Moved within same county (%) - Other Race
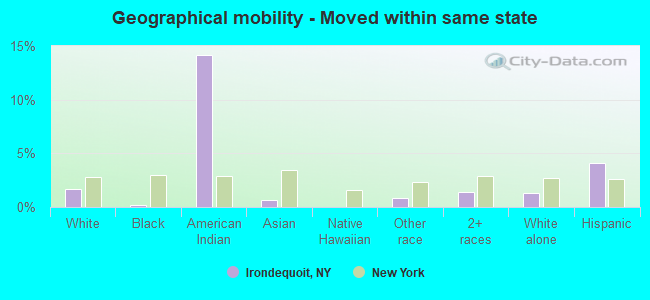
Geographical mobility - Moved from different county within same state (%)
Geographical mobility - Moved from different county within same state (%) - White
Geographical mobility - Moved from different county within same state (%) - Black or African American
Geographical mobility - Moved from different county within same state (%) - Asian
Geographical mobility - Moved from different county within same state (%) - Hispanic or Latino
Geographical mobility - Moved from different county within same state (%) - American Indian and Alaska Native
Geographical mobility - Moved from different county within same state (%) - Multirace
Geographical mobility - Moved from different county within same state (%) - Other Race
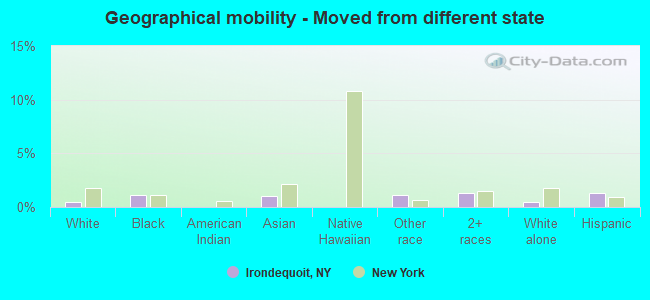
Geographical mobility - Moved from different state (%)
Geographical mobility - Moved from different state (%) - White
Geographical mobility - Moved from different state (%) - Black or African American
Geographical mobility - Moved from different state (%) - Asian
Geographical mobility - Moved from different state (%) - Hispanic or Latino
Geographical mobility - Moved from different state (%) - American Indian and Alaska Native
Geographical mobility - Moved from different state (%) - Multirace
Geographical mobility - Moved from different state (%) - Other Race
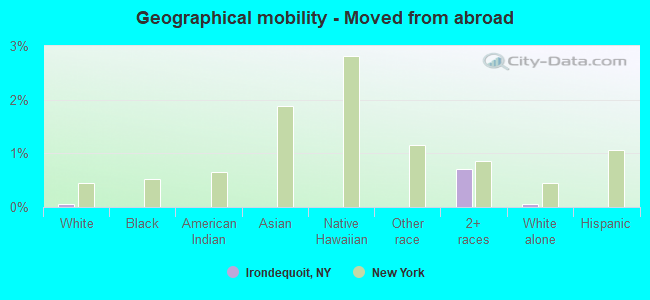
Geographical mobility - Moved from abroad (%)
Geographical mobility - Moved from abroad (%) - White
Geographical mobility - Moved from abroad (%) - Black or African American
Geographical mobility - Moved from abroad (%) - Asian
Geographical mobility - Moved from abroad (%) - Hispanic or Latino
Geographical mobility - Moved from abroad (%) - American Indian and Alaska Native
Geographical mobility - Moved from abroad (%) - Multirace
Geographical mobility - Moved from abroad (%) - Other Race
Place of birth for the foreign-born population - Ireland (%)
Place of birth for the foreign-born population - Denmark (%)
Place of birth for the foreign-born population - Norway (%)
Place of birth for the foreign-born population - Sweden (%)
Place of birth for the foreign-born population - United Kingdom (%)
Place of birth for the foreign-born population - England (%)
Place of birth for the foreign-born population - Scotland (%)
Place of birth for the foreign-born population - Other Northern Europe (%)
Place of birth for the foreign-born population - Austria (%)
Place of birth for the foreign-born population - Belgium (%)
Place of birth for the foreign-born population - France (%)
Place of birth for the foreign-born population - Germany (%)
Place of birth for the foreign-born population - Netherlands (%)
Place of birth for the foreign-born population - Switzerland (%)
Place of birth for the foreign-born population - Other Western Europe (%)
Place of birth for the foreign-born population - Greece (%)
Place of birth for the foreign-born population - Italy (%)
Place of birth for the foreign-born population - Portugal (%)
Place of birth for the foreign-born population - Spain (%)
Place of birth for the foreign-born population - Other Southern Europe (%)
Place of birth for the foreign-born population - Albania (%)
Place of birth for the foreign-born population - Belarus (%)
Place of birth for the foreign-born population - Bosnia and Herzegovina (%)
Place of birth for the foreign-born population - Bulgaria (%)
Place of birth for the foreign-born population - Croatia (%)
Place of birth for the foreign-born population - Czechoslovakia (%)
Place of birth for the foreign-born population - Hungary (%)
Place of birth for the foreign-born population - Latvia (%)
Place of birth for the foreign-born population - Lithuania (%)
Place of birth for the foreign-born population - North Macedonia (Macedonia) (%)
Place of birth for the foreign-born population - Moldova (%)
Place of birth for the foreign-born population - Poland (%)
Place of birth for the foreign-born population - Romania (%)
Place of birth for the foreign-born population - Russia (%)
Place of birth for the foreign-born population - Serbia (%)
Place of birth for the foreign-born population - Ukraine (%)
Place of birth for the foreign-born population - Other Eastern Europe (%)
Place of birth for the foreign-born population - China (%)
Place of birth for the foreign-born population - Hong Kong (%)
Place of birth for the foreign-born population - Taiwan (%)
Place of birth for the foreign-born population - Japan (%)
Place of birth for the foreign-born population - Korea (%)
Place of birth for the foreign-born population - Other Eastern Asia (%)
Place of birth for the foreign-born population - Afghanistan (%)
Place of birth for the foreign-born population - Bangladesh (%)
Place of birth for the foreign-born population - India (%)
Place of birth for the foreign-born population - Iran (%)
Place of birth for the foreign-born population - Kazakhstan (%)
Place of birth for the foreign-born population - Nepal (%)
Place of birth for the foreign-born population - Pakistan (%)
Place of birth for the foreign-born population - Sri Lanka (%)
Place of birth for the foreign-born population - Uzbekistan (%)
Place of birth for the foreign-born population - Other South Central Asia (%)
Place of birth for the foreign-born population - Burma (%)
Place of birth for the foreign-born population - Cambodia (%)
Place of birth for the foreign-born population - Indonesia (%)
Place of birth for the foreign-born population - Laos (%)
Place of birth for the foreign-born population - Malaysia (%)
Place of birth for the foreign-born population - Philippines (%)
Place of birth for the foreign-born population - Singapore (%)
Place of birth for the foreign-born population - Thailand (%)
Place of birth for the foreign-born population - Vietnam (%)
Place of birth for the foreign-born population - Other South Eastern Asia (%)
Place of birth for the foreign-born population - Armenia (%)
Place of birth for the foreign-born population - Iraq (%)
Place of birth for the foreign-born population - Israel (%)
Place of birth for the foreign-born population - Jordan (%)
Place of birth for the foreign-born population - Kuwait (%)
Place of birth for the foreign-born population - Lebanon (%)
Place of birth for the foreign-born population - Saudi Arabia (%)
Place of birth for the foreign-born population - Syria (%)
Place of birth for the foreign-born population - Turkey (%)
Place of birth for the foreign-born population - Yemen (%)
Place of birth for the foreign-born population - Other Western Asia (%)
Place of birth for the foreign-born population - Eritrea (%)
Place of birth for the foreign-born population - Ethiopia (%)
Place of birth for the foreign-born population - Kenya (%)
Place of birth for the foreign-born population - Somalia (%)
Place of birth for the foreign-born population - Uganda (%)
Place of birth for the foreign-born population - Zimbabwe (%)
Place of birth for the foreign-born population - Other Eastern Africa (%)
Place of birth for the foreign-born population - Cameroon (%)
Place of birth for the foreign-born population - Congo (%)
Place of birth for the foreign-born population - Democratic Republic of Congo (Zaire) (%)
Place of birth for the foreign-born population - Other Middle Africa (%)
Place of birth for the foreign-born population - Egypt (%)
Place of birth for the foreign-born population - Morocco (%)
Place of birth for the foreign-born population - Sudan (%)
Place of birth for the foreign-born population - Other Northern Africa (%)
Place of birth for the foreign-born population - South Africa (%)
Place of birth for the foreign-born population - Other Southern Africa (%)
Place of birth for the foreign-born population - Cabo Verde (%)
Place of birth for the foreign-born population - Ghana (%)
Place of birth for the foreign-born population - Liberia (%)
Place of birth for the foreign-born population - Nigeria (%)
Place of birth for the foreign-born population - Senegal (%)
Place of birth for the foreign-born population - Sierra Leone (%)
Place of birth for the foreign-born population - Other Western Africa (%)
Place of birth for the foreign-born population - Australia (%)
Place of birth for the foreign-born population - New Zealand (%)
Place of birth for the foreign-born population - Fiji (%)
Place of birth for the foreign-born population - Micronesia (%)
Place of birth for the foreign-born population - Bahamas (%)
Place of birth for the foreign-born population - Barbados (%)
Place of birth for the foreign-born population - Cuba (%)
Place of birth for the foreign-born population - Dominica (%)
Place of birth for the foreign-born population - Dominican Republic (%)
Place of birth for the foreign-born population - Grenada (%)
Place of birth for the foreign-born population - Haiti (%)
Place of birth for the foreign-born population - Jamaica (%)
Place of birth for the foreign-born population - St. Vincent and the Grenadines (%)
Place of birth for the foreign-born population - Trinidad and Tobago (%)
Place of birth for the foreign-born population - West Indies (%)
Place of birth for the foreign-born population - Other Caribbean (%)
Place of birth for the foreign-born population - Belize (%)
Place of birth for the foreign-born population - Costa Rica (%)
Place of birth for the foreign-born population - El Salvador (%)
Place of birth for the foreign-born population - Guatemala (%)
Place of birth for the foreign-born population - Honduras (%)
Place of birth for the foreign-born population - Mexico (%)
Place of birth for the foreign-born population - Nicaragua (%)
Place of birth for the foreign-born population - Panama (%)
Place of birth for the foreign-born population - Other Central America (%)
Place of birth for the foreign-born population - Argentina (%)
Place of birth for the foreign-born population - Bolivia (%)
Place of birth for the foreign-born population - Brazil (%)
Place of birth for the foreign-born population - Chile (%)
Place of birth for the foreign-born population - Colombia (%)
Place of birth for the foreign-born population - Ecuador (%)
Place of birth for the foreign-born population - Guyana (%)
Place of birth for the foreign-born population - Peru (%)
Place of birth for the foreign-born population - Uruguay (%)
Place of birth for the foreign-born population - Venezuela (%)
Place of birth for the foreign-born population - Other South America (%)
Place of birth for the foreign-born population - Canada (%)
Place of birth for the foreign-born population - Other Northern America (%)
Place of birth for the foreign-born population - Other (%)
Latest news about races in Irondequoit, NY collected exclusively by city-data.com from local newspapers, TV, and radio stations
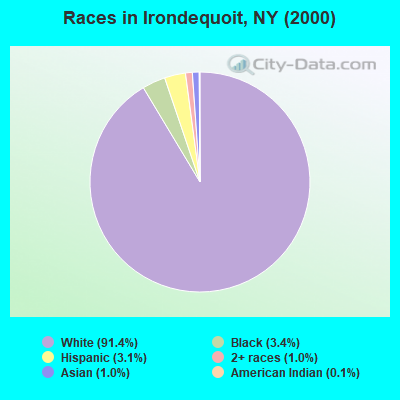
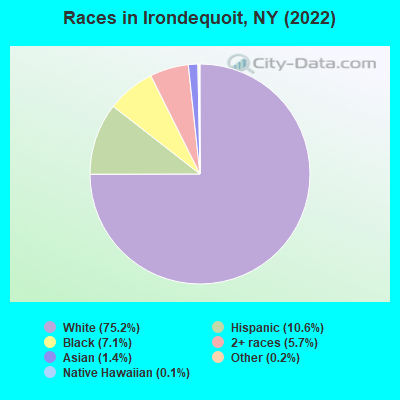
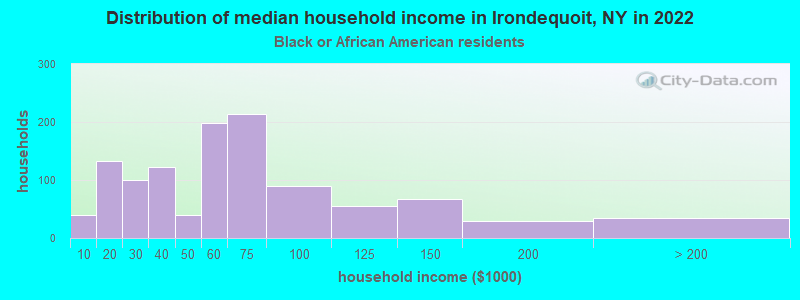
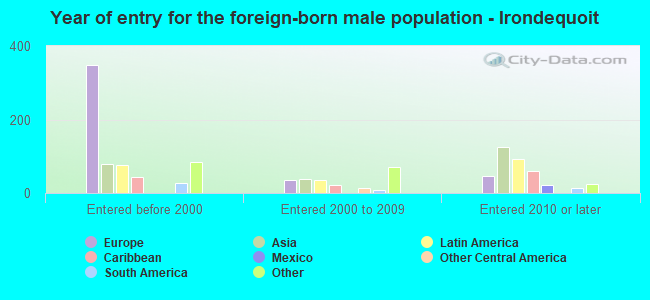
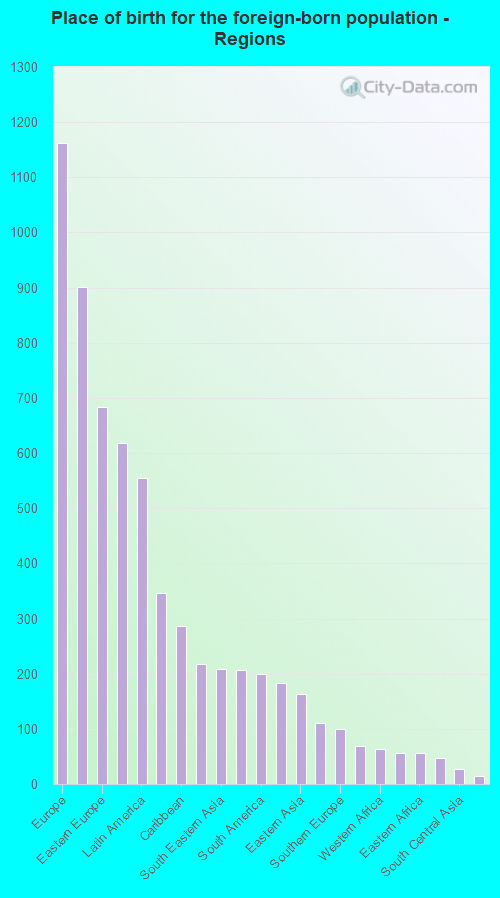
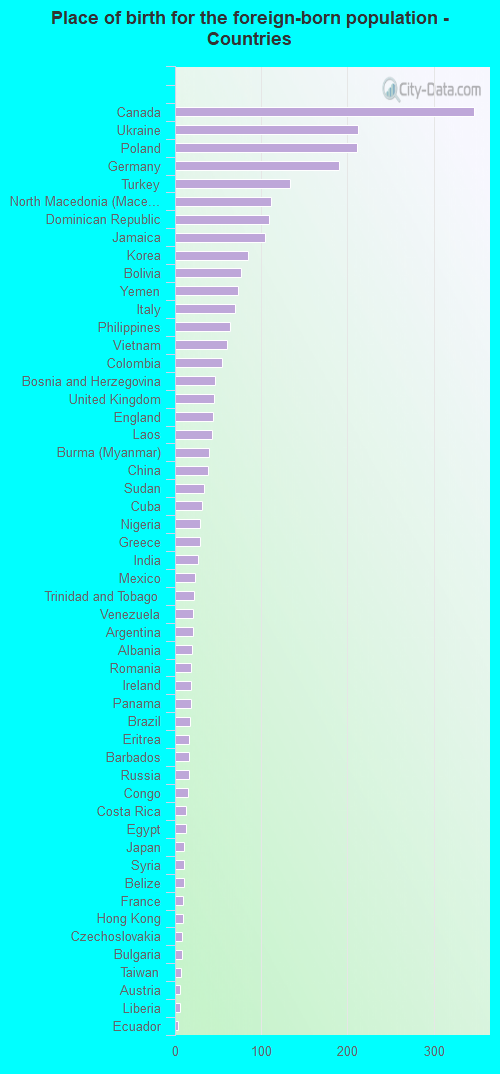
According to 2022 data, the most numerous races in Irondequoit, NY are White alone (37,989 residents), Hispanic (5,354 residents), and Black alone (3,564 residents). 89.4% of Irondequoit residents speak English at home. 5.7% of Irondequoit, NY residents are foreign-born (2.3% born in Europe, 1.2% born in Asia, 1.1% born in Latin America, 0.7% born in North America), which is 287.1% less than the foreign-born rate of 22.0% across the entire state of New York.
Race distribution in Irondequoit
2000 2022
11,760,981 62.0% White alone 2,867,583 15.1% Hispanic 2,812,623 14.8% Black alone 1,035,926 5.5% Asian alone 366,116 1.9% Two or more races 75,499 0.4% Other race alone 52,499 0.3% American Indian alone 5,230 0.03% Native Hawaiian and Other
10,408,933 52.9% White alone 3,867,299 19.7% Hispanic 2,633,840 13.4% Black alone 1,776,286 9.0% Asian alone 732,670 3.7% Two or more races 216,110 1.1% Other race alone 35,082 0.2% American Indian alone 6,931 0.04% Native Hawaiian and Other
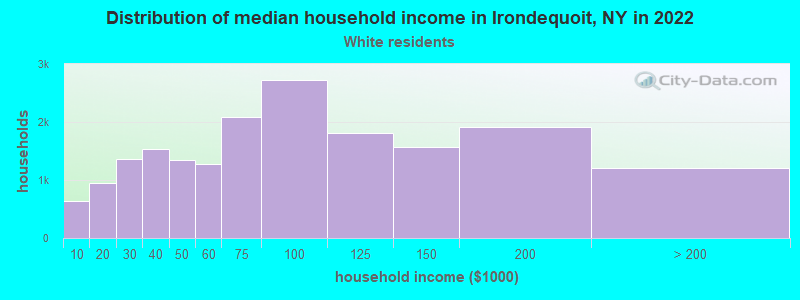
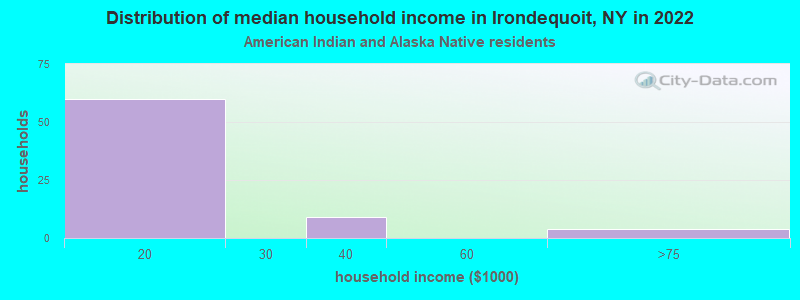
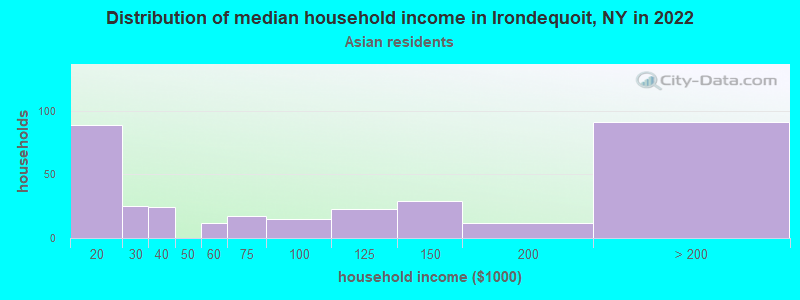
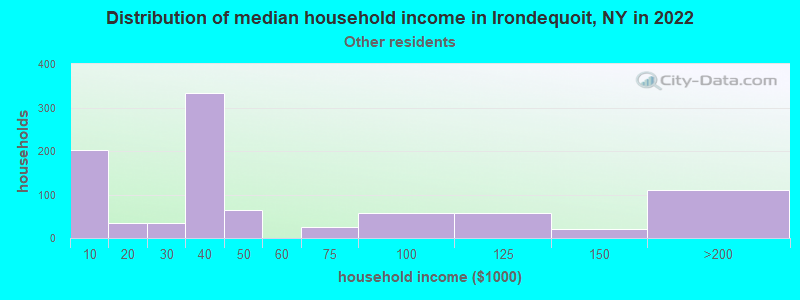
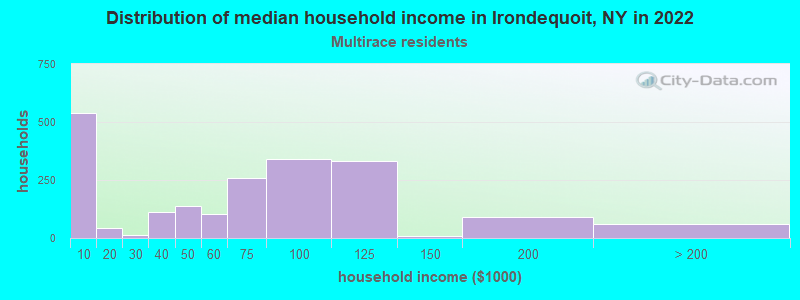
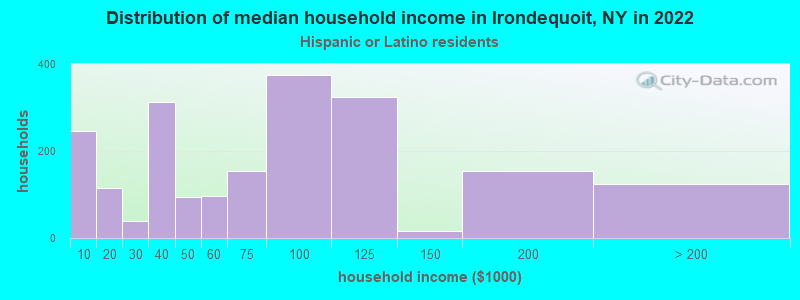
Income and house value in Irondequoit Median household income in 2022 $73,265 White non-Hispanic householders$46,690 Black householders$11,946 American Indian and Alaska Native householders$36,997 Some other race householders$61,648 Two or more races householders$68,398 Hispanic or Latino race householdersMedian 2022 house value $169,789 White Non-Hispanic householders$169,598 Black or African American householders$65,465 American Indian or Alaska Native householders $192,377 Asian householders$166,535 Some other race householders$148,733 Two or more races householders$167,683 Hispanic or Latino householders
Median age by race in Irondequoit
49.7 Median age for White residents46.6 52.4 28.7 Median age for Black or African American residents26.8 31.5 90.4 Median age for American Indian / Alaska Native residents42.9 -1,201,671,890.1 33.8 Median age for Asian residents40.8 30.0 -487,992,314.6 Median age for Native Hawaiian / Pacific Islander residents-477,502,295.2 -497,387,669.3 43.3 Median age for Other race residents39.8 46.9 28.0 Median age for Two or more races residents27.4 34.9 50.0 Median age for White alone residents47.3 52.3 33.6 Median age for Hispanic or Latino residents31.3 33.8
Owner/renter occupied households by race in Irondequoit
House owners and renters - White residents 15,634 84.5% Owner occupied2,873 15.5% Renter occupiedHouse owners and renters - Black or African American residents 774 60.1% Owner occupied514 39.9% Renter occupiedHouse owners and renters - American Indian / Alaska Native residents 14 15.3% Owner occupied78 84.7% Renter occupiedHouse owners and renters - Asian residents 203 64.4% Owner occupied112 35.6% Renter occupiedHouse owners and renters - Native Hawaiian / Pacific Islander residents 48 100.0% Renter occupiedHouse owners and renters - Other race residents 493 46.1% Owner occupied576 53.9% Renter occupiedHouse owners and renters - Two or more races residents 947 51.2% Owner occupied904 48.8% Renter occupiedHouse owners and renters - White alone residents 15,511 85.0% Owner occupied2,735 15.0% Renter occupiedHouse owners and renters - Hispanic or Latino residents 1,007 49.2% Owner occupied1,039 50.8% Renter occupied
Language usage in Irondequoit
English speakers - Total 89.4% of residents of Irondequoit speak English at home.
5.4% of residents speak Spanish at home 1,745 67.2% Speak English very well852 32.8% Speak English less than very well5.3% of residents speak other language at home 1,494 59.1% Speak English very well1,035 40.9% Speak English less than very well
English speakers - Born in the United States 97.1% of residents of Irondequoit speak English at home.
1.3% of residents speak Spanish at home 69 89.6% Speak English very well8 10.4% Speak English less than very well1.7% of residents speak other language at home 91 92.9% Speak English very well7 7.1% Speak English less than very well
English speakers - Native, born elsewhere 27.9% of residents of Irondequoit speak English at home.
64.3% of residents speak Spanish at home 410 46.6% Speak English very well470 53.4% Speak English less than very well6.9% of residents speak other language at home 61 64.9% Speak English very well33 35.1% Speak English less than very well
English speakers - Foreign-born 38.8% of residents of Irondequoit speak English at home.
10.2% of residents speak Spanish at home 155 58.3% Speak English very well111 41.7% Speak English less than very well51.9% of residents speak other language at home 551 40.7% Speak English very well802 59.3% Speak English less than very well
White (Caucasian) - Speak only English Native:
96.8% (34,756)Foreign-born:
53.7% (733)
White (Caucasian) - Speak another language Native:
3.1% (1,118)Foreign-born:
47.3% (646)
Black or African American - Speak only English Native:
97.0% (3,155)Foreign-born:
47.6% (87)
Black or African American - Speak another language Native:
3.0% (98)Foreign-born:
52.7% (96)
Asian - Speak only English Native:
88.6% (372)Foreign-born:
35.1% (194)
Asian - Speak another language Native:
18.3% (77)Foreign-born:
60.6% (334)
Other race - Speak only English Native:
42.6% (742)Foreign-born:
5.3% (11)
Other race - Speak another language Native:
58.5% (1,017)Foreign-born:
97.4% (203)
Two or more races - Speak only English Native:
69.0% (3,026)Foreign-born:
19.0% (51)
Two or more races - Speak another language Native:
30.3% (1,331)Foreign-born:
80.5% (215)
White alone - Speak only English Native:
96.8% (34,224)Foreign-born:
47.0% (648)
White alone - Speak another language Native:
3.2% (1,123)Foreign-born:
50.8% (700)
Hispanic or Latino - Speak only English Native:
56.6% (2,633)Foreign-born:
42.9% (190)
Hispanic or Latino - Speak another language Native:
44.9% (2,088)Foreign-born:
57.9% (256)
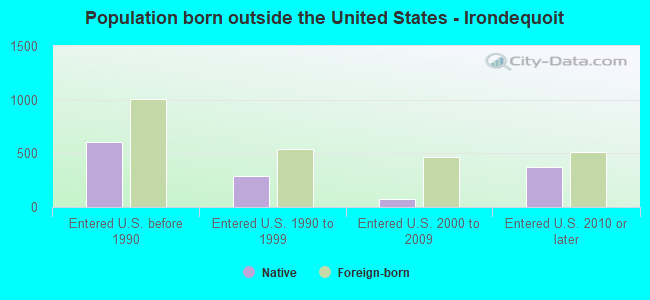
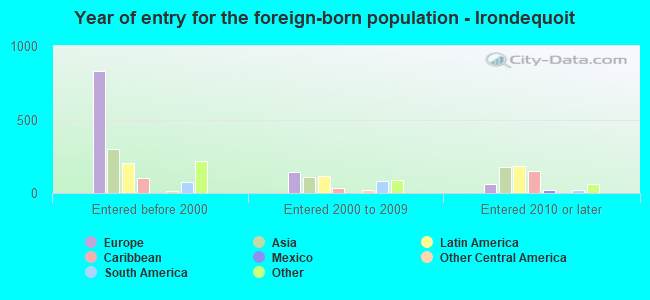
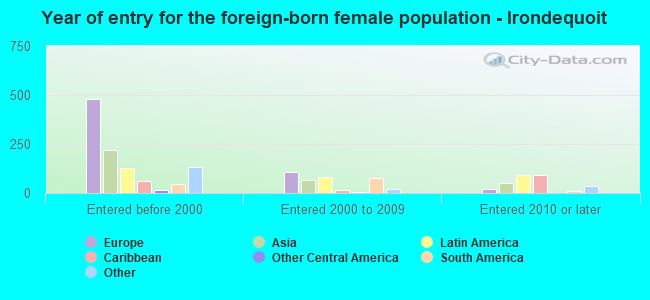
Foreign-born residents in Irondequoit 2,869 residents are foreign born (2.3% Europe , 1.2% Asia , 1.1% Latin America , 0.7% North America ).
This city:
5.7%New York:
22.6%
Marital status for residents in Irondequoit Marital status - White (Caucasian) population 15 years and over
Males 28.3% Never married57.2% Now married1.0% Separated3.2% Widowed10.3% DivorcedFemales 26.5% Never married49.2% Now married1.3% Separated10.7% Widowed12.2% DivorcedWomen who gave birth in the past 12 months Now married:
77.6% (186)Unmarried:
22.4% (54)
Women who did not give birth in the past 12 months Now married:
47.6% (3,465)Unmarried:
52.4% (3,820)
Marital status - Black or African American population 15 years and over
Males 55.4% Never married33.4% Now married0.1% Separated1.5% Widowed9.6% DivorcedFemales 48.5% Never married24.3% Now married0.9% Separated7.7% Widowed18.7% DivorcedWomen who gave birth in the past 12 months Now married:
0.0% (0)Unmarried:
100.0% (25)
Women who did not give birth in the past 12 months Now married:
28.5% (237)Unmarried:
71.5% (595)
Marital status - American Indian / Alaska Native population 15 years and over
Males 61.8% Never married8.8% Now married0.0% Separated29.4% Widowed0.0% DivorcedFemales 89.2% Never married10.8% Now married0.0% Separated0.0% Widowed0.0% DivorcedMarital status - Asian population 15 years and over
Males 25.1% Never married74.9% Now married0.0% Separated0.0% Widowed0.0% DivorcedFemales 34.8% Never married61.1% Now married0.0% Separated4.1% Widowed0.0% DivorcedWomen who gave birth in the past 12 months Now married:
100.0% (11)Unmarried:
0.0% (0)
Women who did not give birth in the past 12 months Now married:
53.6% (199)Unmarried:
46.4% (172)
Marital status - Other race population 15 years and over
Males 42.0% Never married45.5% Now married6.5% Separated0.0% Widowed6.0% DivorcedFemales 44.5% Never married14.0% Now married2.8% Separated14.1% Widowed24.7% DivorcedWomen who gave birth in the past 12 months Now married:
100.0% (9)Unmarried:
0.0% (0)
Women who did not give birth in the past 12 months Now married:
2.9% (18)Unmarried:
97.1% (629)
Marital status - Two or more races population 15 years and over
Males 63.3% Never married23.6% Now married4.5% Separated0.0% Widowed8.6% DivorcedFemales 41.2% Never married27.9% Now married5.8% Separated2.8% Widowed22.4% DivorcedWomen who gave birth in the past 12 months Now married:
62.2% (36)Unmarried:
37.8% (22)
Women who did not give birth in the past 12 months Now married:
27.7% (368)Unmarried:
72.3% (962)
Marital status - White alone, not Hispanic / Latino population 15 years and over
Males 28.4% Never married57.0% Now married1.1% Separated3.3% Widowed10.2% DivorcedFemales 26.0% Never married49.1% Now married1.4% Separated11.0% Widowed12.5% DivorcedWomen who gave birth in the past 12 months Now married:
86.3% (194)Unmarried:
13.7% (31)
Women who did not give birth in the past 12 months Now married:
47.5% (3,454)Unmarried:
52.5% (3,815)
Marital status - Hispanic or Latino population 15 years and over
Males 41.7% Never married43.5% Now married4.3% Separated0.0% Widowed10.5% DivorcedFemales 46.7% Never married31.3% Now married4.2% Separated6.2% Widowed11.5% DivorcedWomen who gave birth in the past 12 months Now married:
13.0% (6)Unmarried:
87.0% (41)
Women who did not give birth in the past 12 months Now married:
27.0% (333)Unmarried:
73.0% (901)
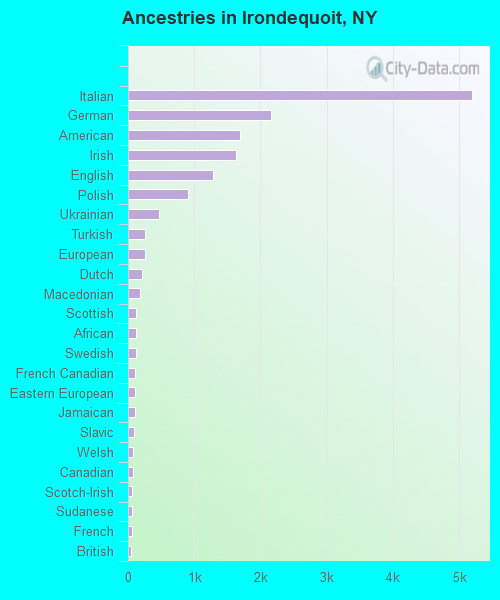
Ancestries in Irondequoit
5,192 23.8% Italian2,154 9.9% German1,689 7.7% American1,636 7.5% Irish1,285 5.9% English909 4.2% Polish465 2.1% Ukrainian263 1.2% Turkish260 1.2% European205 0.9% Dutch184 0.8% Macedonian127 0.6% Scottish123 0.6% African120 0.5% Swedish111 0.5% French Canadian110 0.5% Eastern European110 0.5% Jamaican93 0.4% Slavic76 0.3% Welsh70 0.3% Canadian57 0.3% Scotch-Irish57 0.3% Sudanese54 0.2% French50 0.2% British43 0.2% Lebanese43 0.2% Northern European42 0.2% Greek33 0.2% Russian32 0.1% Yugoslavian29 0.1% Haitian28 0.1% Lithuanian24 0.1% Egyptian23 0.1% Trinidadian and Tobagonian19 0.09% Albanian16 0.07% Hungarian13 0.06% Norwegian11 0.05% Bulgarian10 0.05% Austrian9 0.04% Armenian9 0.04% Ethiopian9 0.04% Cypriot9 0.04% Liberian7 0.03% Portuguese7 0.03% Romanian6 0.03% Ghanaian5 0.02% Brazilian
Geographical mobility in Irondequoit Same house 1 year ago 35,192 91.6% White (Caucasian)3,254 84.5% Black or African American36 27.2% American Indian / Alaska Native857 85.3% Asian47 89.7% Native Hawaiian / Pacific Islander1,604 80.2% Other race4,168 83.2% Two or more races34,714 91.7% White alone, not Hispanic / Latino4,366 82.4% Hispanic or LatinoMoved within same county 2,304 6.0% White / Caucasian582 15.1% Black or African American51 39.1% American Indian / Alaska Native105 10.4% Asian262 13.1% Other race657 13.1% Two or more races2,332 6.2% White alone, not Hispanic / Latino627 11.8% Hispanic or LatinoMoved within same state 633 1.6% White / Caucasian7 0.2% Black or African American19 14.2% American Indian / Alaska Native7 0.7% Asian17 0.8% Other race70 1.4% Two or more races494 1.3% White alone, not Hispanic / Latino218 4.1% Hispanic or LatinoMoved from different state 185 0.5% White / Caucasian45 1.2% Black or African American10 1.0% Asian23 1.1% Other race66 1.3% Two or more races192 0.5% White alone, not Hispanic / Latino69 1.3% Hispanic or LatinoMoved from abroad 21 0.1% White35 0.7% Two or more races24 0.1% White alone, not Hispanic / Latino
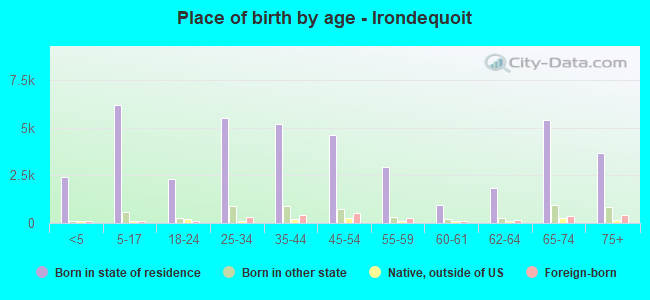
Children Nativity (place of birth) in Irondequoit
Children under 6 years - Living with two parents Both parents native 1,582 99.6% Native7 0.4% Foreign-bornBoth parents foreign-born 26 100.0% NativeOne native, one foreign-born parent 240 89.1% Native29 10.9% Foreign-bornChildren under 6 years - Living with one parent Native parent 953 100.0% NativeForeign-born parent 49 100.0% NativeChildren 6 to 17 years - Living with two parents Both parents native 3,082 99.6% Native11 0.4% Foreign-bornBoth parents foreign-born 195 95.2% Native10 4.8% Foreign-bornOne native, one foreign-born parent 506 97.7% Native12 2.3% Foreign-bornChildren 6 to 17 years - Living with one parent Native parent 2,037 100.0% NativeForeign-born parent 187 47.6% Native206 52.4% Foreign-born
Grandparents responsible for own grandchildren in Irondequoit
Grandparents (30 to 59 years) White / Caucasian 33 40.3% Responsible for grandchildren49 59.7% Not responsible for grandchildrenWhite alone, not Hispanic / Latino 33 39.0% Responsible for grandchildren52 61.0% Not responsible for grandchildrenHispanic or Latino 1 89.4% Responsible for grandchildrenGrandparents (60 years and over) White / Caucasian 146 45.8% Responsible for grandchildren173 54.2% Not responsible for grandchildrenWhite alone, not Hispanic / Latino 130 42.2% Responsible for grandchildren178 57.8% Not responsible for grandchildrenHispanic or Latino 13 61.0% Responsible for grandchildren8 39.0% Not responsible for grandchildren