Races in Irvine, California (CA) Detailed Stats
Data:
Races - White alone (%)
Races - White alone (% change since 2000)
Races - Black alone (%)
Races - Black alone (% change since 2000)
Races - American Indian alone (%)
Races - American Indian alone (% change since 2000)
Races - Asian alone (%)
Races - Asian alone (% change since 2000)
Races - Hispanic (%)
Races - Hispanic (% change since 2000)
Races - Native Hawaiian and Other Pacific Islander alone (%)
Races - Native Hawaiian and Other Pacific Islander alone (% change since 2000)
Races - Two or more races(%)
Races - Two or more races(% change since 2000)
Races - Other race alone (%)
Races - Other race alone (% change since 2000)
Racial diversity
Place of birth - Born in state of residence (%)
Place of birth - Born in state of residence (%) - White
Place of birth - Born in state of residence (%) - Black or African American
Place of birth - Born in state of residence (%) - Asian
Place of birth - Born in state of residence (%) - Hispanic or Latino
Place of birth - Born in state of residence (%) - American Indian and Alaska Native
Place of birth - Born in state of residence (%) - Multirace
Place of birth - Born in state of residence (%) - Other Race
Place of birth - Born in other state (%)
Place of birth - Born in other state (%) - White
Place of birth - Born in other state (%) - Black or African American
Place of birth - Born in other state (%) - Asian
Place of birth - Born in other state (%) - Hispanic or Latino
Place of birth - Born in other state (%) - American Indian and Alaska Native
Place of birth - Born in other state (%) - Multirace
Place of birth - Born in other state (%) - Other Race
Place of birth - Native, outside of US (%)
Place of birth - Native, outside of US (%) - White
Place of birth - Native, outside of US (%) - Black or African American
Place of birth - Native, outside of US (%) - Asian
Place of birth - Native, outside of US (%) - Hispanic or Latino
Place of birth - Native, outside of US (%) - American Indian and Alaska Native
Place of birth - Native, outside of US (%) - Multirace
Place of birth - Native, outside of US (%) - Other Race
Place of birth - Foreign born (%)
Place of birth - Foreign born (%) - White
Place of birth - Foreign born (%) - Black or African American
Place of birth - Foreign born (%) - Asian
Place of birth - Foreign born (%) - Hispanic or Latino
Place of birth - Foreign born (%) - American Indian and Alaska Native
Place of birth - Foreign born (%) - Multirace
Place of birth - Foreign born (%) - Other Race
Residents speaking English at home (%)
Residents speaking English at home - Born in the United States (%)
Residents speaking English at home - Native, born elsewhere (%)
Residents speaking English at home - Foreign born (%)
Residents speaking Spanish at home (%)
Residents speaking Spanish at home - Born in the United States (%)
Residents speaking Spanish at home - Native, born elsewhere (%)
Residents speaking Spanish at home - Foreign born (%)
Residents speaking other language at home (%)
Residents speaking other language at home - Born in the United States (%)
Residents speaking other language at home - Native, born elsewhere (%)
Residents speaking other language at home - Foreign born (%)
Marital status - Never married (%)
Marital status - Now married (%)
Marital status - Separated (%)
Marital status - Widowed (%)
Marital status - Divorced (%)
Ancestries Reported - Arab (%)
Ancestries Reported - Czech (%)
Ancestries Reported - Danish (%)
Ancestries Reported - Dutch (%)
Ancestries Reported - English (%)
Ancestries Reported - French (%)
Ancestries Reported - French Canadian (%)
Ancestries Reported - German (%)
Ancestries Reported - Greek (%)
Ancestries Reported - Hungarian (%)
Ancestries Reported - Irish (%)
Ancestries Reported - Italian (%)
Ancestries Reported - Lithuanian (%)
Ancestries Reported - Norwegian (%)
Ancestries Reported - Polish (%)
Ancestries Reported - Portuguese (%)
Ancestries Reported - Russian (%)
Ancestries Reported - Scotch-Irish (%)
Ancestries Reported - Scottish (%)
Ancestries Reported - Slovak (%)
Ancestries Reported - Subsaharan African (%)
Ancestries Reported - Swedish (%)
Ancestries Reported - Swiss (%)
Ancestries Reported - Ukrainian (%)
Ancestries Reported - United States (%)
Ancestries Reported - Welsh (%)
Ancestries Reported - West Indian (%)
Ancestries Reported - Other (%)
Geographical mobility - Same house 1 year ago (%)
Geographical mobility - Same house 1 year ago (%) - White
Geographical mobility - Same house 1 year ago (%) - Black or African American
Geographical mobility - Same house 1 year ago (%) - Asian
Geographical mobility - Same house 1 year ago (%) - Hispanic or Latino
Geographical mobility - Same house 1 year ago (%) - American Indian and Alaska Native
Geographical mobility - Same house 1 year ago (%) - Multirace
Geographical mobility - Same house 1 year ago (%) - Other Race
Geographical mobility - Moved within same county (%)
Geographical mobility - Moved within same county (%) - White
Geographical mobility - Moved within same county (%) - Black or African American
Geographical mobility - Moved within same county (%) - Asian
Geographical mobility - Moved within same county (%) - Hispanic or Latino
Geographical mobility - Moved within same county (%) - American Indian and Alaska Native
Geographical mobility - Moved within same county (%) - Multirace
Geographical mobility - Moved within same county (%) - Other Race
Geographical mobility - Moved from different county within same state (%)
Geographical mobility - Moved from different county within same state (%) - White
Geographical mobility - Moved from different county within same state (%) - Black or African American
Geographical mobility - Moved from different county within same state (%) - Asian
Geographical mobility - Moved from different county within same state (%) - Hispanic or Latino
Geographical mobility - Moved from different county within same state (%) - American Indian and Alaska Native
Geographical mobility - Moved from different county within same state (%) - Multirace
Geographical mobility - Moved from different county within same state (%) - Other Race
Geographical mobility - Moved from different state (%)
Geographical mobility - Moved from different state (%) - White
Geographical mobility - Moved from different state (%) - Black or African American
Geographical mobility - Moved from different state (%) - Asian
Geographical mobility - Moved from different state (%) - Hispanic or Latino
Geographical mobility - Moved from different state (%) - American Indian and Alaska Native
Geographical mobility - Moved from different state (%) - Multirace
Geographical mobility - Moved from different state (%) - Other Race
Geographical mobility - Moved from abroad (%)
Geographical mobility - Moved from abroad (%) - White
Geographical mobility - Moved from abroad (%) - Black or African American
Geographical mobility - Moved from abroad (%) - Asian
Geographical mobility - Moved from abroad (%) - Hispanic or Latino
Geographical mobility - Moved from abroad (%) - American Indian and Alaska Native
Geographical mobility - Moved from abroad (%) - Multirace
Geographical mobility - Moved from abroad (%) - Other Race
Place of birth for the foreign-born population - Ireland (%)
Place of birth for the foreign-born population - Denmark (%)
Place of birth for the foreign-born population - Norway (%)
Place of birth for the foreign-born population - Sweden (%)
Place of birth for the foreign-born population - United Kingdom (%)
Place of birth for the foreign-born population - England (%)
Place of birth for the foreign-born population - Scotland (%)
Place of birth for the foreign-born population - Other Northern Europe (%)
Place of birth for the foreign-born population - Austria (%)
Place of birth for the foreign-born population - Belgium (%)
Place of birth for the foreign-born population - France (%)
Place of birth for the foreign-born population - Germany (%)
Place of birth for the foreign-born population - Netherlands (%)
Place of birth for the foreign-born population - Switzerland (%)
Place of birth for the foreign-born population - Other Western Europe (%)
Place of birth for the foreign-born population - Greece (%)
Place of birth for the foreign-born population - Italy (%)
Place of birth for the foreign-born population - Portugal (%)
Place of birth for the foreign-born population - Spain (%)
Place of birth for the foreign-born population - Other Southern Europe (%)
Place of birth for the foreign-born population - Albania (%)
Place of birth for the foreign-born population - Belarus (%)
Place of birth for the foreign-born population - Bosnia and Herzegovina (%)
Place of birth for the foreign-born population - Bulgaria (%)
Place of birth for the foreign-born population - Croatia (%)
Place of birth for the foreign-born population - Czechoslovakia (%)
Place of birth for the foreign-born population - Hungary (%)
Place of birth for the foreign-born population - Latvia (%)
Place of birth for the foreign-born population - Lithuania (%)
Place of birth for the foreign-born population - North Macedonia (Macedonia) (%)
Place of birth for the foreign-born population - Moldova (%)
Place of birth for the foreign-born population - Poland (%)
Place of birth for the foreign-born population - Romania (%)
Place of birth for the foreign-born population - Russia (%)
Place of birth for the foreign-born population - Serbia (%)
Place of birth for the foreign-born population - Ukraine (%)
Place of birth for the foreign-born population - Other Eastern Europe (%)
Place of birth for the foreign-born population - China (%)
Place of birth for the foreign-born population - Hong Kong (%)
Place of birth for the foreign-born population - Taiwan (%)
Place of birth for the foreign-born population - Japan (%)
Place of birth for the foreign-born population - Korea (%)
Place of birth for the foreign-born population - Other Eastern Asia (%)
Place of birth for the foreign-born population - Afghanistan (%)
Place of birth for the foreign-born population - Bangladesh (%)
Place of birth for the foreign-born population - India (%)
Place of birth for the foreign-born population - Iran (%)
Place of birth for the foreign-born population - Kazakhstan (%)
Place of birth for the foreign-born population - Nepal (%)
Place of birth for the foreign-born population - Pakistan (%)
Place of birth for the foreign-born population - Sri Lanka (%)
Place of birth for the foreign-born population - Uzbekistan (%)
Place of birth for the foreign-born population - Other South Central Asia (%)
Place of birth for the foreign-born population - Burma (%)
Place of birth for the foreign-born population - Cambodia (%)
Place of birth for the foreign-born population - Indonesia (%)
Place of birth for the foreign-born population - Laos (%)
Place of birth for the foreign-born population - Malaysia (%)
Place of birth for the foreign-born population - Philippines (%)
Place of birth for the foreign-born population - Singapore (%)
Place of birth for the foreign-born population - Thailand (%)
Place of birth for the foreign-born population - Vietnam (%)
Place of birth for the foreign-born population - Other South Eastern Asia (%)
Place of birth for the foreign-born population - Armenia (%)
Place of birth for the foreign-born population - Iraq (%)
Place of birth for the foreign-born population - Israel (%)
Place of birth for the foreign-born population - Jordan (%)
Place of birth for the foreign-born population - Kuwait (%)
Place of birth for the foreign-born population - Lebanon (%)
Place of birth for the foreign-born population - Saudi Arabia (%)
Place of birth for the foreign-born population - Syria (%)
Place of birth for the foreign-born population - Turkey (%)
Place of birth for the foreign-born population - Yemen (%)
Place of birth for the foreign-born population - Other Western Asia (%)
Place of birth for the foreign-born population - Eritrea (%)
Place of birth for the foreign-born population - Ethiopia (%)
Place of birth for the foreign-born population - Kenya (%)
Place of birth for the foreign-born population - Somalia (%)
Place of birth for the foreign-born population - Uganda (%)
Place of birth for the foreign-born population - Zimbabwe (%)
Place of birth for the foreign-born population - Other Eastern Africa (%)
Place of birth for the foreign-born population - Cameroon (%)
Place of birth for the foreign-born population - Congo (%)
Place of birth for the foreign-born population - Democratic Republic of Congo (Zaire) (%)
Place of birth for the foreign-born population - Other Middle Africa (%)
Place of birth for the foreign-born population - Egypt (%)
Place of birth for the foreign-born population - Morocco (%)
Place of birth for the foreign-born population - Sudan (%)
Place of birth for the foreign-born population - Other Northern Africa (%)
Place of birth for the foreign-born population - South Africa (%)
Place of birth for the foreign-born population - Other Southern Africa (%)
Place of birth for the foreign-born population - Cabo Verde (%)
Place of birth for the foreign-born population - Ghana (%)
Place of birth for the foreign-born population - Liberia (%)
Place of birth for the foreign-born population - Nigeria (%)
Place of birth for the foreign-born population - Senegal (%)
Place of birth for the foreign-born population - Sierra Leone (%)
Place of birth for the foreign-born population - Other Western Africa (%)
Place of birth for the foreign-born population - Australia (%)
Place of birth for the foreign-born population - New Zealand (%)
Place of birth for the foreign-born population - Fiji (%)
Place of birth for the foreign-born population - Micronesia (%)
Place of birth for the foreign-born population - Bahamas (%)
Place of birth for the foreign-born population - Barbados (%)
Place of birth for the foreign-born population - Cuba (%)
Place of birth for the foreign-born population - Dominica (%)
Place of birth for the foreign-born population - Dominican Republic (%)
Place of birth for the foreign-born population - Grenada (%)
Place of birth for the foreign-born population - Haiti (%)
Place of birth for the foreign-born population - Jamaica (%)
Place of birth for the foreign-born population - St. Vincent and the Grenadines (%)
Place of birth for the foreign-born population - Trinidad and Tobago (%)
Place of birth for the foreign-born population - West Indies (%)
Place of birth for the foreign-born population - Other Caribbean (%)
Place of birth for the foreign-born population - Belize (%)
Place of birth for the foreign-born population - Costa Rica (%)
Place of birth for the foreign-born population - El Salvador (%)
Place of birth for the foreign-born population - Guatemala (%)
Place of birth for the foreign-born population - Honduras (%)
Place of birth for the foreign-born population - Mexico (%)
Place of birth for the foreign-born population - Nicaragua (%)
Place of birth for the foreign-born population - Panama (%)
Place of birth for the foreign-born population - Other Central America (%)
Place of birth for the foreign-born population - Argentina (%)
Place of birth for the foreign-born population - Bolivia (%)
Place of birth for the foreign-born population - Brazil (%)
Place of birth for the foreign-born population - Chile (%)
Place of birth for the foreign-born population - Colombia (%)
Place of birth for the foreign-born population - Ecuador (%)
Place of birth for the foreign-born population - Guyana (%)
Place of birth for the foreign-born population - Peru (%)
Place of birth for the foreign-born population - Uruguay (%)
Place of birth for the foreign-born population - Venezuela (%)
Place of birth for the foreign-born population - Other South America (%)
Place of birth for the foreign-born population - Canada (%)
Place of birth for the foreign-born population - Other Northern America (%)
Place of birth for the foreign-born population - Other (%)
Latest news about races in Irvine, CA collected exclusively by city-data.com from local newspapers, TV, and radio stations
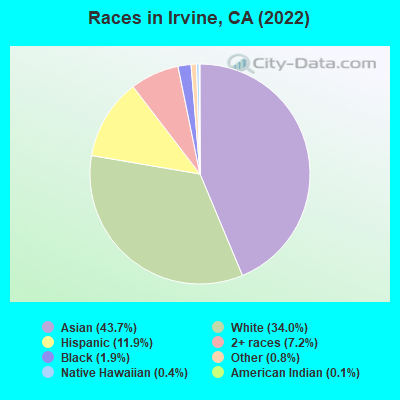
According to 2022 data, the most numerous races in Irvine, CA are Hispanic (30,457 residents), White alone (107,088 residents), and Asian alone (128,616 residents). 49.2% of Irvine residents speak English at home. 41.5% of Irvine, CA residents are foreign-born (33.7% born in Asia), which is 37.4% greater than the foreign-born rate of 26.0% across the entire state of California.
Race distribution in Irvine
2000 2022
81,613 57.0% White alone 42,506 29.7% Asian alone 10,539 7.4% Hispanic 5,736 4.0% Two or more races 1,977 1.4% Black alone 359 0.3% Other race alone 180 0.1% Native Hawaiian and Other 162 0.1% American Indian alone
128,616 44.7% Asian alone 107,088 37.2% White alone 30,457 10.6% Hispanic 18,013 6.3% Two or more races 6,058 2.1% Black alone 614 0.2% Other race alone 456 0.2% Native Hawaiian and Other 68 0.02% American Indian alone
2000 2022
15,816,790 46.7% White alone 10,966,556 32.4% Hispanic 3,648,860 10.8% Asian alone 2,181,926 6.4% Black alone 903,115 2.7% Two or more races 178,984 0.5% American Indian alone 103,736 0.3% Native Hawaiian and Other 71,681 0.2% Other race alone
15,732,184 40.3% Hispanic 13,160,426 33.7% White alone 5,957,867 15.3% Asian alone 2,025,218 5.2% Black alone 1,663,222 4.3% Two or more races 251,618 0.6% Other race alone 135,777 0.3% Native Hawaiian and Other 103,030 0.3% American Indian alone
Income and house value in Irvine Median household income in 2022 $138,108 White non-Hispanic householders$137,619 Black householders$137,171 American Indian and Alaska Native householders$135,940 Asian householders$198,727 Native Hawaiian and other Pacific Islander householders$55,429 Some other race householders$132,662 Two or more races householders$111,079 Hispanic or Latino race householdersMedian 2022 house value over $1,000,000 White Non-Hispanic householders$869,949 Black or African American householders$663,710 American Indian or Alaska Native householders over $1,000,000 Asian householders$679,187 Native Hawaiian and other Pacific Islander householders$856,992 Some other race householdersover $1,000,000 Two or more races householders$992,325 Hispanic or Latino householders
Median age by race in Irvine
36.8 Median age for White residents35.5 38.5 32.2 Median age for Black or African American residents30.7 48.9 53.1 Median age for American Indian / Alaska Native residents32.8 Median age for Asian residents32.6 33.7 43.2 Median age for Native Hawaiian / Pacific Islander residents27.9 Median age for Other race residents27.8 27.9 27.9 Median age for Two or more races residents29.1 27.5 38.7 Median age for White alone residents35.5 42.3 25.9 Median age for Hispanic or Latino residents26.0 25.6
Owner/renter occupied households by race in Irvine
House owners and renters - White residents 18,210 38.1% Owner occupied29,546 61.9% Renter occupiedHouse owners and renters - Black or African American residents 739 33.3% Owner occupied1,482 66.7% Renter occupiedHouse owners and renters - American Indian / Alaska Native residents 57 38.0% Owner occupied93 62.0% Renter occupiedHouse owners and renters - Asian residents 25,368 57.3% Owner occupied18,906 42.7% Renter occupiedHouse owners and renters - Native Hawaiian / Pacific Islander residents 135 68.9% Owner occupied61 31.1% Renter occupiedHouse owners and renters - Other race residents 393 25.4% Owner occupied1,154 74.6% Renter occupiedHouse owners and renters - Two or more races residents 4,045 35.1% Owner occupied7,483 64.9% Renter occupiedHouse owners and renters - White alone residents 18,659 39.6% Owner occupied28,499 60.4% Renter occupiedHouse owners and renters - Hispanic or Latino residents 1,496 16.5% Owner occupied7,582 83.5% Renter occupied
Language usage in Irvine
English speakers - Total 49.2% of residents of Irvine speak English at home.
6.2% of residents speak Spanish at home 13,414 84.3% Speak English very well2,489 15.7% Speak English less than very well45.4% of residents speak other language at home 75,141 64.3% Speak English very well41,716 35.7% Speak English less than very well
English speakers - Born in the United States 86.3% of residents of Irvine speak English at home.
3.2% of residents speak Spanish at home 1,270 93.2% Speak English very well93 6.8% Speak English less than very well11.1% of residents speak other language at home 4,298 92.4% Speak English very well352 7.6% Speak English less than very well
English speakers - Native, born elsewhere 52.8% of residents of Irvine speak English at home.
5.0% of residents speak Spanish at home 174 75.0% Speak English very well58 25.0% Speak English less than very well40.5% of residents speak other language at home 1,614 85.1% Speak English very well282 14.9% Speak English less than very well
English speakers - Foreign-born 14.7% of residents of Irvine speak English at home.
5.2% of residents speak Spanish at home 3,970 69.5% Speak English very well1,740 30.5% Speak English less than very well82.9% of residents speak other language at home 52,524 57.6% Speak English very well38,602 42.4% Speak English less than very well
White (Caucasian) - Speak only English Native:
90.7% (74,304)Foreign-born:
26.5% (5,730)
White (Caucasian) - Speak another language Native:
11.1% (9,088)Foreign-born:
76.0% (16,417)
Black or African American - Speak only English Native:
90.6% (3,102)Foreign-born:
41.3% (391)
Black or African American - Speak another language Native:
9.7% (332)Foreign-born:
56.3% (533)
Asian - Speak only English Native:
52.0% (21,280)Foreign-born:
11.8% (9,280)
Asian - Speak another language Native:
47.6% (19,487)Foreign-born:
88.2% (69,205)
Native Hawaiian / Pacific Islander - Speak only English Native:
88.1% (319)Foreign-born:
11.4% (24)
Native Hawaiian / Pacific Islander - Speak another language Native:
15.7% (57)Foreign-born:
87.7% (183)
Other race - Speak only English Native:
50.0% (2,856)Foreign-born:
21.5% (472)
Other race - Speak another language Native:
50.9% (2,910)Foreign-born:
84.6% (1,856)
Two or more races - Speak only English Native:
58.8% (15,406)Foreign-born:
11.1% (1,740)
Two or more races - Speak another language Native:
50.9% (13,328)Foreign-born:
87.4% (13,726)
White alone - Speak only English Native:
90.3% (67,765)Foreign-born:
20.5% (5,623)
White alone - Speak another language Native:
9.9% (7,391)Foreign-born:
79.7% (21,852)
Hispanic or Latino - Speak only English Native:
64.1% (14,254)Foreign-born:
14.5% (870)
Hispanic or Latino - Speak another language Native:
37.7% (8,383)Foreign-born:
87.9% (5,278)
Foreign-born residents in Irvine 113,884 residents are foreign born (33.7% Asia ).
This city:
41.5%California:
100.0%
Marital status for residents in Irvine Marital status - White (Caucasian) population 15 years and over
Males 45.9% Never married43.8% Now married0.5% Separated0.9% Widowed8.9% DivorcedFemales 37.7% Never married42.1% Now married1.6% Separated6.4% Widowed12.2% DivorcedWomen who gave birth in the past 12 months Now married:
69.0% (938)Unmarried:
31.0% (421)
Women who did not give birth in the past 12 months Now married:
38.3% (9,919)Unmarried:
61.7% (15,954)
Marital status - Black or African American population 15 years and over
Males 55.3% Never married33.3% Now married1.4% Separated1.2% Widowed8.8% DivorcedFemales 49.2% Never married32.9% Now married0.5% Separated3.5% Widowed13.9% DivorcedWomen who gave birth in the past 12 months Now married:
0.0% (0)Unmarried:
100.0% (8)
Women who did not give birth in the past 12 months Now married:
24.0% (300)Unmarried:
76.0% (949)
Marital status - American Indian / Alaska Native population 15 years and over
Males 25.4% Never married58.5% Now married0.0% Separated0.0% Widowed16.2% DivorcedFemales 67.6% Never married32.4% Now married0.0% Separated0.0% Widowed0.0% DivorcedWomen who did not give birth in the past 12 months Now married:
48.7% (76)Unmarried:
51.3% (80)
Marital status - Asian population 15 years and over
Males 41.5% Never married54.1% Now married1.4% Separated1.1% Widowed1.8% DivorcedFemales 32.7% Never married56.4% Now married0.4% Separated4.8% Widowed5.8% DivorcedWomen who gave birth in the past 12 months Now married:
95.4% (1,918)Unmarried:
4.6% (92)
Women who did not give birth in the past 12 months Now married:
51.1% (18,787)Unmarried:
48.9% (17,965)
Marital status - Native Hawaiian / Pacific Islander population 15 years and over
Males 33.5% Never married66.5% Now married0.0% Separated0.0% Widowed0.0% DivorcedFemales 23.5% Never married62.0% Now married7.5% Separated7.0% Widowed0.0% DivorcedWomen who did not give birth in the past 12 months Now married:
63.2% (90)Unmarried:
36.8% (52)
Marital status - Other race population 15 years and over
Males 51.0% Never married44.9% Now married0.8% Separated0.0% Widowed3.3% DivorcedFemales 58.3% Never married32.3% Now married1.7% Separated4.2% Widowed3.5% DivorcedWomen who gave birth in the past 12 months Now married:
79.8% (101)Unmarried:
20.2% (25)
Women who did not give birth in the past 12 months Now married:
25.1% (742)Unmarried:
74.9% (2,210)
Marital status - Two or more races population 15 years and over
Males 62.3% Never married25.6% Now married0.0% Separated5.5% Widowed6.6% DivorcedFemales 64.9% Never married21.9% Now married5.5% Separated0.0% Widowed7.7% DivorcedWomen who gave birth in the past 12 months Now married:
100.0% (276)Unmarried:
0.0% (0)
Women who did not give birth in the past 12 months Now married:
24.5% (3,032)Unmarried:
75.5% (9,355)
Marital status - White alone, not Hispanic / Latino population 15 years and over
Males 44.3% Never married45.5% Now married0.6% Separated0.9% Widowed8.7% DivorcedFemales 34.5% Never married44.3% Now married1.3% Separated7.3% Widowed12.7% DivorcedWomen who gave birth in the past 12 months Now married:
71.7% (1,000)Unmarried:
28.3% (395)
Women who did not give birth in the past 12 months Now married:
40.8% (9,946)Unmarried:
59.2% (14,438)
Marital status - Hispanic or Latino population 15 years and over
Males 55.9% Never married35.0% Now married0.0% Separated0.4% Widowed8.7% DivorcedFemales 53.5% Never married31.8% Now married4.5% Separated1.9% Widowed8.3% DivorcedWomen who gave birth in the past 12 months Now married:
52.5% (128)Unmarried:
47.5% (116)
Women who did not give birth in the past 12 months Now married:
32.8% (3,105)Unmarried:
67.2% (6,370)
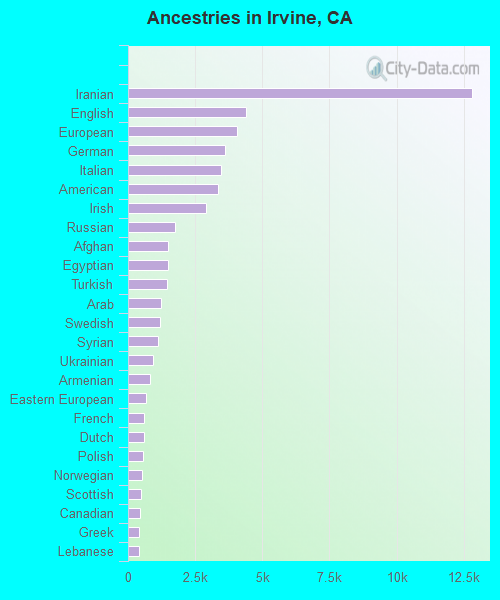
Ancestries in Irvine
11,028 6.5% Iranian4,158 2.4% American3,956 2.3% English3,900 2.3% European3,546 2.1% German3,052 1.8% Irish2,210 1.3% Italian2,189 1.3% Afghan1,607 0.9% Egyptian1,600 0.9% Russian1,404 0.8% Iraqi1,079 0.6% Turkish904 0.5% Eastern European856 0.5% Armenian738 0.4% Syrian725 0.4% Lebanese697 0.4% French697 0.4% British671 0.4% Polish590 0.3% Scottish564 0.3% Arab500 0.3% Norwegian491 0.3% Brazilian486 0.3% Ukrainian455 0.3% African419 0.2% Canadian391 0.2% South African391 0.2% Swedish350 0.2% Israeli345 0.2% Northern European332 0.2% Lithuanian315 0.2% Dutch311 0.2% Scandinavian308 0.2% Palestinian287 0.2% Romanian270 0.2% Greek257 0.2% Swiss232 0.1% Portuguese227 0.1% Hungarian214 0.1% Jordanian202 0.1% Danish158 0.09% Scotch-Irish147 0.09% Estonian125 0.07% Australian115 0.07% Bulgarian113 0.07% Czech113 0.07% Croatian103 0.06% French Canadian85 0.05% Moroccan81 0.05% Nigerian79 0.05% Albanian73 0.04% Bahamian70 0.04% Ethiopian68 0.04% Welsh65 0.04% Austrian63 0.04% Icelander52 0.03% Jamaican51 0.03% Finnish49 0.03% Ugandan47 0.03% Haitian42 0.02% Slovak40 0.02% Serbian40 0.02% Ghanaian40 0.02% Yugoslavian34 0.02% Somali22 0.01% Basque21 0.01% Kenyan20 0.01% Belgian20 0.01% Assyrian20 0.01% Macedonian17 0.01% Czechoslovakian17 0.01% Cypriot15 0.01% Guyanese14 0.01% Latvian12 0.01% Maltese11 0.01% Slavic10 0.01% New Zealander
Geographical mobility in Irvine Same house 1 year ago 83,139 75.9% White (Caucasian)3,236 71.4% Black or African American598 100.0% American Indian / Alaska Native98,574 77.0% Asian675 98.8% Native Hawaiian / Pacific Islander5,101 72.1% Other race31,646 86.7% Two or more races83,457 80.9% White alone, not Hispanic / Latino21,220 74.9% Hispanic or LatinoMoved within same county 15,375 14.0% White / Caucasian565 12.5% Black or African American15,400 12.0% Asian805 11.4% Other race2,662 7.3% Two or more races10,569 10.2% White alone, not Hispanic / Latino3,095 10.9% Hispanic or LatinoMoved within same state 6,152 5.6% White / Caucasian278 6.1% Black or African American6,853 5.4% Asian9 1.3% Native Hawaiian / Pacific Islander766 10.8% Other race1,078 3.0% Two or more races3,569 3.5% White alone, not Hispanic / Latino2,642 9.3% Hispanic or LatinoMoved from different state 2,439 2.2% White / Caucasian173 3.8% Black or African American2,216 1.7% Asian55 0.8% Other race380 1.0% Two or more races2,841 2.8% White alone, not Hispanic / Latino623 2.2% Hispanic or LatinoMoved from abroad 1,539 1.4% White183 4.0% Black or African American4,040 3.2% Asian112 1.6% Other race399 1.1% Two or more races1,788 1.7% White alone, not Hispanic / Latino375 1.3% Hispanic or Latino
Children Nativity (place of birth) in Irvine
Children under 6 years - Living with two parents Both parents native 5,715 98.9% Native66 1.1% Foreign-bornBoth parents foreign-born 7,476 88.9% Native938 11.1% Foreign-bornOne native, one foreign-born parent 3,203 93.1% Native237 6.9% Foreign-bornChildren under 6 years - Living with one parent Native parent 2,414 100.0% Native1 0.0% Foreign-bornForeign-born parent 814 95.0% Native43 5.0% Foreign-bornChildren 6 to 17 years - Living with two parents Both parents native 7,116 100.0% NativeBoth parents foreign-born 10,910 68.2% Native5,097 31.8% Foreign-bornOne native, one foreign-born parent 4,744 100.0% NativeChildren 6 to 17 years - Living with one parent Native parent 5,170 100.0% NativeForeign-born parent 3,127 54.5% Native2,616 45.5% Foreign-born
Place of birth for residents in Irvine 93,141 Asia49,871 Eastern Asia31,016 China23,666 South Central Asia13,524 South Eastern Asia9,344 Americas7,620 Latin America6,998 Europe5,777 Western Asia4,743 Central America3,847 Africa3,250 Eastern Europe2,657 South America1,742 Northern Europe1,723 Northern America1,681 Northern Africa1,516 Western Europe896 Southern Africa567 Western Africa558 Eastern Africa552 Oceania490 Southern Europe385 Australia and New Zealand Subregion219 Caribbean40 Middle Africa20,131 China13,992 Korea10,633 India10,336 Iran9,223 Taiwan5,698 Vietnam4,827 Japan4,806 Philippines3,720 Mexico1,723 Canada1,661 Hong Kong1,349 Iraq1,342 Egypt1,250 Indonesia1,229 Russia1,164 Afghanistan983 Saudi Arabia896 South Africa845 Pakistan800 Turkey686 United Kingdom635 Brazil593 Germany588 Lebanon581 England574 France534 Peru514 Ukraine455 Malaysia455 Thailand453 Israel444 El Salvador396 Syria338 Singapore331 Colombia323 Senegal292 Australia263 Romania261 Ecuador256 Sri Lanka249 Laos243 Chile234 Italy229 Costa Rica226 Sudan224 Argentina216 Bangladesh211 Cambodia202 Poland191 Bolivia188 Switzerland181 Armenia170 Jordan155 Czechoslovakia150 Kuwait150 Fiji139 Kenya138 Ireland125 Spain119 Guatemala117 Uganda116 Nepal115 Guyana114 Nicaragua112 Bulgaria106 Sweden105 Panama103 Nigeria99 Morocco96 Greece93 New Zealand92 Scotland88 Albania86 Hungary84 Zimbabwe73 Netherlands68 Cuba68 Kazakhstan66 Uruguay60 Belgium59 Belarus58 Burma57 Ethiopia53 Ghana53 Bahamas42 Dominican Republic40 Democratic Republic of Congo (Zaire)38 Moldova36 Somalia35 Denmark32 Sierra Leone29 Jamaica26 Norway26 Croatia25 Austria21 Dominica18 Portugal18 Venezuela14 Latvia12 Yemen9 Belize6 Liberia6 Uzbekistan
Grandparents responsible for own grandchildren in Irvine
Grandparents (30 to 59 years) White / Caucasian 27 23.3% Responsible for grandchildren89 76.7% Not responsible for grandchildrenAsian 86 28.6% Responsible for grandchildren213 71.4% Not responsible for grandchildrenOther race 7 11.6% Responsible for grandchildren57 88.4% Not responsible for grandchildrenTwo or more races 128 25.4% Responsible for grandchildren377 74.6% Not responsible for grandchildrenWhite alone, not Hispanic / Latino 28 29.3% Responsible for grandchildren66 70.7% Not responsible for grandchildrenHispanic or Latino 7 6.5% Responsible for grandchildren100 93.5% Not responsible for grandchildrenGrandparents (60 years and over) White / Caucasian 161 22.7% Responsible for grandchildren546 77.3% Not responsible for grandchildrenAsian 85 5.4% Responsible for grandchildren1,482 94.6% Not responsible for grandchildrenTwo or more races 336 100.0% Not responsible for grandchildrenWhite alone, not Hispanic / Latino 157 19.3% Responsible for grandchildren654 80.7% Not responsible for grandchildrenHispanic or Latino 51 24.4% Responsible for grandchildren157 75.6% Not responsible for grandchildren
Zip codes: 92602 , 92603 , 92604 , 92606 , 92610 , 92612 , 92617 , 92618 , 92620 , 92630 , 92676 , 92780 , 92782 .