Races in Ives Estates, Florida (FL) Detailed Stats
Data:
Races - White alone (%)
Races - White alone (% change since 2000)
Races - Black alone (%)
Races - Black alone (% change since 2000)
Races - American Indian alone (%)
Races - American Indian alone (% change since 2000)
Races - Asian alone (%)
Races - Asian alone (% change since 2000)
Races - Hispanic (%)
Races - Hispanic (% change since 2000)
Races - Native Hawaiian and Other Pacific Islander alone (%)
Races - Native Hawaiian and Other Pacific Islander alone (% change since 2000)
Races - Two or more races(%)
Races - Two or more races(% change since 2000)
Races - Other race alone (%)
Races - Other race alone (% change since 2000)
Racial diversity
Place of birth - Born in state of residence (%)
Place of birth - Born in state of residence (%) - White
Place of birth - Born in state of residence (%) - Black or African American
Place of birth - Born in state of residence (%) - Asian
Place of birth - Born in state of residence (%) - Hispanic or Latino
Place of birth - Born in state of residence (%) - American Indian and Alaska Native
Place of birth - Born in state of residence (%) - Multirace
Place of birth - Born in state of residence (%) - Other Race
Place of birth - Born in other state (%)
Place of birth - Born in other state (%) - White
Place of birth - Born in other state (%) - Black or African American
Place of birth - Born in other state (%) - Asian
Place of birth - Born in other state (%) - Hispanic or Latino
Place of birth - Born in other state (%) - American Indian and Alaska Native
Place of birth - Born in other state (%) - Multirace
Place of birth - Born in other state (%) - Other Race
Place of birth - Native, outside of US (%)
Place of birth - Native, outside of US (%) - White
Place of birth - Native, outside of US (%) - Black or African American
Place of birth - Native, outside of US (%) - Asian
Place of birth - Native, outside of US (%) - Hispanic or Latino
Place of birth - Native, outside of US (%) - American Indian and Alaska Native
Place of birth - Native, outside of US (%) - Multirace
Place of birth - Native, outside of US (%) - Other Race
Place of birth - Foreign born (%)
Place of birth - Foreign born (%) - White
Place of birth - Foreign born (%) - Black or African American
Place of birth - Foreign born (%) - Asian
Place of birth - Foreign born (%) - Hispanic or Latino
Place of birth - Foreign born (%) - American Indian and Alaska Native
Place of birth - Foreign born (%) - Multirace
Place of birth - Foreign born (%) - Other Race
Residents speaking English at home (%)
Residents speaking English at home - Born in the United States (%)
Residents speaking English at home - Native, born elsewhere (%)
Residents speaking English at home - Foreign born (%)
Residents speaking Spanish at home (%)
Residents speaking Spanish at home - Born in the United States (%)
Residents speaking Spanish at home - Native, born elsewhere (%)
Residents speaking Spanish at home - Foreign born (%)
Residents speaking other language at home (%)
Residents speaking other language at home - Born in the United States (%)
Residents speaking other language at home - Native, born elsewhere (%)
Residents speaking other language at home - Foreign born (%)
Marital status - Never married (%)
Marital status - Now married (%)
Marital status - Separated (%)
Marital status - Widowed (%)
Marital status - Divorced (%)
Ancestries Reported - Arab (%)
Ancestries Reported - Czech (%)
Ancestries Reported - Danish (%)
Ancestries Reported - Dutch (%)
Ancestries Reported - English (%)
Ancestries Reported - French (%)
Ancestries Reported - French Canadian (%)
Ancestries Reported - German (%)
Ancestries Reported - Greek (%)
Ancestries Reported - Hungarian (%)
Ancestries Reported - Irish (%)
Ancestries Reported - Italian (%)
Ancestries Reported - Lithuanian (%)
Ancestries Reported - Norwegian (%)
Ancestries Reported - Polish (%)
Ancestries Reported - Portuguese (%)
Ancestries Reported - Russian (%)
Ancestries Reported - Scotch-Irish (%)
Ancestries Reported - Scottish (%)
Ancestries Reported - Slovak (%)
Ancestries Reported - Subsaharan African (%)
Ancestries Reported - Swedish (%)
Ancestries Reported - Swiss (%)
Ancestries Reported - Ukrainian (%)
Ancestries Reported - United States (%)
Ancestries Reported - Welsh (%)
Ancestries Reported - West Indian (%)
Ancestries Reported - Other (%)
Geographical mobility - Same house 1 year ago (%)
Geographical mobility - Same house 1 year ago (%) - White
Geographical mobility - Same house 1 year ago (%) - Black or African American
Geographical mobility - Same house 1 year ago (%) - Asian
Geographical mobility - Same house 1 year ago (%) - Hispanic or Latino
Geographical mobility - Same house 1 year ago (%) - American Indian and Alaska Native
Geographical mobility - Same house 1 year ago (%) - Multirace
Geographical mobility - Same house 1 year ago (%) - Other Race
Geographical mobility - Moved within same county (%)
Geographical mobility - Moved within same county (%) - White
Geographical mobility - Moved within same county (%) - Black or African American
Geographical mobility - Moved within same county (%) - Asian
Geographical mobility - Moved within same county (%) - Hispanic or Latino
Geographical mobility - Moved within same county (%) - American Indian and Alaska Native
Geographical mobility - Moved within same county (%) - Multirace
Geographical mobility - Moved within same county (%) - Other Race
Geographical mobility - Moved from different county within same state (%)
Geographical mobility - Moved from different county within same state (%) - White
Geographical mobility - Moved from different county within same state (%) - Black or African American
Geographical mobility - Moved from different county within same state (%) - Asian
Geographical mobility - Moved from different county within same state (%) - Hispanic or Latino
Geographical mobility - Moved from different county within same state (%) - American Indian and Alaska Native
Geographical mobility - Moved from different county within same state (%) - Multirace
Geographical mobility - Moved from different county within same state (%) - Other Race
Geographical mobility - Moved from different state (%)
Geographical mobility - Moved from different state (%) - White
Geographical mobility - Moved from different state (%) - Black or African American
Geographical mobility - Moved from different state (%) - Asian
Geographical mobility - Moved from different state (%) - Hispanic or Latino
Geographical mobility - Moved from different state (%) - American Indian and Alaska Native
Geographical mobility - Moved from different state (%) - Multirace
Geographical mobility - Moved from different state (%) - Other Race
Geographical mobility - Moved from abroad (%)
Geographical mobility - Moved from abroad (%) - White
Geographical mobility - Moved from abroad (%) - Black or African American
Geographical mobility - Moved from abroad (%) - Asian
Geographical mobility - Moved from abroad (%) - Hispanic or Latino
Geographical mobility - Moved from abroad (%) - American Indian and Alaska Native
Geographical mobility - Moved from abroad (%) - Multirace
Geographical mobility - Moved from abroad (%) - Other Race
Place of birth for the foreign-born population - Ireland (%)
Place of birth for the foreign-born population - Denmark (%)
Place of birth for the foreign-born population - Norway (%)
Place of birth for the foreign-born population - Sweden (%)
Place of birth for the foreign-born population - United Kingdom (%)
Place of birth for the foreign-born population - England (%)
Place of birth for the foreign-born population - Scotland (%)
Place of birth for the foreign-born population - Other Northern Europe (%)
Place of birth for the foreign-born population - Austria (%)
Place of birth for the foreign-born population - Belgium (%)
Place of birth for the foreign-born population - France (%)
Place of birth for the foreign-born population - Germany (%)
Place of birth for the foreign-born population - Netherlands (%)
Place of birth for the foreign-born population - Switzerland (%)
Place of birth for the foreign-born population - Other Western Europe (%)
Place of birth for the foreign-born population - Greece (%)
Place of birth for the foreign-born population - Italy (%)
Place of birth for the foreign-born population - Portugal (%)
Place of birth for the foreign-born population - Spain (%)
Place of birth for the foreign-born population - Other Southern Europe (%)
Place of birth for the foreign-born population - Albania (%)
Place of birth for the foreign-born population - Belarus (%)
Place of birth for the foreign-born population - Bosnia and Herzegovina (%)
Place of birth for the foreign-born population - Bulgaria (%)
Place of birth for the foreign-born population - Croatia (%)
Place of birth for the foreign-born population - Czechoslovakia (%)
Place of birth for the foreign-born population - Hungary (%)
Place of birth for the foreign-born population - Latvia (%)
Place of birth for the foreign-born population - Lithuania (%)
Place of birth for the foreign-born population - North Macedonia (Macedonia) (%)
Place of birth for the foreign-born population - Moldova (%)
Place of birth for the foreign-born population - Poland (%)
Place of birth for the foreign-born population - Romania (%)
Place of birth for the foreign-born population - Russia (%)
Place of birth for the foreign-born population - Serbia (%)
Place of birth for the foreign-born population - Ukraine (%)
Place of birth for the foreign-born population - Other Eastern Europe (%)
Place of birth for the foreign-born population - China (%)
Place of birth for the foreign-born population - Hong Kong (%)
Place of birth for the foreign-born population - Taiwan (%)
Place of birth for the foreign-born population - Japan (%)
Place of birth for the foreign-born population - Korea (%)
Place of birth for the foreign-born population - Other Eastern Asia (%)
Place of birth for the foreign-born population - Afghanistan (%)
Place of birth for the foreign-born population - Bangladesh (%)
Place of birth for the foreign-born population - India (%)
Place of birth for the foreign-born population - Iran (%)
Place of birth for the foreign-born population - Kazakhstan (%)
Place of birth for the foreign-born population - Nepal (%)
Place of birth for the foreign-born population - Pakistan (%)
Place of birth for the foreign-born population - Sri Lanka (%)
Place of birth for the foreign-born population - Uzbekistan (%)
Place of birth for the foreign-born population - Other South Central Asia (%)
Place of birth for the foreign-born population - Burma (%)
Place of birth for the foreign-born population - Cambodia (%)
Place of birth for the foreign-born population - Indonesia (%)
Place of birth for the foreign-born population - Laos (%)
Place of birth for the foreign-born population - Malaysia (%)
Place of birth for the foreign-born population - Philippines (%)
Place of birth for the foreign-born population - Singapore (%)
Place of birth for the foreign-born population - Thailand (%)
Place of birth for the foreign-born population - Vietnam (%)
Place of birth for the foreign-born population - Other South Eastern Asia (%)
Place of birth for the foreign-born population - Armenia (%)
Place of birth for the foreign-born population - Iraq (%)
Place of birth for the foreign-born population - Israel (%)
Place of birth for the foreign-born population - Jordan (%)
Place of birth for the foreign-born population - Kuwait (%)
Place of birth for the foreign-born population - Lebanon (%)
Place of birth for the foreign-born population - Saudi Arabia (%)
Place of birth for the foreign-born population - Syria (%)
Place of birth for the foreign-born population - Turkey (%)
Place of birth for the foreign-born population - Yemen (%)
Place of birth for the foreign-born population - Other Western Asia (%)
Place of birth for the foreign-born population - Eritrea (%)
Place of birth for the foreign-born population - Ethiopia (%)
Place of birth for the foreign-born population - Kenya (%)
Place of birth for the foreign-born population - Somalia (%)
Place of birth for the foreign-born population - Uganda (%)
Place of birth for the foreign-born population - Zimbabwe (%)
Place of birth for the foreign-born population - Other Eastern Africa (%)
Place of birth for the foreign-born population - Cameroon (%)
Place of birth for the foreign-born population - Congo (%)
Place of birth for the foreign-born population - Democratic Republic of Congo (Zaire) (%)
Place of birth for the foreign-born population - Other Middle Africa (%)
Place of birth for the foreign-born population - Egypt (%)
Place of birth for the foreign-born population - Morocco (%)
Place of birth for the foreign-born population - Sudan (%)
Place of birth for the foreign-born population - Other Northern Africa (%)
Place of birth for the foreign-born population - South Africa (%)
Place of birth for the foreign-born population - Other Southern Africa (%)
Place of birth for the foreign-born population - Cabo Verde (%)
Place of birth for the foreign-born population - Ghana (%)
Place of birth for the foreign-born population - Liberia (%)
Place of birth for the foreign-born population - Nigeria (%)
Place of birth for the foreign-born population - Senegal (%)
Place of birth for the foreign-born population - Sierra Leone (%)
Place of birth for the foreign-born population - Other Western Africa (%)
Place of birth for the foreign-born population - Australia (%)
Place of birth for the foreign-born population - New Zealand (%)
Place of birth for the foreign-born population - Fiji (%)
Place of birth for the foreign-born population - Micronesia (%)
Place of birth for the foreign-born population - Bahamas (%)
Place of birth for the foreign-born population - Barbados (%)
Place of birth for the foreign-born population - Cuba (%)
Place of birth for the foreign-born population - Dominica (%)
Place of birth for the foreign-born population - Dominican Republic (%)
Place of birth for the foreign-born population - Grenada (%)
Place of birth for the foreign-born population - Haiti (%)
Place of birth for the foreign-born population - Jamaica (%)
Place of birth for the foreign-born population - St. Vincent and the Grenadines (%)
Place of birth for the foreign-born population - Trinidad and Tobago (%)
Place of birth for the foreign-born population - West Indies (%)
Place of birth for the foreign-born population - Other Caribbean (%)
Place of birth for the foreign-born population - Belize (%)
Place of birth for the foreign-born population - Costa Rica (%)
Place of birth for the foreign-born population - El Salvador (%)
Place of birth for the foreign-born population - Guatemala (%)
Place of birth for the foreign-born population - Honduras (%)
Place of birth for the foreign-born population - Mexico (%)
Place of birth for the foreign-born population - Nicaragua (%)
Place of birth for the foreign-born population - Panama (%)
Place of birth for the foreign-born population - Other Central America (%)
Place of birth for the foreign-born population - Argentina (%)
Place of birth for the foreign-born population - Bolivia (%)
Place of birth for the foreign-born population - Brazil (%)
Place of birth for the foreign-born population - Chile (%)
Place of birth for the foreign-born population - Colombia (%)
Place of birth for the foreign-born population - Ecuador (%)
Place of birth for the foreign-born population - Guyana (%)
Place of birth for the foreign-born population - Peru (%)
Place of birth for the foreign-born population - Uruguay (%)
Place of birth for the foreign-born population - Venezuela (%)
Place of birth for the foreign-born population - Other South America (%)
Place of birth for the foreign-born population - Canada (%)
Place of birth for the foreign-born population - Other Northern America (%)
Place of birth for the foreign-born population - Other (%)
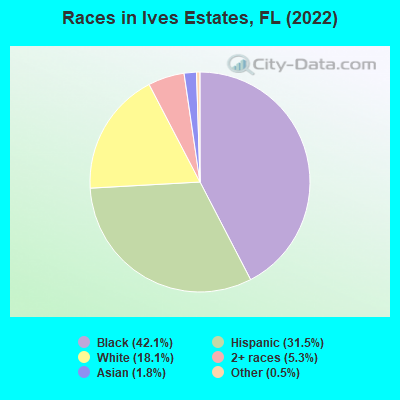
According to 2022 data, the most numerous races in Ives Estates, FL are White alone (4,838 residents), Hispanic (8,408 residents), and Black alone (11,239 residents). 43.9% of Ives Estates residents speak English at home. 50.0% of Ives Estates, FL residents are foreign-born (44.6% born in Latin America), which is 58.0% greater than the foreign-born rate of 21.0% across the entire state of Florida.
Race distribution in Ives Estates
2000 2022
10,458,509 65.4% White alone 2,682,715 16.8% Hispanic 2,264,268 14.2% Black alone 261,693 1.6% Asian alone 236,954 1.5% Two or more races 42,358 0.3% American Indian alone 28,994 0.2% Other race alone 6,887 0.04% Native Hawaiian and Other
11,309,403 50.8% White alone 6,025,039 27.1% Hispanic 3,241,015 14.6% Black alone 861,630 3.9% Two or more races 623,692 2.8% Asian alone 152,054 0.7% Other race alone 22,504 0.1% American Indian alone 9,486 0.04% Native Hawaiian and Other
Income and house value in Ives Estates Median household income in 2022 $79,797 White non-Hispanic householders$70,203 Black householders$134,076 Asian householders$82,610 Some other race householders$62,290 Two or more races householders$72,678 Hispanic or Latino race householdersMedian 2022 house value $406,104 White Non-Hispanic householders$368,161 Black or African American householders $381,685 Asian householders$326,837 Some other race householders$406,856 Two or more races householders$369,664 Hispanic or Latino householders
Median age by race in Ives Estates
36.3 Median age for White residents36.5 36.3 33.6 Median age for Black or African American residents27.3 38.6 -653,446,647.1 Median age for American Indian / Alaska Native residents-543,352,600.6 -762,696,213.5 38.6 Median age for Asian residents37.9 41.4 -679,849,340.2 Median age for Native Hawaiian / Pacific Islander residents-858,307,848.3 -443,298,968.6 37.2 Median age for Other race residents32.5 42.3 45.1 Median age for Two or more races residents45.1 46.5 36.3 Median age for White alone residents36.0 36.6 42.5 Median age for Hispanic or Latino residents41.8 43.6
Owner/renter occupied households by race in Ives Estates
House owners and renters - White residents 1,220 62.0% Owner occupied749 38.0% Renter occupiedHouse owners and renters - Black or African American residents 1,594 40.0% Owner occupied2,390 60.0% Renter occupiedHouse owners and renters - American Indian / Alaska Native residents 8 22.2% Owner occupied28 77.8% Renter occupiedHouse owners and renters - Asian residents 177 76.1% Owner occupied56 23.9% Renter occupiedHouse owners and renters - Other race residents 464 88.9% Owner occupied58 11.1% Renter occupiedHouse owners and renters - Two or more races residents 1,698 65.9% Owner occupied878 34.1% Renter occupiedHouse owners and renters - White alone residents 1,180 65.2% Owner occupied630 34.8% Renter occupiedHouse owners and renters - Hispanic or Latino residents 1,915 61.3% Owner occupied1,210 38.7% Renter occupied
Language usage in Ives Estates
English speakers - Total 43.9% of residents of Ives Estates speak English at home.
33.0% of residents speak Spanish at home 4,385 53.5% Speak English very well3,806 46.5% Speak English less than very well23.5% of residents speak other language at home 4,210 72.4% Speak English very well1,605 27.6% Speak English less than very well
English speakers - Born in the United States 66.0% of residents of Ives Estates speak English at home.
21.3% of residents speak Spanish at home 544 78.2% Speak English very well152 21.8% Speak English less than very well13.0% of residents speak other language at home 425 100.0% Speak English very well
English speakers - Native, born elsewhere 14.8% of residents of Ives Estates speak English at home.
81.4% of residents speak Spanish at home 380 77.6% Speak English very well110 22.4% Speak English less than very well0.8% of residents speak other language at home 5 100.0% Speak English very well
English speakers - Foreign-born 29.1% of residents of Ives Estates speak English at home.
42.4% of residents speak Spanish at home 2,241 39.7% Speak English very well3,399 60.3% Speak English less than very well29.3% of residents speak other language at home 2,392 61.2% Speak English very well1,514 38.8% Speak English less than very well
White (Caucasian) - Speak only English Native:
64.6% (1,964)Foreign-born:
12.2% (201)
White (Caucasian) - Speak another language Native:
38.7% (1,177)Foreign-born:
88.7% (1,465)
Black or African American - Speak only English Native:
74.7% (4,275)Foreign-born:
54.9% (2,603)
Black or African American - Speak another language Native:
25.3% (1,446)Foreign-born:
47.8% (2,266)
American Indian / Alaska Native - Speak another language Native:
100.0% (22)Foreign-born:
98.3% (11)
Asian - Speak only English Native:
84.4% (143)Foreign-born:
10.3% (33)
Asian - Speak another language Native:
17.0% (29)Foreign-born:
91.3% (291)
Other race - Speak another language Native:
90.0% (404)Foreign-born:
100.0% (918)
Two or more races - Speak only English Native:
35.2% (471)Foreign-born:
26.7% (1,437)
Two or more races - Speak another language Native:
64.4% (862)Foreign-born:
76.5% (4,116)
White alone - Speak only English Native:
73.5% (1,977)Foreign-born:
19.4% (279)
White alone - Speak another language Native:
26.3% (709)Foreign-born:
78.9% (1,136)
Hispanic or Latino - Speak only English Native:
13.7% (313)Foreign-born:
4.9% (279)
Hispanic or Latino - Speak another language Native:
86.2% (1,974)Foreign-born:
95.1% (5,395)
Foreign-born residents in Ives Estates 13,339 residents are foreign born (44.6% Latin America ).
This city:
50.0%Florida:
21.1%
Marital status for residents in Ives Estates Marital status - White (Caucasian) population 15 years and over
Males 29.3% Never married56.3% Now married3.7% Separated2.5% Widowed8.2% DivorcedFemales 21.1% Never married47.1% Now married2.2% Separated12.7% Widowed17.0% DivorcedWomen who gave birth in the past 12 months Now married:
100.0% (10)Unmarried:
0.0% (0)
Women who did not give birth in the past 12 months Now married:
61.4% (612)Unmarried:
38.6% (385)
Marital status - Black or African American population 15 years and over
Males 49.7% Never married36.7% Now married4.3% Separated2.7% Widowed6.5% DivorcedFemales 53.6% Never married19.6% Now married3.3% Separated3.1% Widowed20.4% DivorcedWomen who gave birth in the past 12 months Now married:
48.8% (76)Unmarried:
51.2% (80)
Women who did not give birth in the past 12 months Now married:
19.8% (634)Unmarried:
80.2% (2,577)
Marital status - American Indian / Alaska Native population 15 years and over
Males 0.0% Never married100.0% Now married0.0% Separated0.0% Widowed0.0% DivorcedFemales 0.0% Never married0.0% Now married100.0% Separated0.0% Widowed0.0% DivorcedMarital status - Asian population 15 years and over
Males 45.2% Never married46.7% Now married0.0% Separated0.0% Widowed8.1% DivorcedFemales 51.9% Never married38.3% Now married0.0% Separated3.3% Widowed6.5% DivorcedWomen who did not give birth in the past 12 months Now married:
33.9% (67)Unmarried:
66.1% (130)
Marital status - Other race population 15 years and over
Males 36.0% Never married60.1% Now married0.0% Separated0.0% Widowed3.9% DivorcedFemales 25.0% Never married41.3% Now married0.0% Separated4.7% Widowed29.1% DivorcedWomen who gave birth in the past 12 months Now married:
100.0% (45)Unmarried:
0.0% (0)
Women who did not give birth in the past 12 months Now married:
31.9% (103)Unmarried:
68.1% (220)
Marital status - Two or more races population 15 years and over
Males 48.6% Never married45.0% Now married0.0% Separated0.0% Widowed6.3% DivorcedFemales 29.1% Never married48.2% Now married1.1% Separated5.3% Widowed16.4% DivorcedWomen who did not give birth in the past 12 months Now married:
47.7% (734)Unmarried:
52.3% (804)
Marital status - White alone, not Hispanic / Latino population 15 years and over
Males 28.3% Never married51.9% Now married6.4% Separated3.4% Widowed10.0% DivorcedFemales 25.6% Never married36.9% Now married0.0% Separated17.2% Widowed20.2% DivorcedWomen who did not give birth in the past 12 months Now married:
55.2% (528)Unmarried:
44.8% (428)
Marital status - Hispanic or Latino population 15 years and over
Males 35.8% Never married59.1% Now married0.5% Separated0.7% Widowed3.9% DivorcedFemales 24.6% Never married52.6% Now married3.0% Separated6.4% Widowed13.4% DivorcedWomen who gave birth in the past 12 months Now married:
100.0% (49)Unmarried:
0.0% (0)
Women who did not give birth in the past 12 months Now married:
52.4% (974)Unmarried:
47.6% (886)
Ancestries in Ives Estates
3,374 19.4% Haitian1,927 11.1% Jamaican838 4.8% American369 2.1% Brazilian218 1.3% Italian201 1.2% Turkish183 1.1% English181 1.0% German169 1.0% Romanian145 0.8% Lebanese128 0.7% Russian90 0.5% European80 0.5% Ukrainian78 0.4% Nigerian76 0.4% Moroccan62 0.4% Polish60 0.3% French57 0.3% Trinidadian and Tobagonian55 0.3% Bahamian54 0.3% Israeli50 0.3% West Indian41 0.2% Belizean37 0.2% African36 0.2% Jordanian30 0.2% Zimbabwean27 0.2% Czech27 0.2% Scottish20 0.1% Palestinian15 0.09% British West Indian15 0.09% Egyptian13 0.07% Norwegian9 0.05% Irish6 0.03% Dutch5 0.03% Slovak5 0.03% Canadian5 0.03% British
Geographical mobility in Ives Estates Same house 1 year ago 4,411 86.7% White (Caucasian)10,001 91.9% Black or African American36 100.0% American Indian / Alaska Native505 98.9% Asian1,126 76.5% Other race6,287 90.5% Two or more races4,353 90.4% White alone, not Hispanic / Latino7,143 85.2% Hispanic or LatinoMoved within same county 467 9.2% White / Caucasian411 3.8% Black or African American460 6.6% Two or more races242 5.0% White alone, not Hispanic / Latino780 9.3% Hispanic or LatinoMoved within same state 15 0.3% White / Caucasian144 1.3% Black or African American124 8.5% Other race27 0.4% Two or more races18 0.4% White alone, not Hispanic / Latino215 2.6% Hispanic or LatinoMoved from different state 170 3.3% White / Caucasian331 3.0% Black or African American24 4.7% Asian71 4.8% Other race16 0.2% Two or more races192 4.0% White alone, not Hispanic / Latino29 0.3% Hispanic or LatinoMoved from abroad 31 2.1% Other race109 1.6% Two or more races91 1.1% Hispanic or Latino
Children Nativity (place of birth) in Ives Estates
Children under 6 years - Living with two parents Both parents native 134 100.0% NativeBoth parents foreign-born 789 100.0% NativeOne native, one foreign-born parent 594 100.0% NativeChildren under 6 years - Living with one parent Native parent 244 100.0% NativeForeign-born parent 170 100.0% NativeChildren 6 to 17 years - Living with two parents Both parents native 339 97.9% Native7 2.1% Foreign-bornBoth parents foreign-born 638 67.4% Native309 32.6% Foreign-bornOne native, one foreign-born parent 441 100.0% NativeChildren 6 to 17 years - Living with one parent Native parent 546 100.0% NativeForeign-born parent 928 51.5% Native875 48.5% Foreign-born
Grandparents responsible for own grandchildren in Ives Estates
Grandparents (30 to 59 years) White / Caucasian 8 46.8% Responsible for grandchildren9 53.2% Not responsible for grandchildrenBlack or African American 94 87.3% Responsible for grandchildren14 12.7% Not responsible for grandchildrenOther race 50 100.0% Not responsible for grandchildrenWhite alone, not Hispanic / Latino 28 100.0% Responsible for grandchildrenHispanic or Latino 49 100.0% Not responsible for grandchildrenGrandparents (60 years and over) White / Caucasian 53 20.4% Responsible for grandchildren208 79.6% Not responsible for grandchildrenBlack or African American 83 60.9% Responsible for grandchildren54 39.1% Not responsible for grandchildrenWhite alone, not Hispanic / Latino 26 11.5% Responsible for grandchildren203 88.5% Not responsible for grandchildrenHispanic or Latino 64 35.6% Responsible for grandchildren115 64.4% Not responsible for grandchildren