Races in Jamestown district, Virginia (VA) Detailed Stats
Ancestries, Foreign-born residents, place of birth
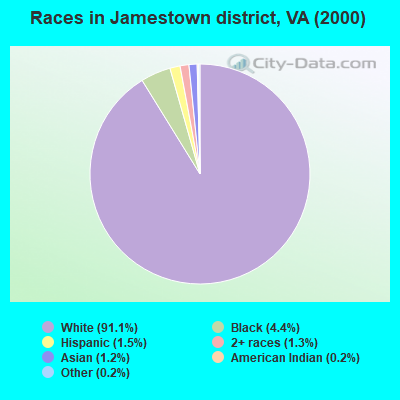
Race distribution in Jamestown district

- 8,59891.1%White alone
- 4184.4%Black alone
- 1451.5%Hispanic
- 1201.3%Two or more races
- 1161.2%Asian alone
- 160.2%Other race alone
- 210.2%American Indian alone
- 40.04%Native Hawaiian and Other
Pacific Islander alone
2000
2022
-
- 4,965,63770.2%White alone
- 1,376,37819.4%Black alone
- 329,5404.7%Hispanic
- 259,2773.7%Asian alone
- 114,0221.6%Two or more races
- 18,5960.3%American Indian alone
- 11,6850.2%Other race alone
- 3,3800.05%Native Hawaiian and Other
Pacific Islander alone

-
- 5,095,13058.7%White alone
- 1,594,78518.4%Black alone
- 905,75010.4%Hispanic
- 602,8816.9%Asian alone
- 406,0474.7%Two or more races
- 60,4190.7%Other race alone
- 11,7380.1%American Indian alone
- 6,8690.08%Native Hawaiian and Other
Pacific Islander alone

Income and house value in Jamestown district
- Median household income in 2022
- $117,967White non-Hispanic householders
- $69,487Black householders
- $29,355Asian householders
- over $200,000Some other race householders
- $49,356Two or more races householders
- $92,472Hispanic or Latino race householders
- Median 2022 house value
- $472,078White Non-Hispanic householders
- $243,603Black or African American householders
- $166,676American Indian or Alaska Native householders
- $457,974Asian householders
- $352,584Some other race householders
- $349,763Two or more races householders
- $422,075Hispanic or Latino householders
Household income for White non-Hispanic householders

Household income for Black householders

Household income for American Indian and Alaska Native householders

Household income for Asian householders

Household income for Two or more races householders

Household income for Hispanic or Latino race householders

Zip code: 23185