Races in Kalamazoo, Michigan (MI) Detailed Stats
Data:
Races - White alone (%)
Races - White alone (% change since 2000)
Races - Black alone (%)
Races - Black alone (% change since 2000)
Races - American Indian alone (%)
Races - American Indian alone (% change since 2000)
Races - Asian alone (%)
Races - Asian alone (% change since 2000)
Races - Hispanic (%)
Races - Hispanic (% change since 2000)
Races - Native Hawaiian and Other Pacific Islander alone (%)
Races - Native Hawaiian and Other Pacific Islander alone (% change since 2000)
Races - Two or more races(%)
Races - Two or more races(% change since 2000)
Races - Other race alone (%)
Races - Other race alone (% change since 2000)
Racial diversity
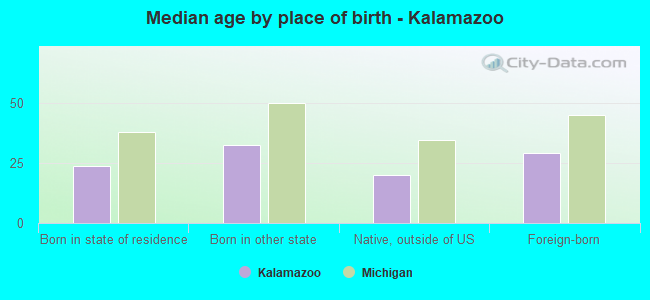
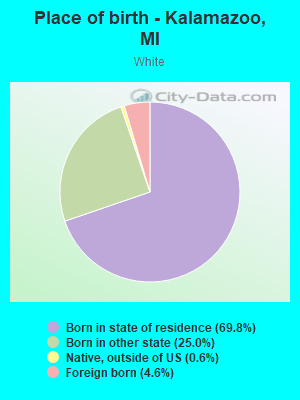
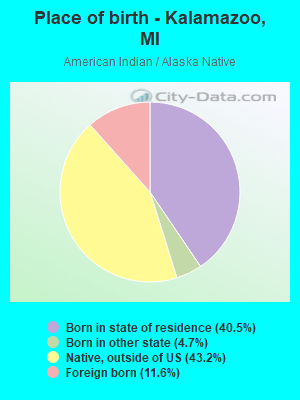
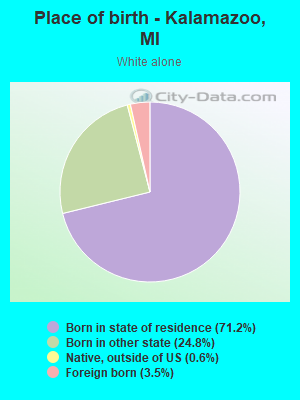
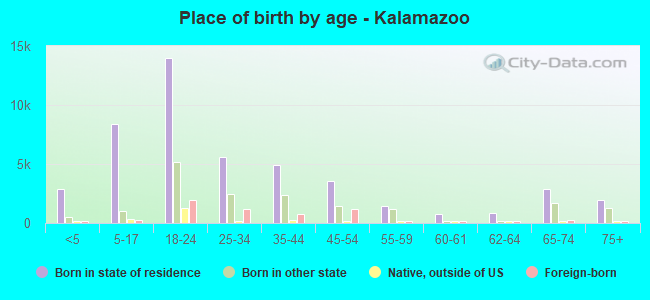
Place of birth - Born in state of residence (%)
Place of birth - Born in state of residence (%) - White
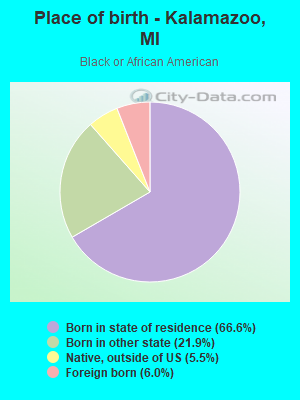
Place of birth - Born in state of residence (%) - Black or African American
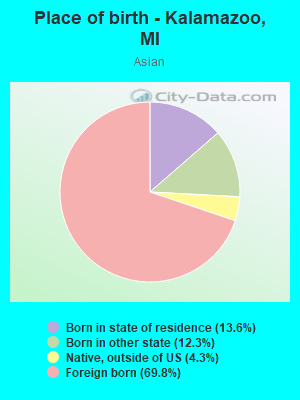
Place of birth - Born in state of residence (%) - Asian
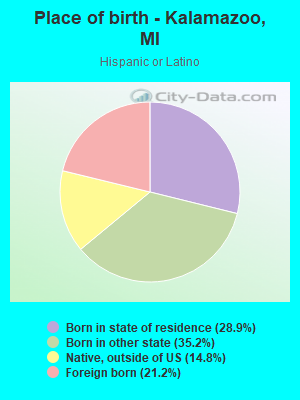
Place of birth - Born in state of residence (%) - Hispanic or Latino
Place of birth - Born in state of residence (%) - American Indian and Alaska Native
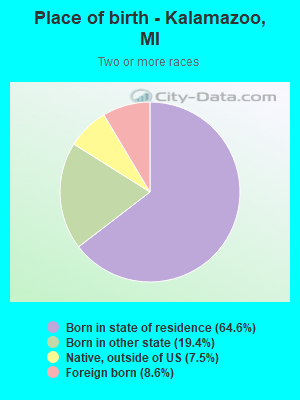
Place of birth - Born in state of residence (%) - Multirace
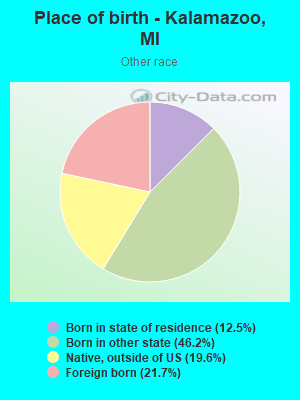
Place of birth - Born in state of residence (%) - Other Race
Place of birth - Born in other state (%)
Place of birth - Born in other state (%) - White
Place of birth - Born in other state (%) - Black or African American
Place of birth - Born in other state (%) - Asian
Place of birth - Born in other state (%) - Hispanic or Latino
Place of birth - Born in other state (%) - American Indian and Alaska Native
Place of birth - Born in other state (%) - Multirace
Place of birth - Born in other state (%) - Other Race
Place of birth - Native, outside of US (%)
Place of birth - Native, outside of US (%) - White
Place of birth - Native, outside of US (%) - Black or African American
Place of birth - Native, outside of US (%) - Asian
Place of birth - Native, outside of US (%) - Hispanic or Latino
Place of birth - Native, outside of US (%) - American Indian and Alaska Native
Place of birth - Native, outside of US (%) - Multirace
Place of birth - Native, outside of US (%) - Other Race
Place of birth - Foreign born (%)
Place of birth - Foreign born (%) - White
Place of birth - Foreign born (%) - Black or African American
Place of birth - Foreign born (%) - Asian
Place of birth - Foreign born (%) - Hispanic or Latino
Place of birth - Foreign born (%) - American Indian and Alaska Native
Place of birth - Foreign born (%) - Multirace
Place of birth - Foreign born (%) - Other Race
Residents speaking English at home (%)
Residents speaking English at home - Born in the United States (%)
Residents speaking English at home - Native, born elsewhere (%)
Residents speaking English at home - Foreign born (%)
Residents speaking Spanish at home (%)
Residents speaking Spanish at home - Born in the United States (%)
Residents speaking Spanish at home - Native, born elsewhere (%)
Residents speaking Spanish at home - Foreign born (%)
Residents speaking other language at home (%)
Residents speaking other language at home - Born in the United States (%)
Residents speaking other language at home - Native, born elsewhere (%)
Residents speaking other language at home - Foreign born (%)
Marital status - Never married (%)
Marital status - Now married (%)
Marital status - Separated (%)
Marital status - Widowed (%)
Marital status - Divorced (%)
Ancestries Reported - Arab (%)
Ancestries Reported - Czech (%)
Ancestries Reported - Danish (%)
Ancestries Reported - Dutch (%)
Ancestries Reported - English (%)
Ancestries Reported - French (%)
Ancestries Reported - French Canadian (%)
Ancestries Reported - German (%)
Ancestries Reported - Greek (%)
Ancestries Reported - Hungarian (%)
Ancestries Reported - Irish (%)
Ancestries Reported - Italian (%)
Ancestries Reported - Lithuanian (%)
Ancestries Reported - Norwegian (%)
Ancestries Reported - Polish (%)
Ancestries Reported - Portuguese (%)
Ancestries Reported - Russian (%)
Ancestries Reported - Scotch-Irish (%)
Ancestries Reported - Scottish (%)
Ancestries Reported - Slovak (%)
Ancestries Reported - Subsaharan African (%)
Ancestries Reported - Swedish (%)
Ancestries Reported - Swiss (%)
Ancestries Reported - Ukrainian (%)
Ancestries Reported - United States (%)
Ancestries Reported - Welsh (%)
Ancestries Reported - West Indian (%)
Ancestries Reported - Other (%)
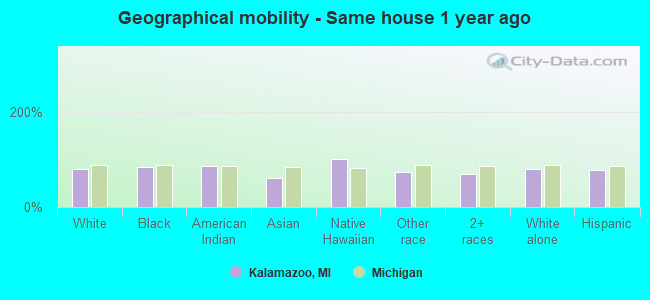
Geographical mobility - Same house 1 year ago (%)
Geographical mobility - Same house 1 year ago (%) - White
Geographical mobility - Same house 1 year ago (%) - Black or African American
Geographical mobility - Same house 1 year ago (%) - Asian
Geographical mobility - Same house 1 year ago (%) - Hispanic or Latino
Geographical mobility - Same house 1 year ago (%) - American Indian and Alaska Native
Geographical mobility - Same house 1 year ago (%) - Multirace
Geographical mobility - Same house 1 year ago (%) - Other Race
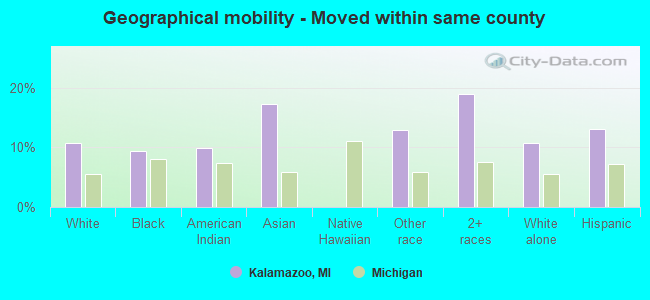
Geographical mobility - Moved within same county (%)
Geographical mobility - Moved within same county (%) - White
Geographical mobility - Moved within same county (%) - Black or African American
Geographical mobility - Moved within same county (%) - Asian
Geographical mobility - Moved within same county (%) - Hispanic or Latino
Geographical mobility - Moved within same county (%) - American Indian and Alaska Native
Geographical mobility - Moved within same county (%) - Multirace
Geographical mobility - Moved within same county (%) - Other Race
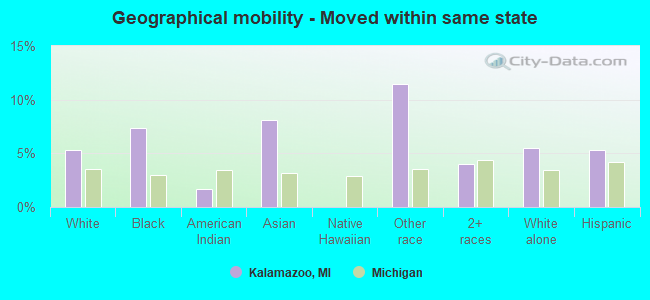
Geographical mobility - Moved from different county within same state (%)
Geographical mobility - Moved from different county within same state (%) - White
Geographical mobility - Moved from different county within same state (%) - Black or African American
Geographical mobility - Moved from different county within same state (%) - Asian
Geographical mobility - Moved from different county within same state (%) - Hispanic or Latino
Geographical mobility - Moved from different county within same state (%) - American Indian and Alaska Native
Geographical mobility - Moved from different county within same state (%) - Multirace
Geographical mobility - Moved from different county within same state (%) - Other Race
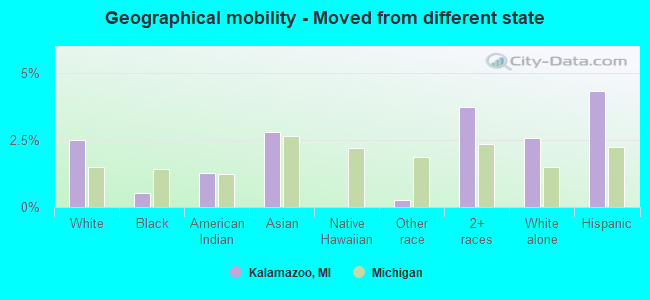
Geographical mobility - Moved from different state (%)
Geographical mobility - Moved from different state (%) - White
Geographical mobility - Moved from different state (%) - Black or African American
Geographical mobility - Moved from different state (%) - Asian
Geographical mobility - Moved from different state (%) - Hispanic or Latino
Geographical mobility - Moved from different state (%) - American Indian and Alaska Native
Geographical mobility - Moved from different state (%) - Multirace
Geographical mobility - Moved from different state (%) - Other Race
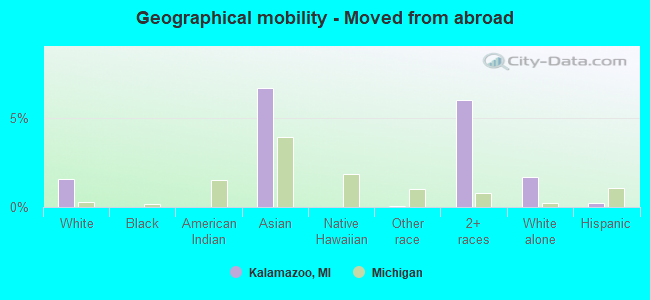
Geographical mobility - Moved from abroad (%)
Geographical mobility - Moved from abroad (%) - White
Geographical mobility - Moved from abroad (%) - Black or African American
Geographical mobility - Moved from abroad (%) - Asian
Geographical mobility - Moved from abroad (%) - Hispanic or Latino
Geographical mobility - Moved from abroad (%) - American Indian and Alaska Native
Geographical mobility - Moved from abroad (%) - Multirace
Geographical mobility - Moved from abroad (%) - Other Race
Place of birth for the foreign-born population - Ireland (%)
Place of birth for the foreign-born population - Denmark (%)
Place of birth for the foreign-born population - Norway (%)
Place of birth for the foreign-born population - Sweden (%)
Place of birth for the foreign-born population - United Kingdom (%)
Place of birth for the foreign-born population - England (%)
Place of birth for the foreign-born population - Scotland (%)
Place of birth for the foreign-born population - Other Northern Europe (%)
Place of birth for the foreign-born population - Austria (%)
Place of birth for the foreign-born population - Belgium (%)
Place of birth for the foreign-born population - France (%)
Place of birth for the foreign-born population - Germany (%)
Place of birth for the foreign-born population - Netherlands (%)
Place of birth for the foreign-born population - Switzerland (%)
Place of birth for the foreign-born population - Other Western Europe (%)
Place of birth for the foreign-born population - Greece (%)
Place of birth for the foreign-born population - Italy (%)
Place of birth for the foreign-born population - Portugal (%)
Place of birth for the foreign-born population - Spain (%)
Place of birth for the foreign-born population - Other Southern Europe (%)
Place of birth for the foreign-born population - Albania (%)
Place of birth for the foreign-born population - Belarus (%)
Place of birth for the foreign-born population - Bosnia and Herzegovina (%)
Place of birth for the foreign-born population - Bulgaria (%)
Place of birth for the foreign-born population - Croatia (%)
Place of birth for the foreign-born population - Czechoslovakia (%)
Place of birth for the foreign-born population - Hungary (%)
Place of birth for the foreign-born population - Latvia (%)
Place of birth for the foreign-born population - Lithuania (%)
Place of birth for the foreign-born population - North Macedonia (Macedonia) (%)
Place of birth for the foreign-born population - Moldova (%)
Place of birth for the foreign-born population - Poland (%)
Place of birth for the foreign-born population - Romania (%)
Place of birth for the foreign-born population - Russia (%)
Place of birth for the foreign-born population - Serbia (%)
Place of birth for the foreign-born population - Ukraine (%)
Place of birth for the foreign-born population - Other Eastern Europe (%)
Place of birth for the foreign-born population - China (%)
Place of birth for the foreign-born population - Hong Kong (%)
Place of birth for the foreign-born population - Taiwan (%)
Place of birth for the foreign-born population - Japan (%)
Place of birth for the foreign-born population - Korea (%)
Place of birth for the foreign-born population - Other Eastern Asia (%)
Place of birth for the foreign-born population - Afghanistan (%)
Place of birth for the foreign-born population - Bangladesh (%)
Place of birth for the foreign-born population - India (%)
Place of birth for the foreign-born population - Iran (%)
Place of birth for the foreign-born population - Kazakhstan (%)
Place of birth for the foreign-born population - Nepal (%)
Place of birth for the foreign-born population - Pakistan (%)
Place of birth for the foreign-born population - Sri Lanka (%)
Place of birth for the foreign-born population - Uzbekistan (%)
Place of birth for the foreign-born population - Other South Central Asia (%)
Place of birth for the foreign-born population - Burma (%)
Place of birth for the foreign-born population - Cambodia (%)
Place of birth for the foreign-born population - Indonesia (%)
Place of birth for the foreign-born population - Laos (%)
Place of birth for the foreign-born population - Malaysia (%)
Place of birth for the foreign-born population - Philippines (%)
Place of birth for the foreign-born population - Singapore (%)
Place of birth for the foreign-born population - Thailand (%)
Place of birth for the foreign-born population - Vietnam (%)
Place of birth for the foreign-born population - Other South Eastern Asia (%)
Place of birth for the foreign-born population - Armenia (%)
Place of birth for the foreign-born population - Iraq (%)
Place of birth for the foreign-born population - Israel (%)
Place of birth for the foreign-born population - Jordan (%)
Place of birth for the foreign-born population - Kuwait (%)
Place of birth for the foreign-born population - Lebanon (%)
Place of birth for the foreign-born population - Saudi Arabia (%)
Place of birth for the foreign-born population - Syria (%)
Place of birth for the foreign-born population - Turkey (%)
Place of birth for the foreign-born population - Yemen (%)
Place of birth for the foreign-born population - Other Western Asia (%)
Place of birth for the foreign-born population - Eritrea (%)
Place of birth for the foreign-born population - Ethiopia (%)
Place of birth for the foreign-born population - Kenya (%)
Place of birth for the foreign-born population - Somalia (%)
Place of birth for the foreign-born population - Uganda (%)
Place of birth for the foreign-born population - Zimbabwe (%)
Place of birth for the foreign-born population - Other Eastern Africa (%)
Place of birth for the foreign-born population - Cameroon (%)
Place of birth for the foreign-born population - Congo (%)
Place of birth for the foreign-born population - Democratic Republic of Congo (Zaire) (%)
Place of birth for the foreign-born population - Other Middle Africa (%)
Place of birth for the foreign-born population - Egypt (%)
Place of birth for the foreign-born population - Morocco (%)
Place of birth for the foreign-born population - Sudan (%)
Place of birth for the foreign-born population - Other Northern Africa (%)
Place of birth for the foreign-born population - South Africa (%)
Place of birth for the foreign-born population - Other Southern Africa (%)
Place of birth for the foreign-born population - Cabo Verde (%)
Place of birth for the foreign-born population - Ghana (%)
Place of birth for the foreign-born population - Liberia (%)
Place of birth for the foreign-born population - Nigeria (%)
Place of birth for the foreign-born population - Senegal (%)
Place of birth for the foreign-born population - Sierra Leone (%)
Place of birth for the foreign-born population - Other Western Africa (%)
Place of birth for the foreign-born population - Australia (%)
Place of birth for the foreign-born population - New Zealand (%)
Place of birth for the foreign-born population - Fiji (%)
Place of birth for the foreign-born population - Micronesia (%)
Place of birth for the foreign-born population - Bahamas (%)
Place of birth for the foreign-born population - Barbados (%)
Place of birth for the foreign-born population - Cuba (%)
Place of birth for the foreign-born population - Dominica (%)
Place of birth for the foreign-born population - Dominican Republic (%)
Place of birth for the foreign-born population - Grenada (%)
Place of birth for the foreign-born population - Haiti (%)
Place of birth for the foreign-born population - Jamaica (%)
Place of birth for the foreign-born population - St. Vincent and the Grenadines (%)
Place of birth for the foreign-born population - Trinidad and Tobago (%)
Place of birth for the foreign-born population - West Indies (%)
Place of birth for the foreign-born population - Other Caribbean (%)
Place of birth for the foreign-born population - Belize (%)
Place of birth for the foreign-born population - Costa Rica (%)
Place of birth for the foreign-born population - El Salvador (%)
Place of birth for the foreign-born population - Guatemala (%)
Place of birth for the foreign-born population - Honduras (%)
Place of birth for the foreign-born population - Mexico (%)
Place of birth for the foreign-born population - Nicaragua (%)
Place of birth for the foreign-born population - Panama (%)
Place of birth for the foreign-born population - Other Central America (%)
Place of birth for the foreign-born population - Argentina (%)
Place of birth for the foreign-born population - Bolivia (%)
Place of birth for the foreign-born population - Brazil (%)
Place of birth for the foreign-born population - Chile (%)
Place of birth for the foreign-born population - Colombia (%)
Place of birth for the foreign-born population - Ecuador (%)
Place of birth for the foreign-born population - Guyana (%)
Place of birth for the foreign-born population - Peru (%)
Place of birth for the foreign-born population - Uruguay (%)
Place of birth for the foreign-born population - Venezuela (%)
Place of birth for the foreign-born population - Other South America (%)
Place of birth for the foreign-born population - Canada (%)
Place of birth for the foreign-born population - Other Northern America (%)
Place of birth for the foreign-born population - Other (%)
Latest news about races in Kalamazoo, MI collected exclusively by city-data.com from local newspapers, TV, and radio stations
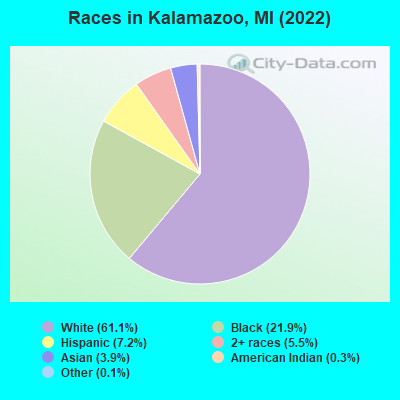
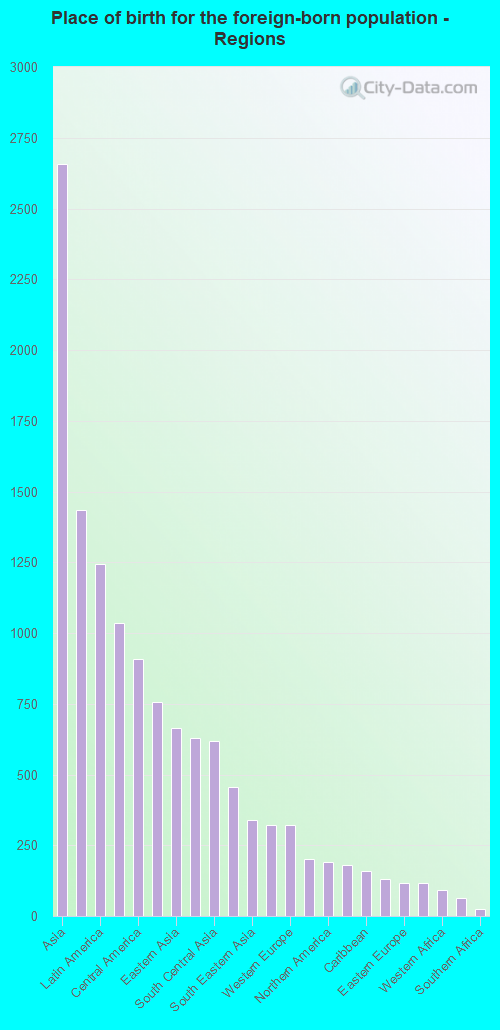
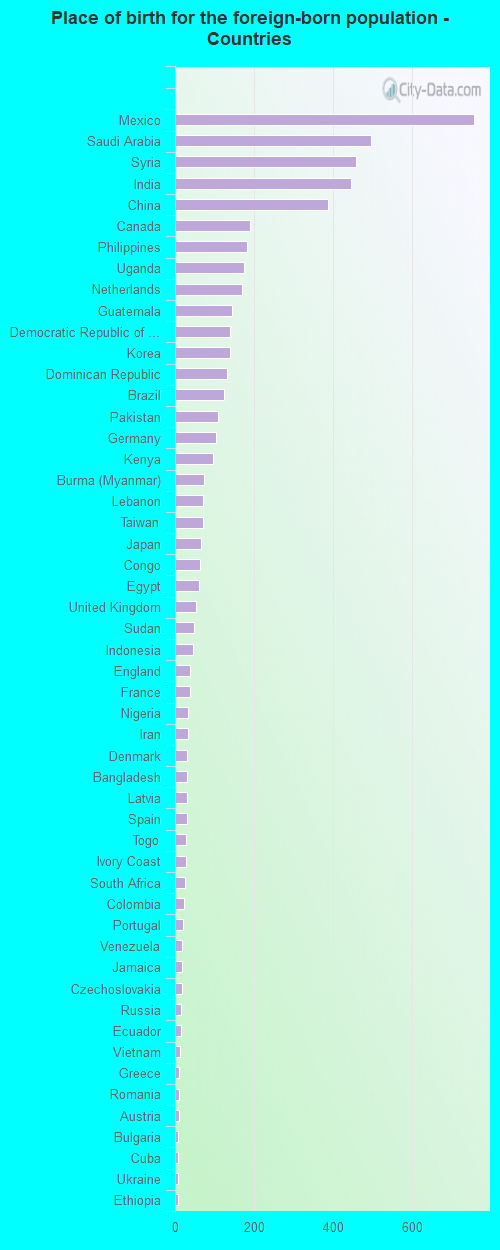
According to 2022 data, the most numerous races in Kalamazoo, MI are White alone (44,498 residents), Black alone (15,962 residents), and Hispanic (5,277 residents). 88.3% of Kalamazoo residents speak English at home. 7.5% of Kalamazoo, MI residents are foreign-born (3.6% born in Asia, 1.7% born in Latin America, 1.0% born in Africa, 0.9% born in Europe), which is 19.8% greater than the foreign-born rate of 6.0% across the entire state of Michigan.
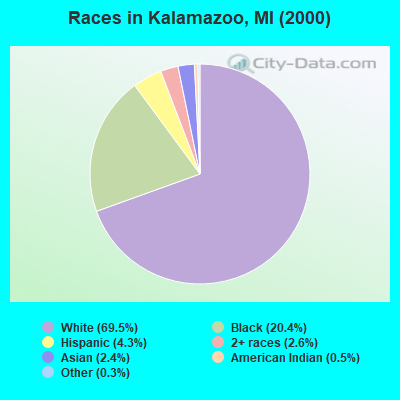
Race distribution in Kalamazoo
2000 2022
53,589 69.5% White alone 15,757 20.4% Black alone 3,304 4.3% Hispanic 2,013 2.6% Two or more races 1,839 2.4% Asian alone 403 0.5% American Indian alone 197 0.3% Other race alone 43 0.06% Native Hawaiian and Other
44,498 61.1% White alone 15,962 21.9% Black alone 5,277 7.2% Hispanic 3,978 5.5% Two or more races 2,851 3.9% Asian alone 241 0.3% American Indian alone 76 0.1% Other race alone
2000 2022
7,806,691 78.6% White alone 1,402,047 14.1% Black alone 323,877 3.3% Hispanic 175,311 1.8% Asian alone 163,487 1.6% Two or more races 53,421 0.5% American Indian alone 11,465 0.1% Other race alone 2,145 0.02% Native Hawaiian and Other
7,289,051 72.6% White alone 1,310,464 13.1% Black alone 572,405 5.7% Hispanic 450,031 4.5% Two or more races 335,732 3.3% Asian alone 45,217 0.5% Other race alone 29,011 0.3% American Indian alone 2,207 0.02% Native Hawaiian and Other
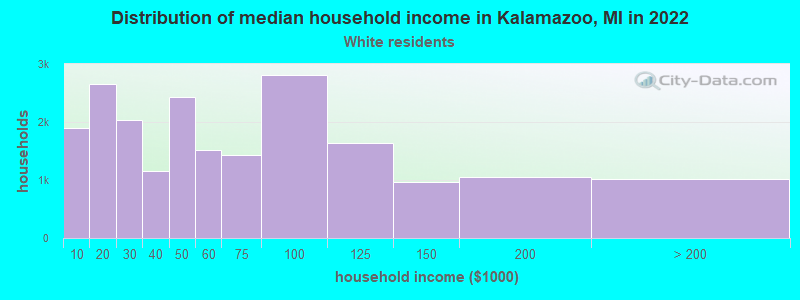
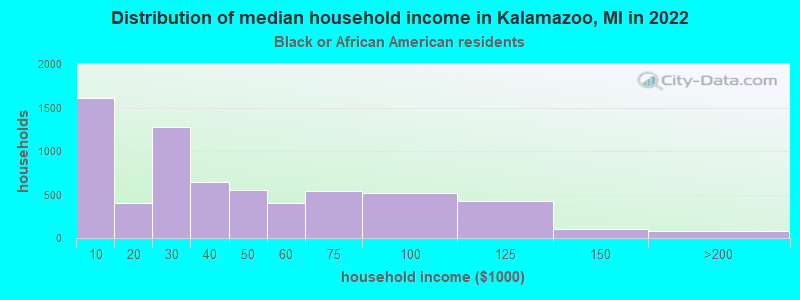
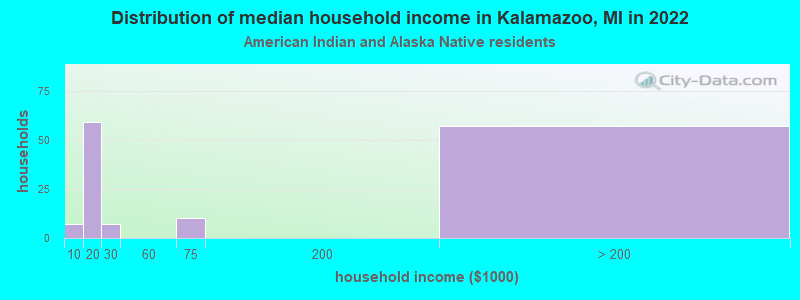
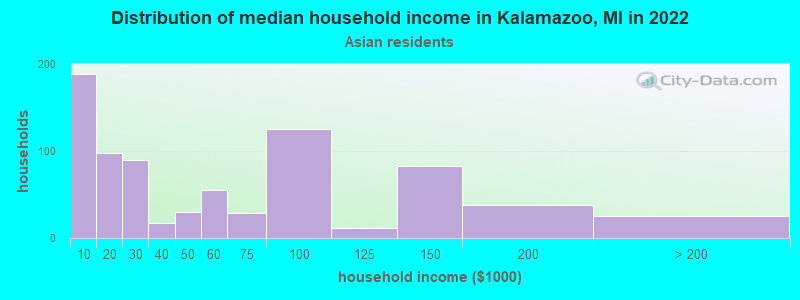
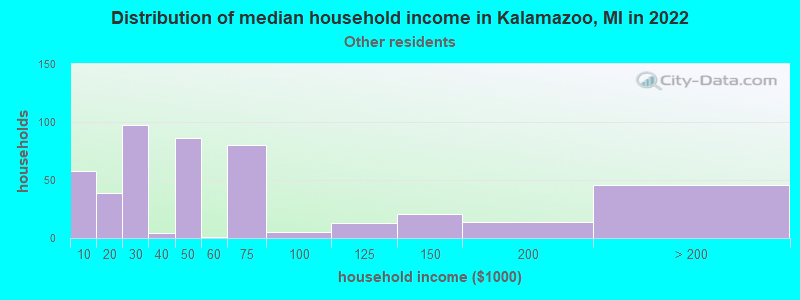
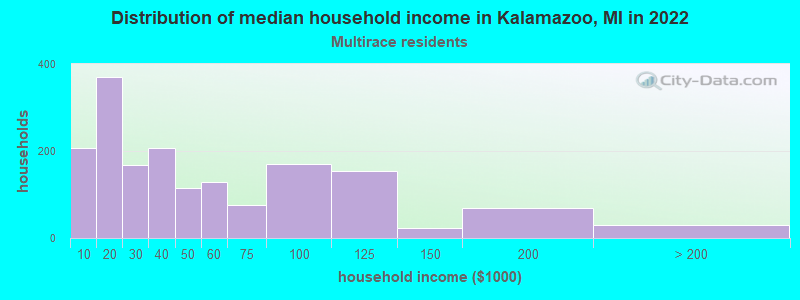
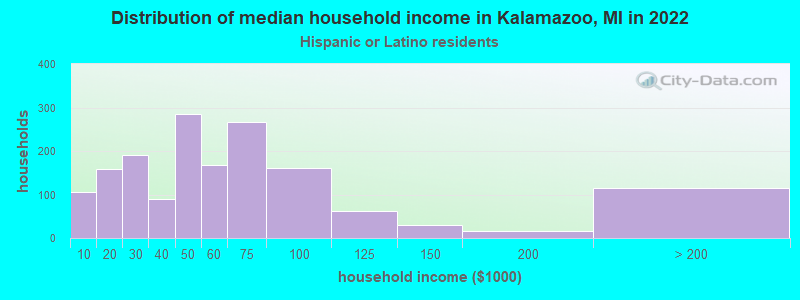
Income and house value in Kalamazoo Median household income in 2022 $51,310 White non-Hispanic householders$29,797 Black householders$43,371 Asian householders$47,309 Some other race householders$42,029 Two or more races householders$48,433 Hispanic or Latino race householdersMedian 2022 house value $185,908 White Non-Hispanic householders$120,566 Black or African American householders$163,144 American Indian or Alaska Native householders $407,017 Asian householders$109,816 Some other race householders$128,576 Two or more races householders$125,625 Hispanic or Latino householders
Median age by race in Kalamazoo
26.9 Median age for White residents26.1 28.0 23.3 Median age for Black or African American residents21.0 27.6 61.1 Median age for American Indian / Alaska Native residents55.7 61.4 25.1 Median age for Asian residents25.6 24.2 -666,666,666.0 Median age for Native Hawaiian / Pacific Islander residents-666,666,666.0 -666,666,666.0 39.9 Median age for Other race residents29.6 41.4 22.8 Median age for Two or more races residents19.5 25.0 27.9 Median age for White alone residents26.6 28.9 24.3 Median age for Hispanic or Latino residents24.3 23.9
Owner/renter occupied households by race in Kalamazoo
House owners and renters - White residents 9,504 46.1% Owner occupied11,107 53.9% Renter occupiedHouse owners and renters - Black or African American residents 1,891 28.9% Owner occupied4,661 71.1% Renter occupiedHouse owners and renters - American Indian / Alaska Native residents 68 55.9% Owner occupied54 44.1% Renter occupiedHouse owners and renters - Asian residents 237 19.3% Owner occupied990 80.7% Renter occupiedHouse owners and renters - Other race residents 216 26.4% Owner occupied602 73.6% Renter occupiedHouse owners and renters - Two or more races residents 639 37.6% Owner occupied1,061 62.4% Renter occupiedHouse owners and renters - White alone residents 9,436 48.0% Owner occupied10,238 52.0% Renter occupiedHouse owners and renters - Hispanic or Latino residents 496 19.6% Owner occupied2,035 80.4% Renter occupied
Language usage in Kalamazoo
English speakers - Total 88.3% of residents of Kalamazoo speak English at home.
3.7% of residents speak Spanish at home 2,147 83.6% Speak English very well420 16.4% Speak English less than very well8.0% of residents speak other language at home 4,343 78.3% Speak English very well1,206 21.7% Speak English less than very well
English speakers - Born in the United States 91.3% of residents of Kalamazoo speak English at home.
5.2% of residents speak Spanish at home 866 98.9% Speak English very well10 1.1% Speak English less than very well3.4% of residents speak other language at home 468 81.8% Speak English very well104 18.2% Speak English less than very well
English speakers - Native, born elsewhere 37.8% of residents of Kalamazoo speak English at home.
21.9% of residents speak Spanish at home 486 100.0% Speak English very well40.3% of residents speak other language at home 893 100.0% Speak English very well
English speakers - Foreign-born 30.4% of residents of Kalamazoo speak English at home.
9.3% of residents speak Spanish at home 216 37.2% Speak English very well364 62.8% Speak English less than very well60.2% of residents speak other language at home 2,640 70.6% Speak English very well1,102 29.4% Speak English less than very well
White (Caucasian) - Speak only English Native:
97.6% (41,549)Foreign-born:
46.1% (980)
White (Caucasian) - Speak another language Native:
2.4% (1,003)Foreign-born:
53.9% (1,148)
Black or African American - Speak only English Native:
91.1% (12,779)Foreign-born:
36.1% (346)
Black or African American - Speak another language Native:
8.9% (1,244)Foreign-born:
63.9% (612)
American Indian / Alaska Native - Speak another language Native:
63.0% (236)Foreign-born:
100.0% (54)
Asian - Speak only English Native:
55.2% (307)Foreign-born:
22.6% (502)
Asian - Speak another language Native:
44.8% (249)Foreign-born:
77.4% (1,722)
Other race - Speak only English Native:
52.1% (513)Foreign-born:
5.8% (17)
Other race - Speak another language Native:
48.9% (482)Foreign-born:
100.0% (295)
Two or more races - Speak only English Native:
87.6% (5,103)Foreign-born:
13.8% (74)
Two or more races - Speak another language Native:
8.0% (468)Foreign-born:
86.2% (464)
White alone - Speak only English Native:
98.6% (40,812)Foreign-born:
32.6% (505)
White alone - Speak another language Native:
1.4% (597)Foreign-born:
67.4% (1,046)
Hispanic or Latino - Speak only English Native:
58.1% (2,360)Foreign-born:
48.1% (538)
Hispanic or Latino - Speak another language Native:
41.9% (1,704)Foreign-born:
51.9% (580)
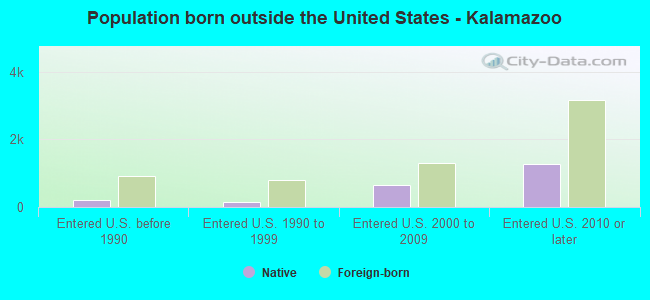
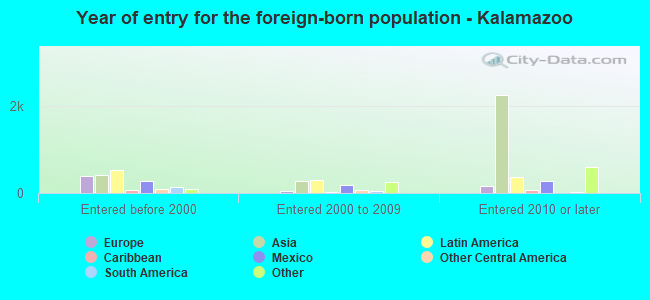
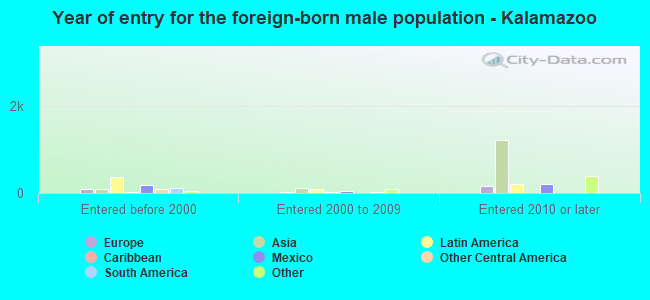
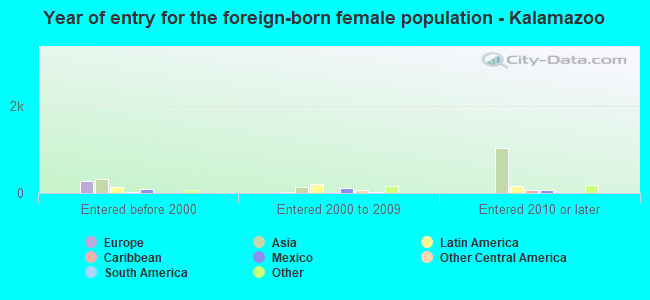
Foreign-born residents in Kalamazoo 5,483 residents are foreign born (3.6% Asia , 1.7% Latin America , 1.0% Africa , 0.9% Europe ).
This city:
7.5%Michigan:
6.9%
Marital status for residents in Kalamazoo Marital status - White (Caucasian) population 15 years and over
Males 63.6% Never married28.9% Now married0.4% Separated1.2% Widowed5.8% DivorcedFemales 56.9% Never married28.3% Now married0.3% Separated5.3% Widowed9.3% DivorcedWomen who gave birth in the past 12 months Now married:
38.8% (236)Unmarried:
61.2% (372)
Women who did not give birth in the past 12 months Now married:
20.4% (2,797)Unmarried:
79.6% (10,931)
Marital status - Black or African American population 15 years and over
Males 66.3% Never married20.3% Now married2.2% Separated0.7% Widowed10.5% DivorcedFemales 62.4% Never married19.1% Now married2.3% Separated5.8% Widowed10.4% DivorcedWomen who gave birth in the past 12 months Now married:
15.3% (41)Unmarried:
84.7% (227)
Women who did not give birth in the past 12 months Now married:
15.8% (708)Unmarried:
84.2% (3,764)
Marital status - American Indian / Alaska Native population 15 years and over
Males 16.6% Never married14.4% Now married0.0% Separated0.0% Widowed69.0% DivorcedFemales 58.5% Never married26.9% Now married0.0% Separated0.0% Widowed14.5% DivorcedWomen who gave birth in the past 12 months Now married:
0.0% (0)Unmarried:
100.0% (15)
Women who did not give birth in the past 12 months Now married:
0.0% (0)Unmarried:
100.0% (109)
Marital status - Asian population 15 years and over
Males 72.6% Never married26.5% Now married0.0% Separated0.0% Widowed0.9% DivorcedFemales 80.7% Never married14.4% Now married0.0% Separated1.2% Widowed3.7% DivorcedWomen who did not give birth in the past 12 months Now married:
12.4% (124)Unmarried:
87.6% (877)
Marital status - Other race population 15 years and over
Males 67.3% Never married24.9% Now married0.0% Separated0.0% Widowed7.8% DivorcedFemales 57.3% Never married29.6% Now married0.0% Separated8.0% Widowed5.1% DivorcedWomen who did not give birth in the past 12 months Now married:
33.8% (131)Unmarried:
66.2% (257)
Marital status - Two or more races population 15 years and over
Males 72.2% Never married22.2% Now married0.0% Separated1.3% Widowed4.3% DivorcedFemales 62.6% Never married26.2% Now married0.0% Separated3.2% Widowed8.0% DivorcedWomen who gave birth in the past 12 months Now married:
26.8% (41)Unmarried:
73.2% (113)
Women who did not give birth in the past 12 months Now married:
27.3% (386)Unmarried:
72.7% (1,031)
Marital status - White alone, not Hispanic / Latino population 15 years and over
Males 62.6% Never married29.9% Now married0.4% Separated1.3% Widowed5.9% DivorcedFemales 55.2% Never married29.4% Now married0.3% Separated5.5% Widowed9.6% DivorcedWomen who gave birth in the past 12 months Now married:
32.1% (176)Unmarried:
67.9% (372)
Women who did not give birth in the past 12 months Now married:
21.8% (2,797)Unmarried:
78.2% (10,059)
Marital status - Hispanic or Latino population 15 years and over
Males 67.3% Never married21.1% Now married0.5% Separated0.0% Widowed11.1% DivorcedFemales 70.3% Never married16.9% Now married6.5% Separated2.4% Widowed3.9% DivorcedWomen who gave birth in the past 12 months Now married:
32.7% (18)Unmarried:
67.3% (37)
Women who did not give birth in the past 12 months Now married:
21.0% (364)Unmarried:
79.0% (1,364)
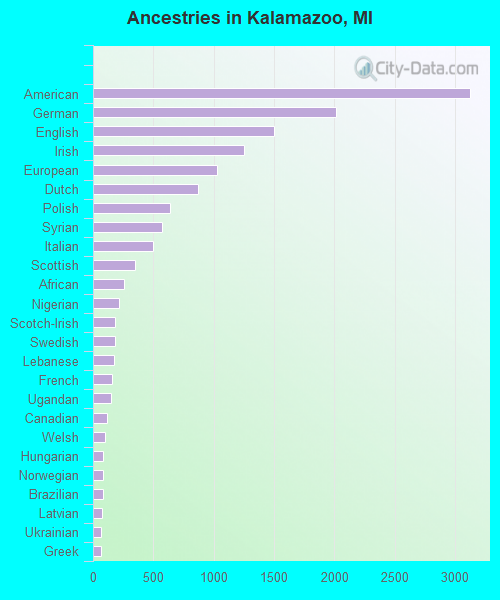
Ancestries in Kalamazoo
3,127 10.5% American2,018 6.8% German1,503 5.1% English1,251 4.2% Irish1,024 3.5% European867 2.9% Dutch641 2.2% Polish571 1.9% Syrian500 1.7% Italian351 1.2% Scottish259 0.9% African212 0.7% Nigerian181 0.6% Scotch-Irish180 0.6% Swedish178 0.6% Lebanese158 0.5% French149 0.5% Ugandan117 0.4% Canadian97 0.3% Welsh86 0.3% Hungarian83 0.3% Norwegian82 0.3% Brazilian75 0.3% Latvian70 0.2% Ukrainian67 0.2% Greek63 0.2% Danish62 0.2% Iranian52 0.2% Kenyan51 0.2% Northern European50 0.2% Yugoslavian48 0.2% British47 0.2% Finnish46 0.2% French Canadian45 0.2% Scandinavian43 0.1% Russian39 0.1% Egyptian37 0.1% Portuguese34 0.1% Austrian30 0.1% Cajun26 0.09% Czech26 0.09% Swiss25 0.08% Lithuanian23 0.08% Iraqi21 0.07% Eastern European20 0.07% Croatian19 0.06% Somali17 0.06% Jamaican15 0.05% Belgian15 0.05% British West Indian13 0.04% Bulgarian13 0.04% South African13 0.04% Moroccan12 0.04% Armenian12 0.04% Pennsylvania German10 0.03% Arab9 0.03% Romanian5 0.02% Ethiopian5 0.02% Turkish5 0.02% Haitian
Geographical mobility in Kalamazoo Same house 1 year ago 36,458 79.9% White (Caucasian)13,029 82.6% Black or African American370 86.5% American Indian / Alaska Native1,158 60.7% Asian30 100.0% Native Hawaiian / Pacific Islander1,109 74.5% Other race5,001 70.3% Two or more races34,915 79.5% White alone, not Hispanic / Latino4,447 77.3% Hispanic or LatinoMoved within same county 4,921 10.8% White / Caucasian1,491 9.5% Black or African American42 9.8% American Indian / Alaska Native329 17.3% Asian191 12.8% Other race1,345 18.9% Two or more races4,712 10.7% White alone, not Hispanic / Latino756 13.1% Hispanic or LatinoMoved within same state 2,406 5.3% White / Caucasian1,165 7.4% Black or African American7 1.6% American Indian / Alaska Native155 8.1% Asian171 11.5% Other race283 4.0% Two or more races2,406 5.5% White alone, not Hispanic / Latino304 5.3% Hispanic or LatinoMoved from different state 1,137 2.5% White / Caucasian82 0.5% Black or African American5 1.3% American Indian / Alaska Native53 2.8% Asian4 0.3% Other race264 3.7% Two or more races1,137 2.6% White alone, not Hispanic / Latino249 4.3% Hispanic or LatinoMoved from abroad 727 1.6% White127 6.6% Asian1 0.1% Other race425 6.0% Two or more races727 1.7% White alone, not Hispanic / Latino14 0.2% Hispanic or Latino
Children Nativity (place of birth) in Kalamazoo
Children under 6 years - Living with two parents Both parents native 1,805 99.6% Native7 0.4% Foreign-bornBoth parents foreign-born 180 77.9% Native51 22.1% Foreign-bornOne native, one foreign-born parent 241 100.0% NativeChildren under 6 years - Living with one parent Native parent 2,369 100.0% NativeForeign-born parent 71 100.0% NativeChildren 6 to 17 years - Living with two parents Both parents native 3,793 99.7% Native12 0.3% Foreign-bornBoth parents foreign-born 274 56.1% Native214 43.9% Foreign-bornOne native, one foreign-born parent 259 100.0% NativeChildren 6 to 17 years - Living with one parent Native parent 3,067 100.0% NativeForeign-born parent 133 54.0% Native113 46.0% Foreign-born
Grandparents responsible for own grandchildren in Kalamazoo
Grandparents (30 to 59 years) White / Caucasian 78 29.6% Responsible for grandchildren185 70.4% Not responsible for grandchildrenBlack or African American 102 90.0% Responsible for grandchildren11 10.0% Not responsible for grandchildrenOther race 36 100.0% Not responsible for grandchildrenWhite alone, not Hispanic / Latino 78 29.6% Responsible for grandchildren185 70.4% Not responsible for grandchildrenHispanic or Latino 37 49.3% Responsible for grandchildren38 50.7% Not responsible for grandchildrenGrandparents (60 years and over) White / Caucasian 48 24.1% Responsible for grandchildren150 75.9% Not responsible for grandchildrenBlack or African American 24 24.4% Responsible for grandchildren74 75.6% Not responsible for grandchildrenWhite alone, not Hispanic / Latino 48 22.9% Responsible for grandchildren161 77.1% Not responsible for grandchildrenHispanic or Latino 1 65.8% Not responsible for grandchildren