Races in Katy, Texas (TX) Detailed Stats
Data:
Races - White alone (%)
Races - White alone (% change since 2000)
Races - Black alone (%)
Races - Black alone (% change since 2000)
Races - American Indian alone (%)
Races - American Indian alone (% change since 2000)
Races - Asian alone (%)
Races - Asian alone (% change since 2000)
Races - Hispanic (%)
Races - Hispanic (% change since 2000)
Races - Native Hawaiian and Other Pacific Islander alone (%)
Races - Native Hawaiian and Other Pacific Islander alone (% change since 2000)
Races - Two or more races(%)
Races - Two or more races(% change since 2000)
Races - Other race alone (%)
Races - Other race alone (% change since 2000)
Racial diversity
Place of birth - Born in state of residence (%)
Place of birth - Born in state of residence (%) - White
Place of birth - Born in state of residence (%) - Black or African American
Place of birth - Born in state of residence (%) - Asian
Place of birth - Born in state of residence (%) - Hispanic or Latino
Place of birth - Born in state of residence (%) - American Indian and Alaska Native
Place of birth - Born in state of residence (%) - Multirace
Place of birth - Born in state of residence (%) - Other Race
Place of birth - Born in other state (%)
Place of birth - Born in other state (%) - White
Place of birth - Born in other state (%) - Black or African American
Place of birth - Born in other state (%) - Asian
Place of birth - Born in other state (%) - Hispanic or Latino
Place of birth - Born in other state (%) - American Indian and Alaska Native
Place of birth - Born in other state (%) - Multirace
Place of birth - Born in other state (%) - Other Race
Place of birth - Native, outside of US (%)
Place of birth - Native, outside of US (%) - White
Place of birth - Native, outside of US (%) - Black or African American
Place of birth - Native, outside of US (%) - Asian
Place of birth - Native, outside of US (%) - Hispanic or Latino
Place of birth - Native, outside of US (%) - American Indian and Alaska Native
Place of birth - Native, outside of US (%) - Multirace
Place of birth - Native, outside of US (%) - Other Race
Place of birth - Foreign born (%)
Place of birth - Foreign born (%) - White
Place of birth - Foreign born (%) - Black or African American
Place of birth - Foreign born (%) - Asian
Place of birth - Foreign born (%) - Hispanic or Latino
Place of birth - Foreign born (%) - American Indian and Alaska Native
Place of birth - Foreign born (%) - Multirace
Place of birth - Foreign born (%) - Other Race
Residents speaking English at home (%)
Residents speaking English at home - Born in the United States (%)
Residents speaking English at home - Native, born elsewhere (%)
Residents speaking English at home - Foreign born (%)
Residents speaking Spanish at home (%)
Residents speaking Spanish at home - Born in the United States (%)
Residents speaking Spanish at home - Native, born elsewhere (%)
Residents speaking Spanish at home - Foreign born (%)
Residents speaking other language at home (%)
Residents speaking other language at home - Born in the United States (%)
Residents speaking other language at home - Native, born elsewhere (%)
Residents speaking other language at home - Foreign born (%)
Marital status - Never married (%)
Marital status - Now married (%)
Marital status - Separated (%)
Marital status - Widowed (%)
Marital status - Divorced (%)
Ancestries Reported - Arab (%)
Ancestries Reported - Czech (%)
Ancestries Reported - Danish (%)
Ancestries Reported - Dutch (%)
Ancestries Reported - English (%)
Ancestries Reported - French (%)
Ancestries Reported - French Canadian (%)
Ancestries Reported - German (%)
Ancestries Reported - Greek (%)
Ancestries Reported - Hungarian (%)
Ancestries Reported - Irish (%)
Ancestries Reported - Italian (%)
Ancestries Reported - Lithuanian (%)
Ancestries Reported - Norwegian (%)
Ancestries Reported - Polish (%)
Ancestries Reported - Portuguese (%)
Ancestries Reported - Russian (%)
Ancestries Reported - Scotch-Irish (%)
Ancestries Reported - Scottish (%)
Ancestries Reported - Slovak (%)
Ancestries Reported - Subsaharan African (%)
Ancestries Reported - Swedish (%)
Ancestries Reported - Swiss (%)
Ancestries Reported - Ukrainian (%)
Ancestries Reported - United States (%)
Ancestries Reported - Welsh (%)
Ancestries Reported - West Indian (%)
Ancestries Reported - Other (%)
Geographical mobility - Same house 1 year ago (%)
Geographical mobility - Same house 1 year ago (%) - White
Geographical mobility - Same house 1 year ago (%) - Black or African American
Geographical mobility - Same house 1 year ago (%) - Asian
Geographical mobility - Same house 1 year ago (%) - Hispanic or Latino
Geographical mobility - Same house 1 year ago (%) - American Indian and Alaska Native
Geographical mobility - Same house 1 year ago (%) - Multirace
Geographical mobility - Same house 1 year ago (%) - Other Race
Geographical mobility - Moved within same county (%)
Geographical mobility - Moved within same county (%) - White
Geographical mobility - Moved within same county (%) - Black or African American
Geographical mobility - Moved within same county (%) - Asian
Geographical mobility - Moved within same county (%) - Hispanic or Latino
Geographical mobility - Moved within same county (%) - American Indian and Alaska Native
Geographical mobility - Moved within same county (%) - Multirace
Geographical mobility - Moved within same county (%) - Other Race
Geographical mobility - Moved from different county within same state (%)
Geographical mobility - Moved from different county within same state (%) - White
Geographical mobility - Moved from different county within same state (%) - Black or African American
Geographical mobility - Moved from different county within same state (%) - Asian
Geographical mobility - Moved from different county within same state (%) - Hispanic or Latino
Geographical mobility - Moved from different county within same state (%) - American Indian and Alaska Native
Geographical mobility - Moved from different county within same state (%) - Multirace
Geographical mobility - Moved from different county within same state (%) - Other Race
Geographical mobility - Moved from different state (%)
Geographical mobility - Moved from different state (%) - White
Geographical mobility - Moved from different state (%) - Black or African American
Geographical mobility - Moved from different state (%) - Asian
Geographical mobility - Moved from different state (%) - Hispanic or Latino
Geographical mobility - Moved from different state (%) - American Indian and Alaska Native
Geographical mobility - Moved from different state (%) - Multirace
Geographical mobility - Moved from different state (%) - Other Race
Geographical mobility - Moved from abroad (%)
Geographical mobility - Moved from abroad (%) - White
Geographical mobility - Moved from abroad (%) - Black or African American
Geographical mobility - Moved from abroad (%) - Asian
Geographical mobility - Moved from abroad (%) - Hispanic or Latino
Geographical mobility - Moved from abroad (%) - American Indian and Alaska Native
Geographical mobility - Moved from abroad (%) - Multirace
Geographical mobility - Moved from abroad (%) - Other Race
Place of birth for the foreign-born population - Ireland (%)
Place of birth for the foreign-born population - Denmark (%)
Place of birth for the foreign-born population - Norway (%)
Place of birth for the foreign-born population - Sweden (%)
Place of birth for the foreign-born population - United Kingdom (%)
Place of birth for the foreign-born population - England (%)
Place of birth for the foreign-born population - Scotland (%)
Place of birth for the foreign-born population - Other Northern Europe (%)
Place of birth for the foreign-born population - Austria (%)
Place of birth for the foreign-born population - Belgium (%)
Place of birth for the foreign-born population - France (%)
Place of birth for the foreign-born population - Germany (%)
Place of birth for the foreign-born population - Netherlands (%)
Place of birth for the foreign-born population - Switzerland (%)
Place of birth for the foreign-born population - Other Western Europe (%)
Place of birth for the foreign-born population - Greece (%)
Place of birth for the foreign-born population - Italy (%)
Place of birth for the foreign-born population - Portugal (%)
Place of birth for the foreign-born population - Spain (%)
Place of birth for the foreign-born population - Other Southern Europe (%)
Place of birth for the foreign-born population - Albania (%)
Place of birth for the foreign-born population - Belarus (%)
Place of birth for the foreign-born population - Bosnia and Herzegovina (%)
Place of birth for the foreign-born population - Bulgaria (%)
Place of birth for the foreign-born population - Croatia (%)
Place of birth for the foreign-born population - Czechoslovakia (%)
Place of birth for the foreign-born population - Hungary (%)
Place of birth for the foreign-born population - Latvia (%)
Place of birth for the foreign-born population - Lithuania (%)
Place of birth for the foreign-born population - North Macedonia (Macedonia) (%)
Place of birth for the foreign-born population - Moldova (%)
Place of birth for the foreign-born population - Poland (%)
Place of birth for the foreign-born population - Romania (%)
Place of birth for the foreign-born population - Russia (%)
Place of birth for the foreign-born population - Serbia (%)
Place of birth for the foreign-born population - Ukraine (%)
Place of birth for the foreign-born population - Other Eastern Europe (%)
Place of birth for the foreign-born population - China (%)
Place of birth for the foreign-born population - Hong Kong (%)
Place of birth for the foreign-born population - Taiwan (%)
Place of birth for the foreign-born population - Japan (%)
Place of birth for the foreign-born population - Korea (%)
Place of birth for the foreign-born population - Other Eastern Asia (%)
Place of birth for the foreign-born population - Afghanistan (%)
Place of birth for the foreign-born population - Bangladesh (%)
Place of birth for the foreign-born population - India (%)
Place of birth for the foreign-born population - Iran (%)
Place of birth for the foreign-born population - Kazakhstan (%)
Place of birth for the foreign-born population - Nepal (%)
Place of birth for the foreign-born population - Pakistan (%)
Place of birth for the foreign-born population - Sri Lanka (%)
Place of birth for the foreign-born population - Uzbekistan (%)
Place of birth for the foreign-born population - Other South Central Asia (%)
Place of birth for the foreign-born population - Burma (%)
Place of birth for the foreign-born population - Cambodia (%)
Place of birth for the foreign-born population - Indonesia (%)
Place of birth for the foreign-born population - Laos (%)
Place of birth for the foreign-born population - Malaysia (%)
Place of birth for the foreign-born population - Philippines (%)
Place of birth for the foreign-born population - Singapore (%)
Place of birth for the foreign-born population - Thailand (%)
Place of birth for the foreign-born population - Vietnam (%)
Place of birth for the foreign-born population - Other South Eastern Asia (%)
Place of birth for the foreign-born population - Armenia (%)
Place of birth for the foreign-born population - Iraq (%)
Place of birth for the foreign-born population - Israel (%)
Place of birth for the foreign-born population - Jordan (%)
Place of birth for the foreign-born population - Kuwait (%)
Place of birth for the foreign-born population - Lebanon (%)
Place of birth for the foreign-born population - Saudi Arabia (%)
Place of birth for the foreign-born population - Syria (%)
Place of birth for the foreign-born population - Turkey (%)
Place of birth for the foreign-born population - Yemen (%)
Place of birth for the foreign-born population - Other Western Asia (%)
Place of birth for the foreign-born population - Eritrea (%)
Place of birth for the foreign-born population - Ethiopia (%)
Place of birth for the foreign-born population - Kenya (%)
Place of birth for the foreign-born population - Somalia (%)
Place of birth for the foreign-born population - Uganda (%)
Place of birth for the foreign-born population - Zimbabwe (%)
Place of birth for the foreign-born population - Other Eastern Africa (%)
Place of birth for the foreign-born population - Cameroon (%)
Place of birth for the foreign-born population - Congo (%)
Place of birth for the foreign-born population - Democratic Republic of Congo (Zaire) (%)
Place of birth for the foreign-born population - Other Middle Africa (%)
Place of birth for the foreign-born population - Egypt (%)
Place of birth for the foreign-born population - Morocco (%)
Place of birth for the foreign-born population - Sudan (%)
Place of birth for the foreign-born population - Other Northern Africa (%)
Place of birth for the foreign-born population - South Africa (%)
Place of birth for the foreign-born population - Other Southern Africa (%)
Place of birth for the foreign-born population - Cabo Verde (%)
Place of birth for the foreign-born population - Ghana (%)
Place of birth for the foreign-born population - Liberia (%)
Place of birth for the foreign-born population - Nigeria (%)
Place of birth for the foreign-born population - Senegal (%)
Place of birth for the foreign-born population - Sierra Leone (%)
Place of birth for the foreign-born population - Other Western Africa (%)
Place of birth for the foreign-born population - Australia (%)
Place of birth for the foreign-born population - New Zealand (%)
Place of birth for the foreign-born population - Fiji (%)
Place of birth for the foreign-born population - Micronesia (%)
Place of birth for the foreign-born population - Bahamas (%)
Place of birth for the foreign-born population - Barbados (%)
Place of birth for the foreign-born population - Cuba (%)
Place of birth for the foreign-born population - Dominica (%)
Place of birth for the foreign-born population - Dominican Republic (%)
Place of birth for the foreign-born population - Grenada (%)
Place of birth for the foreign-born population - Haiti (%)
Place of birth for the foreign-born population - Jamaica (%)
Place of birth for the foreign-born population - St. Vincent and the Grenadines (%)
Place of birth for the foreign-born population - Trinidad and Tobago (%)
Place of birth for the foreign-born population - West Indies (%)
Place of birth for the foreign-born population - Other Caribbean (%)
Place of birth for the foreign-born population - Belize (%)
Place of birth for the foreign-born population - Costa Rica (%)
Place of birth for the foreign-born population - El Salvador (%)
Place of birth for the foreign-born population - Guatemala (%)
Place of birth for the foreign-born population - Honduras (%)
Place of birth for the foreign-born population - Mexico (%)
Place of birth for the foreign-born population - Nicaragua (%)
Place of birth for the foreign-born population - Panama (%)
Place of birth for the foreign-born population - Other Central America (%)
Place of birth for the foreign-born population - Argentina (%)
Place of birth for the foreign-born population - Bolivia (%)
Place of birth for the foreign-born population - Brazil (%)
Place of birth for the foreign-born population - Chile (%)
Place of birth for the foreign-born population - Colombia (%)
Place of birth for the foreign-born population - Ecuador (%)
Place of birth for the foreign-born population - Guyana (%)
Place of birth for the foreign-born population - Peru (%)
Place of birth for the foreign-born population - Uruguay (%)
Place of birth for the foreign-born population - Venezuela (%)
Place of birth for the foreign-born population - Other South America (%)
Place of birth for the foreign-born population - Canada (%)
Place of birth for the foreign-born population - Other Northern America (%)
Place of birth for the foreign-born population - Other (%)
Latest news about races in Katy, TX collected exclusively by city-data.com from local newspapers, TV, and radio stations
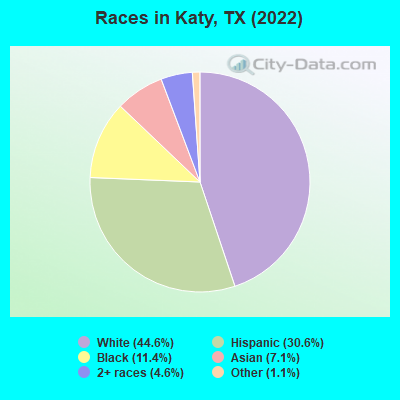
According to 2022 data, the most numerous races in Katy, TX are Hispanic (7,059 residents), White alone (10,303 residents), and Black alone (2,637 residents). 70.1% of Katy residents speak English at home. 18.4% of Katy, TX residents are foreign-born (11.4% born in Latin America, 4.1% born in Asia, 1.9% born in Africa), which is 7.4% greater than the foreign-born rate of 17.0% across the entire state of Texas.
Race distribution in Katy
2000 2022
10,933,313 52.4% White alone 6,669,666 32.0% Hispanic 2,364,255 11.3% Black alone 554,445 2.7% Asian alone 230,567 1.1% Two or more races 68,859 0.3% American Indian alone 19,958 0.10% Other race alone 10,757 0.05% Native Hawaiian and Other
12,070,642 40.2% Hispanic 11,683,430 38.9% White alone 3,508,706 11.7% Black alone 1,608,173 5.4% Asian alone 956,560 3.2% Two or more races 125,763 0.4% Other race alone 47,023 0.2% American Indian alone 29,275 0.10% Native Hawaiian and Other
Income and house value in Katy Median household income in 2022 $109,575 White non-Hispanic householders$113,597 Black householders$173,233 Asian householders$96,845 Some other race householders$148,911 Two or more races householders$88,639 Hispanic or Latino race householdersMedian 2022 house value $430,041 White Non-Hispanic householders$329,449 Black or African American householders$665,048 American Indian or Alaska Native householders $285,522 Asian householders$401,928 Some other race householders$321,542 Two or more races householders$385,236 Hispanic or Latino householders
Median age by race in Katy
41.4 Median age for White residents40.7 43.0 29.2 Median age for Black or African American residents24.5 45.7 34.7 Median age for American Indian / Alaska Native residents27.5 43.6 36.1 Median age for Asian residents35.2 36.7 -782,795,698.1 Median age for Native Hawaiian / Pacific Islander residents-633,771,929.2 -816,367,264.7 29.9 Median age for Other race residents31.0 17.0 27.5 Median age for Two or more races residents24.2 37.0 43.5 Median age for White alone residents40.1 44.6 29.8 Median age for Hispanic or Latino residents31.1 25.1
Owner/renter occupied households by race in Katy
House owners and renters - White residents 2,877 79.9% Owner occupied723 20.1% Renter occupiedHouse owners and renters - Black or African American residents 565 86.0% Owner occupied92 14.0% Renter occupiedHouse owners and renters - American Indian / Alaska Native residents 184 87.6% Owner occupied26 12.4% Renter occupiedHouse owners and renters - Asian residents 549 100.0% Owner occupiedHouse owners and renters - Other race residents 519 58.8% Owner occupied364 41.2% Renter occupiedHouse owners and renters - Two or more races residents 989 78.7% Owner occupied268 21.3% Renter occupiedHouse owners and renters - White alone residents 2,964 80.0% Owner occupied739 20.0% Renter occupiedHouse owners and renters - Hispanic or Latino residents 1,283 65.9% Owner occupied663 34.1% Renter occupied
Language usage in Katy
English speakers - Total 70.1% of residents of Katy speak English at home.
21.2% of residents speak Spanish at home 2,560 56.5% Speak English very well1,974 43.5% Speak English less than very well8.3% of residents speak other language at home 1,365 76.5% Speak English very well420 23.5% Speak English less than very well
English speakers - Born in the United States 87.0% of residents of Katy speak English at home.
9.4% of residents speak Spanish at home 388 70.2% Speak English very well165 29.8% Speak English less than very well3.8% of residents speak other language at home 220 99.1% Speak English very well2 0.9% Speak English less than very well
English speakers - Native, born elsewhere 83.9% of residents of Katy speak English at home.
3.1% of residents speak Spanish at home 27 100.0% Speak English very well16.7% of residents speak other language at home 57 39.3% Speak English very well88 60.7% Speak English less than very well
English speakers - Foreign-born 10.9% of residents of Katy speak English at home.
62.6% of residents speak Spanish at home 1,038 39.2% Speak English very well1,612 60.8% Speak English less than very well26.5% of residents speak other language at home 795 71.0% Speak English very well325 29.0% Speak English less than very well
White (Caucasian) - Speak only English Native:
100.0% (9,195)Foreign-born:
26.6% (136)
White (Caucasian) - Speak another language Native:
4.7% (429)Foreign-born:
74.1% (380)
Black or African American - Speak only English Native:
93.4% (2,110)Foreign-born:
16.0% (56)
Black or African American - Speak another language Native:
6.9% (156)Foreign-born:
88.4% (311)
American Indian / Alaska Native - Speak another language Native:
86.7% (146)Foreign-born:
98.9% (511)
Asian - Speak only English Native:
27.7% (171)Foreign-born:
15.2% (140)
Asian - Speak another language Native:
71.9% (444)Foreign-born:
84.8% (778)
Other race - Speak only English Native:
62.1% (1,076)Foreign-born:
1.6% (20)
Other race - Speak another language Native:
40.8% (707)Foreign-born:
98.8% (1,273)
Two or more races - Speak only English Native:
65.5% (1,596)Foreign-born:
12.9% (110)
Two or more races - Speak another language Native:
31.1% (758)Foreign-born:
87.0% (742)
White alone - Speak only English Native:
97.3% (9,547)Foreign-born:
77.4% (153)
White alone - Speak another language Native:
2.7% (261)Foreign-born:
25.0% (49)
Hispanic or Latino - Speak only English Native:
52.5% (1,783)Foreign-born:
3.7% (101)
Hispanic or Latino - Speak another language Native:
46.9% (1,592)Foreign-born:
96.3% (2,658)
Foreign-born residents in Katy 4,239 residents are foreign born (11.4% Latin America , 4.1% Asia , 1.9% Africa ).
This city:
18.4%Texas:
17.1%
Marital status for residents in Katy Marital status - White (Caucasian) population 15 years and over
Males 19.0% Never married71.1% Now married0.4% Separated3.5% Widowed6.0% DivorcedFemales 22.3% Never married58.4% Now married1.3% Separated6.5% Widowed11.5% DivorcedWomen who gave birth in the past 12 months Now married:
100.0% (130)Unmarried:
0.0% (0)
Women who did not give birth in the past 12 months Now married:
58.2% (1,269)Unmarried:
41.8% (912)
Marital status - Black or African American population 15 years and over
Males 47.4% Never married52.6% Now married0.0% Separated0.0% Widowed0.0% DivorcedFemales 38.5% Never married43.3% Now married0.0% Separated2.2% Widowed16.0% DivorcedWomen who did not give birth in the past 12 months Now married:
46.3% (284)Unmarried:
53.7% (329)
Marital status - American Indian / Alaska Native population 15 years and over
Males 45.3% Never married54.7% Now married0.0% Separated0.0% Widowed0.0% DivorcedFemales 21.4% Never married78.6% Now married0.0% Separated0.0% Widowed0.0% DivorcedWomen who did not give birth in the past 12 months Now married:
74.0% (173)Unmarried:
26.0% (61)
Marital status - Asian population 15 years and over
Males 11.2% Never married84.3% Now married0.0% Separated2.4% Widowed2.2% DivorcedFemales 10.1% Never married81.0% Now married0.0% Separated2.6% Widowed6.4% DivorcedWomen who gave birth in the past 12 months Now married:
75.0% (15)Unmarried:
25.0% (5)
Women who did not give birth in the past 12 months Now married:
87.2% (386)Unmarried:
12.8% (57)
Marital status - Other race population 15 years and over
Males 33.5% Never married57.4% Now married2.8% Separated0.0% Widowed6.3% DivorcedFemales 27.6% Never married62.5% Now married0.0% Separated4.2% Widowed5.7% DivorcedWomen who did not give birth in the past 12 months Now married:
54.2% (397)Unmarried:
45.8% (336)
Marital status - Two or more races population 15 years and over
Males 26.4% Never married48.9% Now married14.1% Separated0.2% Widowed10.4% DivorcedFemales 21.0% Never married56.0% Now married0.0% Separated1.6% Widowed21.5% DivorcedWomen who gave birth in the past 12 months Now married:
100.0% (235)Unmarried:
0.0% (0)
Women who did not give birth in the past 12 months Now married:
37.6% (155)Unmarried:
62.4% (257)
Marital status - White alone, not Hispanic / Latino population 15 years and over
Males 18.6% Never married70.6% Now married0.0% Separated4.0% Widowed6.8% DivorcedFemales 17.3% Never married60.9% Now married0.2% Separated7.9% Widowed13.7% DivorcedWomen who gave birth in the past 12 months Now married:
100.0% (90)Unmarried:
0.0% (0)
Women who did not give birth in the past 12 months Now married:
65.2% (1,497)Unmarried:
34.8% (800)
Marital status - Hispanic or Latino population 15 years and over
Males 31.7% Never married61.2% Now married1.9% Separated0.1% Widowed5.0% DivorcedFemales 33.8% Never married57.1% Now married2.6% Separated1.0% Widowed5.5% DivorcedWomen who gave birth in the past 12 months Now married:
100.0% (133)Unmarried:
0.0% (0)
Women who did not give birth in the past 12 months Now married:
46.0% (745)Unmarried:
54.0% (875)
Ancestries in Katy
1,208 10.4% German994 8.5% English684 5.9% American360 3.1% European359 3.1% Sudanese340 2.9% Scotch-Irish312 2.7% Italian187 1.6% Polish187 1.6% Liberian169 1.4% Irish81 0.7% Scottish64 0.5% Czech50 0.4% French47 0.4% Egyptian47 0.4% Norwegian46 0.4% British43 0.4% Arab40 0.3% Dutch36 0.3% Greek35 0.3% African29 0.2% Eastern European24 0.2% Canadian17 0.1% Czechoslovakian17 0.1% Hungarian17 0.1% Welsh11 0.09% Scandinavian8 0.07% Russian5 0.04% Portuguese
Geographical mobility in Katy Same house 1 year ago 8,021 84.4% White (Caucasian)2,320 86.6% Black or African American811 100.0% American Indian / Alaska Native1,209 72.7% Asian3,381 96.6% Other race2,969 85.6% Two or more races8,514 83.2% White alone, not Hispanic / Latino6,416 93.3% Hispanic or LatinoMoved within same county 407 4.3% White / Caucasian124 4.6% Black or African American98 5.9% Asian43 1.2% Other race306 8.8% Two or more races430 4.2% White alone, not Hispanic / Latino368 5.3% Hispanic or LatinoMoved within same state 673 7.1% White / Caucasian199 7.4% Black or African American312 18.8% Asian19 0.5% Two or more races721 7.0% White alone, not Hispanic / LatinoMoved from different state 393 4.1% White / Caucasian27 1.0% Black or African American16 0.9% Asian26 0.7% Other race155 4.5% Two or more races352 3.4% White alone, not Hispanic / Latino74 1.1% Hispanic or LatinoMoved from abroad 146 1.5% White174 1.7% White alone, not Hispanic / Latino
Children Nativity (place of birth) in Katy
Children under 6 years - Living with two parents Both parents native 831 100.0% NativeBoth parents foreign-born 440 100.0% NativeOne native, one foreign-born parent 404 100.0% NativeChildren under 6 years - Living with one parent Native parent 36 99.6% Native0 0.4% Foreign-bornForeign-born parent 201 97.6% Native5 2.4% Foreign-bornChildren 6 to 17 years - Living with two parents Both parents native 2,325 100.0% NativeBoth parents foreign-born 346 71.0% Native142 29.0% Foreign-bornOne native, one foreign-born parent 894 90.6% Native93 9.4% Foreign-bornChildren 6 to 17 years - Living with one parent Native parent 672 100.0% NativeForeign-born parent 238 51.2% Native227 48.8% Foreign-born
Grandparents responsible for own grandchildren in Katy
Grandparents (30 to 59 years) White / Caucasian 9 28.6% Responsible for grandchildren23 71.4% Not responsible for grandchildrenBlack or African American 9 100.0% Not responsible for grandchildrenWhite alone, not Hispanic / Latino 16 100.0% Responsible for grandchildrenHispanic or Latino 47 100.0% Not responsible for grandchildrenGrandparents (60 years and over) White / Caucasian 45 48.2% Responsible for grandchildren49 51.8% Not responsible for grandchildrenWhite alone, not Hispanic / Latino 63 42.1% Responsible for grandchildren86 57.9% Not responsible for grandchildrenHispanic or Latino 12 100.0% Not responsible for grandchildren