Races in Kearney, Nebraska (NE) Detailed Stats
Data:
Races - White alone (%)
Races - White alone (% change since 2000)
Races - Black alone (%)
Races - Black alone (% change since 2000)
Races - American Indian alone (%)
Races - American Indian alone (% change since 2000)
Races - Asian alone (%)
Races - Asian alone (% change since 2000)
Races - Hispanic (%)
Races - Hispanic (% change since 2000)
Races - Native Hawaiian and Other Pacific Islander alone (%)
Races - Native Hawaiian and Other Pacific Islander alone (% change since 2000)
Races - Two or more races(%)
Races - Two or more races(% change since 2000)
Races - Other race alone (%)
Races - Other race alone (% change since 2000)
Racial diversity
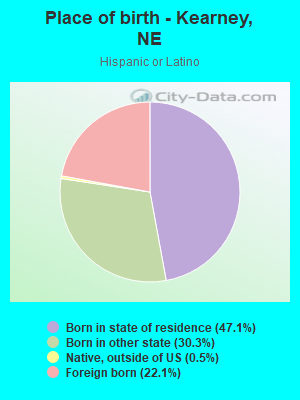
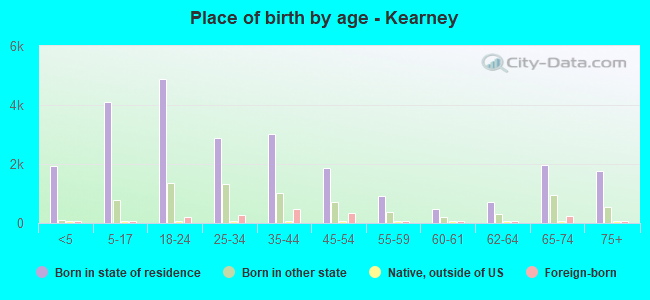
Place of birth - Born in state of residence (%)
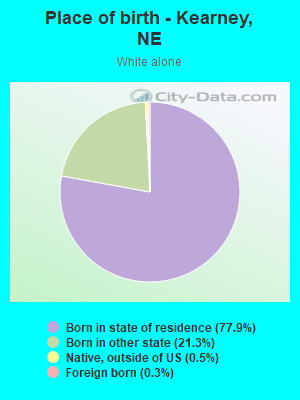
Place of birth - Born in state of residence (%) - White
Place of birth - Born in state of residence (%) - Black or African American
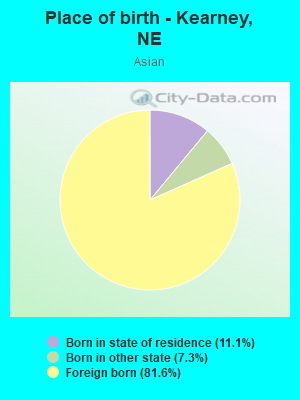
Place of birth - Born in state of residence (%) - Asian
Place of birth - Born in state of residence (%) - Hispanic or Latino
Place of birth - Born in state of residence (%) - American Indian and Alaska Native
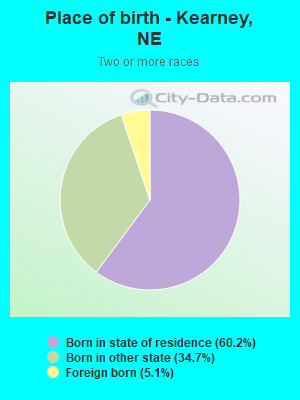
Place of birth - Born in state of residence (%) - Multirace
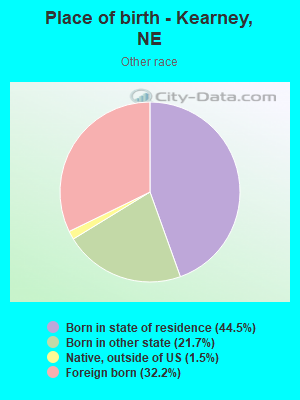
Place of birth - Born in state of residence (%) - Other Race
Place of birth - Born in other state (%)
Place of birth - Born in other state (%) - White
Place of birth - Born in other state (%) - Black or African American
Place of birth - Born in other state (%) - Asian
Place of birth - Born in other state (%) - Hispanic or Latino
Place of birth - Born in other state (%) - American Indian and Alaska Native
Place of birth - Born in other state (%) - Multirace
Place of birth - Born in other state (%) - Other Race
Place of birth - Native, outside of US (%)
Place of birth - Native, outside of US (%) - White
Place of birth - Native, outside of US (%) - Black or African American
Place of birth - Native, outside of US (%) - Asian
Place of birth - Native, outside of US (%) - Hispanic or Latino
Place of birth - Native, outside of US (%) - American Indian and Alaska Native
Place of birth - Native, outside of US (%) - Multirace
Place of birth - Native, outside of US (%) - Other Race
Place of birth - Foreign born (%)
Place of birth - Foreign born (%) - White
Place of birth - Foreign born (%) - Black or African American
Place of birth - Foreign born (%) - Asian
Place of birth - Foreign born (%) - Hispanic or Latino
Place of birth - Foreign born (%) - American Indian and Alaska Native
Place of birth - Foreign born (%) - Multirace
Place of birth - Foreign born (%) - Other Race
Residents speaking English at home (%)
Residents speaking English at home - Born in the United States (%)
Residents speaking English at home - Native, born elsewhere (%)
Residents speaking English at home - Foreign born (%)
Residents speaking Spanish at home (%)
Residents speaking Spanish at home - Born in the United States (%)
Residents speaking Spanish at home - Native, born elsewhere (%)
Residents speaking Spanish at home - Foreign born (%)
Residents speaking other language at home (%)
Residents speaking other language at home - Born in the United States (%)
Residents speaking other language at home - Native, born elsewhere (%)
Residents speaking other language at home - Foreign born (%)
Marital status - Never married (%)
Marital status - Now married (%)
Marital status - Separated (%)
Marital status - Widowed (%)
Marital status - Divorced (%)
Ancestries Reported - Arab (%)
Ancestries Reported - Czech (%)
Ancestries Reported - Danish (%)
Ancestries Reported - Dutch (%)
Ancestries Reported - English (%)
Ancestries Reported - French (%)
Ancestries Reported - French Canadian (%)
Ancestries Reported - German (%)
Ancestries Reported - Greek (%)
Ancestries Reported - Hungarian (%)
Ancestries Reported - Irish (%)
Ancestries Reported - Italian (%)
Ancestries Reported - Lithuanian (%)
Ancestries Reported - Norwegian (%)
Ancestries Reported - Polish (%)
Ancestries Reported - Portuguese (%)
Ancestries Reported - Russian (%)
Ancestries Reported - Scotch-Irish (%)
Ancestries Reported - Scottish (%)
Ancestries Reported - Slovak (%)
Ancestries Reported - Subsaharan African (%)
Ancestries Reported - Swedish (%)
Ancestries Reported - Swiss (%)
Ancestries Reported - Ukrainian (%)
Ancestries Reported - United States (%)
Ancestries Reported - Welsh (%)
Ancestries Reported - West Indian (%)
Ancestries Reported - Other (%)
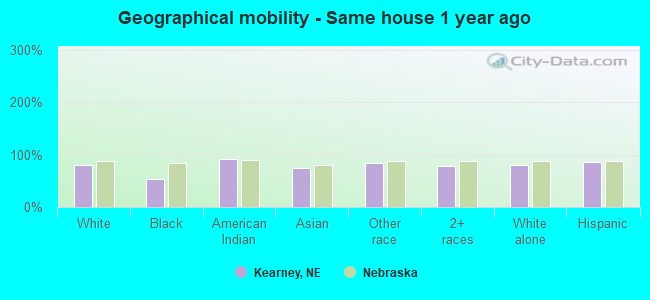
Geographical mobility - Same house 1 year ago (%)
Geographical mobility - Same house 1 year ago (%) - White
Geographical mobility - Same house 1 year ago (%) - Black or African American
Geographical mobility - Same house 1 year ago (%) - Asian
Geographical mobility - Same house 1 year ago (%) - Hispanic or Latino
Geographical mobility - Same house 1 year ago (%) - American Indian and Alaska Native
Geographical mobility - Same house 1 year ago (%) - Multirace
Geographical mobility - Same house 1 year ago (%) - Other Race
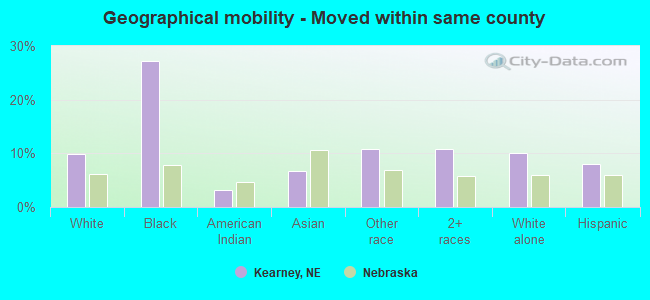
Geographical mobility - Moved within same county (%)
Geographical mobility - Moved within same county (%) - White
Geographical mobility - Moved within same county (%) - Black or African American
Geographical mobility - Moved within same county (%) - Asian
Geographical mobility - Moved within same county (%) - Hispanic or Latino
Geographical mobility - Moved within same county (%) - American Indian and Alaska Native
Geographical mobility - Moved within same county (%) - Multirace
Geographical mobility - Moved within same county (%) - Other Race
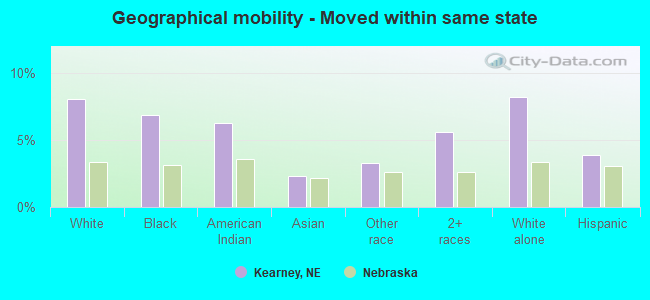
Geographical mobility - Moved from different county within same state (%)
Geographical mobility - Moved from different county within same state (%) - White
Geographical mobility - Moved from different county within same state (%) - Black or African American
Geographical mobility - Moved from different county within same state (%) - Asian
Geographical mobility - Moved from different county within same state (%) - Hispanic or Latino
Geographical mobility - Moved from different county within same state (%) - American Indian and Alaska Native
Geographical mobility - Moved from different county within same state (%) - Multirace
Geographical mobility - Moved from different county within same state (%) - Other Race
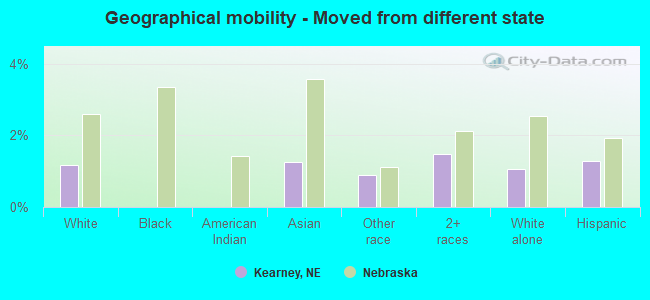
Geographical mobility - Moved from different state (%)
Geographical mobility - Moved from different state (%) - White
Geographical mobility - Moved from different state (%) - Black or African American
Geographical mobility - Moved from different state (%) - Asian
Geographical mobility - Moved from different state (%) - Hispanic or Latino
Geographical mobility - Moved from different state (%) - American Indian and Alaska Native
Geographical mobility - Moved from different state (%) - Multirace
Geographical mobility - Moved from different state (%) - Other Race
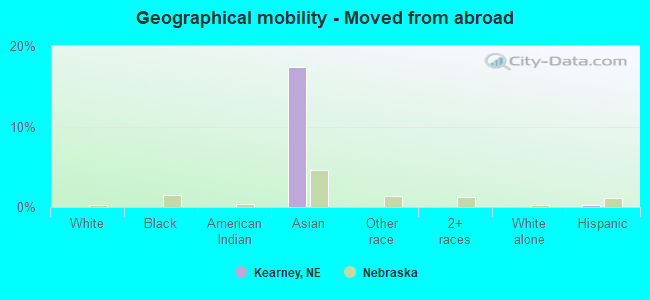
Geographical mobility - Moved from abroad (%)
Geographical mobility - Moved from abroad (%) - White
Geographical mobility - Moved from abroad (%) - Black or African American
Geographical mobility - Moved from abroad (%) - Asian
Geographical mobility - Moved from abroad (%) - Hispanic or Latino
Geographical mobility - Moved from abroad (%) - American Indian and Alaska Native
Geographical mobility - Moved from abroad (%) - Multirace
Geographical mobility - Moved from abroad (%) - Other Race
Place of birth for the foreign-born population - Ireland (%)
Place of birth for the foreign-born population - Denmark (%)
Place of birth for the foreign-born population - Norway (%)
Place of birth for the foreign-born population - Sweden (%)
Place of birth for the foreign-born population - United Kingdom (%)
Place of birth for the foreign-born population - England (%)
Place of birth for the foreign-born population - Scotland (%)
Place of birth for the foreign-born population - Other Northern Europe (%)
Place of birth for the foreign-born population - Austria (%)
Place of birth for the foreign-born population - Belgium (%)
Place of birth for the foreign-born population - France (%)
Place of birth for the foreign-born population - Germany (%)
Place of birth for the foreign-born population - Netherlands (%)
Place of birth for the foreign-born population - Switzerland (%)
Place of birth for the foreign-born population - Other Western Europe (%)
Place of birth for the foreign-born population - Greece (%)
Place of birth for the foreign-born population - Italy (%)
Place of birth for the foreign-born population - Portugal (%)
Place of birth for the foreign-born population - Spain (%)
Place of birth for the foreign-born population - Other Southern Europe (%)
Place of birth for the foreign-born population - Albania (%)
Place of birth for the foreign-born population - Belarus (%)
Place of birth for the foreign-born population - Bosnia and Herzegovina (%)
Place of birth for the foreign-born population - Bulgaria (%)
Place of birth for the foreign-born population - Croatia (%)
Place of birth for the foreign-born population - Czechoslovakia (%)
Place of birth for the foreign-born population - Hungary (%)
Place of birth for the foreign-born population - Latvia (%)
Place of birth for the foreign-born population - Lithuania (%)
Place of birth for the foreign-born population - North Macedonia (Macedonia) (%)
Place of birth for the foreign-born population - Moldova (%)
Place of birth for the foreign-born population - Poland (%)
Place of birth for the foreign-born population - Romania (%)
Place of birth for the foreign-born population - Russia (%)
Place of birth for the foreign-born population - Serbia (%)
Place of birth for the foreign-born population - Ukraine (%)
Place of birth for the foreign-born population - Other Eastern Europe (%)
Place of birth for the foreign-born population - China (%)
Place of birth for the foreign-born population - Hong Kong (%)
Place of birth for the foreign-born population - Taiwan (%)
Place of birth for the foreign-born population - Japan (%)
Place of birth for the foreign-born population - Korea (%)
Place of birth for the foreign-born population - Other Eastern Asia (%)
Place of birth for the foreign-born population - Afghanistan (%)
Place of birth for the foreign-born population - Bangladesh (%)
Place of birth for the foreign-born population - India (%)
Place of birth for the foreign-born population - Iran (%)
Place of birth for the foreign-born population - Kazakhstan (%)
Place of birth for the foreign-born population - Nepal (%)
Place of birth for the foreign-born population - Pakistan (%)
Place of birth for the foreign-born population - Sri Lanka (%)
Place of birth for the foreign-born population - Uzbekistan (%)
Place of birth for the foreign-born population - Other South Central Asia (%)
Place of birth for the foreign-born population - Burma (%)
Place of birth for the foreign-born population - Cambodia (%)
Place of birth for the foreign-born population - Indonesia (%)
Place of birth for the foreign-born population - Laos (%)
Place of birth for the foreign-born population - Malaysia (%)
Place of birth for the foreign-born population - Philippines (%)
Place of birth for the foreign-born population - Singapore (%)
Place of birth for the foreign-born population - Thailand (%)
Place of birth for the foreign-born population - Vietnam (%)
Place of birth for the foreign-born population - Other South Eastern Asia (%)
Place of birth for the foreign-born population - Armenia (%)
Place of birth for the foreign-born population - Iraq (%)
Place of birth for the foreign-born population - Israel (%)
Place of birth for the foreign-born population - Jordan (%)
Place of birth for the foreign-born population - Kuwait (%)
Place of birth for the foreign-born population - Lebanon (%)
Place of birth for the foreign-born population - Saudi Arabia (%)
Place of birth for the foreign-born population - Syria (%)
Place of birth for the foreign-born population - Turkey (%)
Place of birth for the foreign-born population - Yemen (%)
Place of birth for the foreign-born population - Other Western Asia (%)
Place of birth for the foreign-born population - Eritrea (%)
Place of birth for the foreign-born population - Ethiopia (%)
Place of birth for the foreign-born population - Kenya (%)
Place of birth for the foreign-born population - Somalia (%)
Place of birth for the foreign-born population - Uganda (%)
Place of birth for the foreign-born population - Zimbabwe (%)
Place of birth for the foreign-born population - Other Eastern Africa (%)
Place of birth for the foreign-born population - Cameroon (%)
Place of birth for the foreign-born population - Congo (%)
Place of birth for the foreign-born population - Democratic Republic of Congo (Zaire) (%)
Place of birth for the foreign-born population - Other Middle Africa (%)
Place of birth for the foreign-born population - Egypt (%)
Place of birth for the foreign-born population - Morocco (%)
Place of birth for the foreign-born population - Sudan (%)
Place of birth for the foreign-born population - Other Northern Africa (%)
Place of birth for the foreign-born population - South Africa (%)
Place of birth for the foreign-born population - Other Southern Africa (%)
Place of birth for the foreign-born population - Cabo Verde (%)
Place of birth for the foreign-born population - Ghana (%)
Place of birth for the foreign-born population - Liberia (%)
Place of birth for the foreign-born population - Nigeria (%)
Place of birth for the foreign-born population - Senegal (%)
Place of birth for the foreign-born population - Sierra Leone (%)
Place of birth for the foreign-born population - Other Western Africa (%)
Place of birth for the foreign-born population - Australia (%)
Place of birth for the foreign-born population - New Zealand (%)
Place of birth for the foreign-born population - Fiji (%)
Place of birth for the foreign-born population - Micronesia (%)
Place of birth for the foreign-born population - Bahamas (%)
Place of birth for the foreign-born population - Barbados (%)
Place of birth for the foreign-born population - Cuba (%)
Place of birth for the foreign-born population - Dominica (%)
Place of birth for the foreign-born population - Dominican Republic (%)
Place of birth for the foreign-born population - Grenada (%)
Place of birth for the foreign-born population - Haiti (%)
Place of birth for the foreign-born population - Jamaica (%)
Place of birth for the foreign-born population - St. Vincent and the Grenadines (%)
Place of birth for the foreign-born population - Trinidad and Tobago (%)
Place of birth for the foreign-born population - West Indies (%)
Place of birth for the foreign-born population - Other Caribbean (%)
Place of birth for the foreign-born population - Belize (%)
Place of birth for the foreign-born population - Costa Rica (%)
Place of birth for the foreign-born population - El Salvador (%)
Place of birth for the foreign-born population - Guatemala (%)
Place of birth for the foreign-born population - Honduras (%)
Place of birth for the foreign-born population - Mexico (%)
Place of birth for the foreign-born population - Nicaragua (%)
Place of birth for the foreign-born population - Panama (%)
Place of birth for the foreign-born population - Other Central America (%)
Place of birth for the foreign-born population - Argentina (%)
Place of birth for the foreign-born population - Bolivia (%)
Place of birth for the foreign-born population - Brazil (%)
Place of birth for the foreign-born population - Chile (%)
Place of birth for the foreign-born population - Colombia (%)
Place of birth for the foreign-born population - Ecuador (%)
Place of birth for the foreign-born population - Guyana (%)
Place of birth for the foreign-born population - Peru (%)
Place of birth for the foreign-born population - Uruguay (%)
Place of birth for the foreign-born population - Venezuela (%)
Place of birth for the foreign-born population - Other South America (%)
Place of birth for the foreign-born population - Canada (%)
Place of birth for the foreign-born population - Other Northern America (%)
Place of birth for the foreign-born population - Other (%)
Latest news about races in Kearney, NE collected exclusively by city-data.com from local newspapers, TV, and radio stations
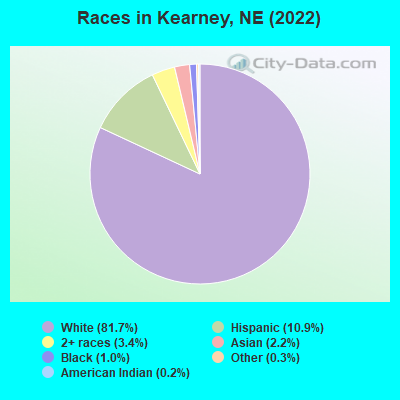
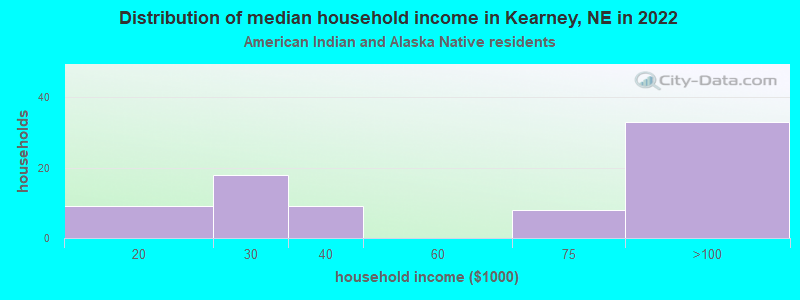
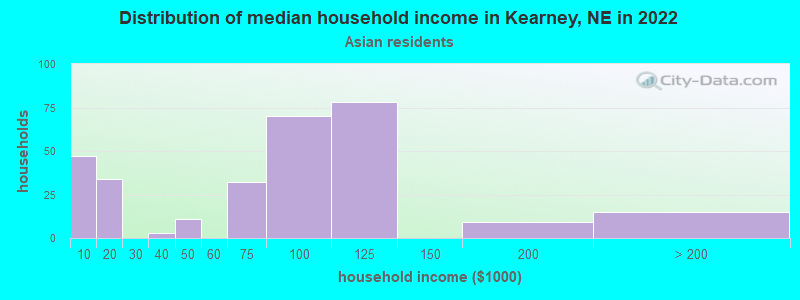
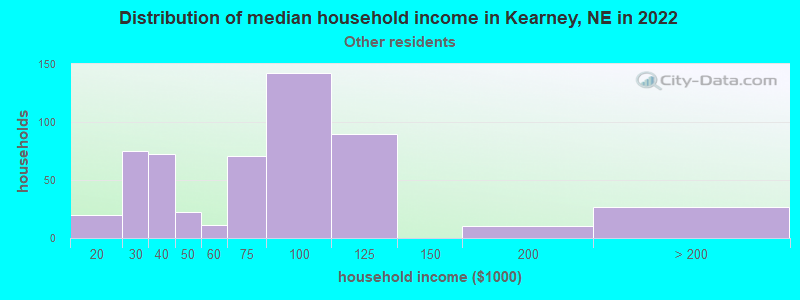
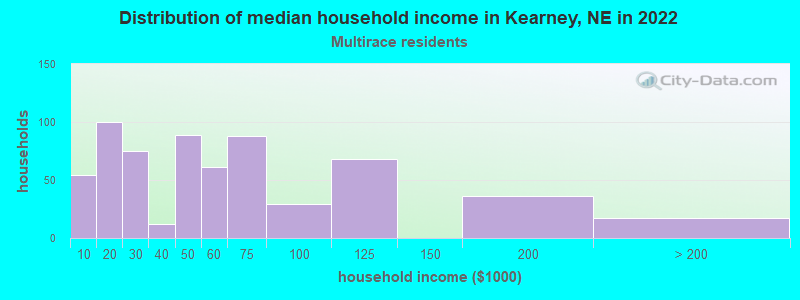
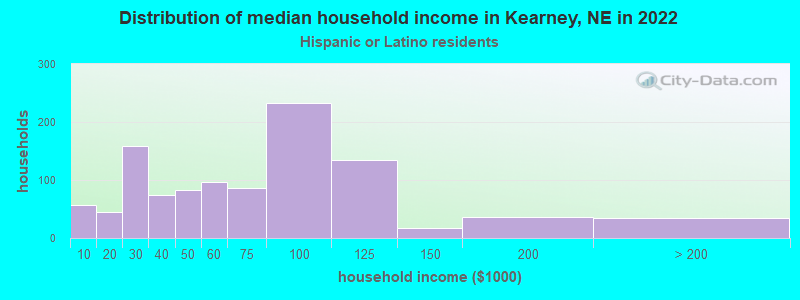
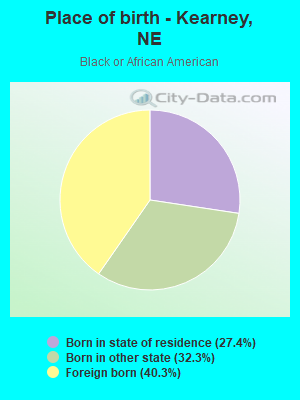
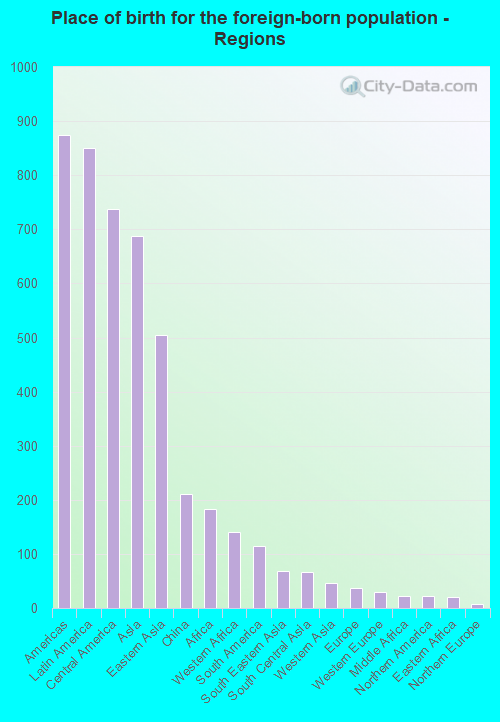
According to 2022 data, the most numerous races in Kearney, NE are White alone (27,757 residents), Hispanic (3,702 residents), and Black alone (351 residents). 90.7% of Kearney residents speak English at home. 5.2% of Kearney, NE residents are foreign-born (2.5% born in Latin America, 2.0% born in Asia, 0.5% born in Africa), which is 33.4% less than the foreign-born rate of 7.0% across the entire state of Nebraska.
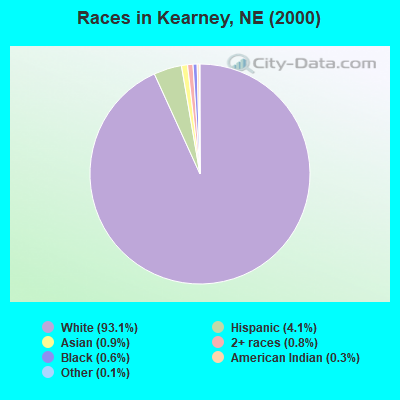
Race distribution in Kearney
2000 2022
1,494,494 87.3% White alone 94,425 5.5% Hispanic 67,537 3.9% Black alone 21,677 1.3% Asian alone 17,696 1.0% Two or more races 13,460 0.8% American Indian alone 1,327 0.08% Other race alone 647 0.04% Native Hawaiian and Other
1,492,005 75.8% White alone 241,898 12.3% Hispanic 89,520 4.5% Black alone 76,499 3.9% Two or more races 49,261 2.5% Asian alone 10,249 0.5% American Indian alone 7,425 0.4% Other race alone 1,066 0.05% Native Hawaiian and Other
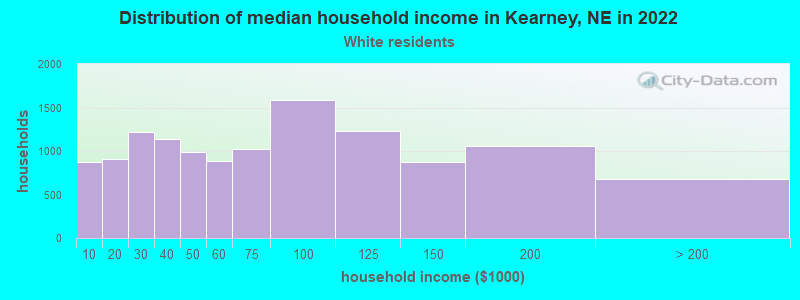
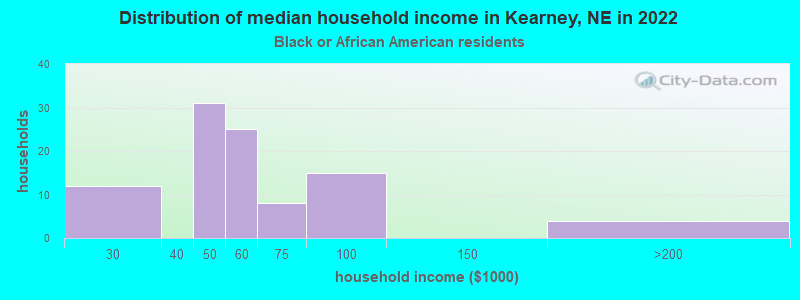
Income and house value in Kearney Median household income in 2022 $65,317 White non-Hispanic householders$58,746 Black householders$101,601 Asian householders$70,377 Some other race householders$49,472 Two or more races householders$63,350 Hispanic or Latino race householdersMedian 2022 house value $263,660 White Non-Hispanic householders$235,411 Black or African American householders$519,290 American Indian or Alaska Native householders $271,415 Asian householders$226,272 Some other race householders$223,502 Two or more races householders$219,348 Hispanic or Latino householders
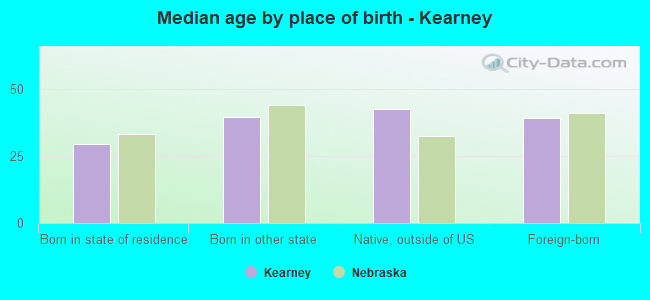
Median age by race in Kearney
34.5 Median age for White residents32.5 37.2 35.2 Median age for Black or African American residents38.4 30.1 26.7 Median age for American Indian / Alaska Native residents19.4 35.5 23.8 Median age for Asian residents30.1 22.5 -699,999,999.3 Median age for Native Hawaiian / Pacific Islander residents-672,108,842.9 -689,223,057.0 23.9 Median age for Other race residents25.9 24.7 20.1 Median age for Two or more races residents20.9 19.1 35.2 Median age for White alone residents32.7 37.3 23.5 Median age for Hispanic or Latino residents23.6 21.4
Owner/renter occupied households by race in Kearney
House owners and renters - White residents 7,634 61.6% Owner occupied4,759 38.4% Renter occupiedHouse owners and renters - Black or African American residents 6 6.6% Owner occupied87 93.4% Renter occupiedHouse owners and renters - American Indian / Alaska Native residents 21 22.5% Owner occupied73 77.5% Renter occupiedHouse owners and renters - Asian residents 155 59.5% Owner occupied105 40.5% Renter occupiedHouse owners and renters - Other race residents 302 56.0% Owner occupied237 44.0% Renter occupiedHouse owners and renters - Two or more races residents 246 40.3% Owner occupied363 59.7% Renter occupiedHouse owners and renters - White alone residents 7,511 61.3% Owner occupied4,735 38.7% Renter occupiedHouse owners and renters - Hispanic or Latino residents 538 52.5% Owner occupied488 47.5% Renter occupied
Language usage in Kearney
English speakers - Total 90.7% of residents of Kearney speak English at home.
6.2% of residents speak Spanish at home 1,366 69.1% Speak English very well611 30.9% Speak English less than very well3.2% of residents speak other language at home 598 59.1% Speak English very well413 40.9% Speak English less than very well
English speakers - Born in the United States 91.1% of residents of Kearney speak English at home.
8.0% of residents speak Spanish at home 552 91.8% Speak English very well49 8.2% Speak English less than very well0.6% of residents speak other language at home 43 100.0% Speak English very well
English speakers - Native, born elsewhere 88.0% of residents of Kearney speak English at home.
20.8% of residents speak other language at home 40 100.0% Speak English very well
English speakers - Foreign-born 13.8% of residents of Kearney speak English at home.
47.8% of residents speak Spanish at home 268 33.0% Speak English very well545 67.0% Speak English less than very well36.8% of residents speak other language at home 225 35.9% Speak English very well401 64.1% Speak English less than very well
White (Caucasian) - Speak only English Native:
98.5% (26,230)Foreign-born:
20.5% (40)
White (Caucasian) - Speak another language Native:
1.7% (443)Foreign-born:
77.9% (153)
Black or African American - Speak only English Native:
81.1% (185)Foreign-born:
100.0% (153)
Black or African American - Speak another language Native:
21.9% (50)Foreign-born:
18.6% (28)
American Indian / Alaska Native - Speak another language Native:
22.9% (40)Foreign-born:
100.0% (42)
Asian - Speak only English Native:
28.2% (42)Foreign-born:
6.7% (41)
Asian - Speak another language Native:
67.5% (101)Foreign-born:
94.2% (574)
Other race - Speak only English Native:
41.6% (479)Foreign-born:
4.4% (28)
Other race - Speak another language Native:
56.4% (649)Foreign-born:
96.0% (613)
Two or more races - Speak another language Native:
14.1% (263)Foreign-born:
100.0% (111)
White alone - Speak only English Native:
98.4% (25,618)Foreign-born:
47.5% (44)
White alone - Speak another language Native:
1.6% (425)Foreign-born:
49.3% (46)
Hispanic or Latino - Speak only English Native:
63.1% (1,628)Foreign-born:
1.3% (11)
Hispanic or Latino - Speak another language Native:
37.6% (972)Foreign-born:
99.3% (821)
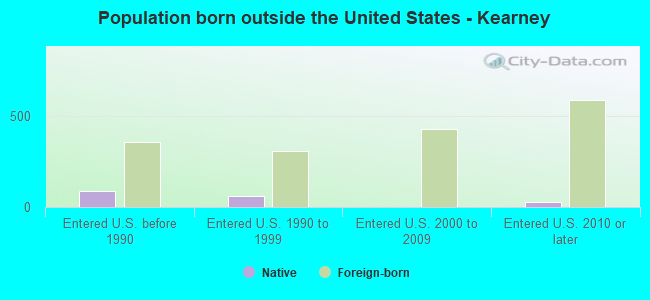
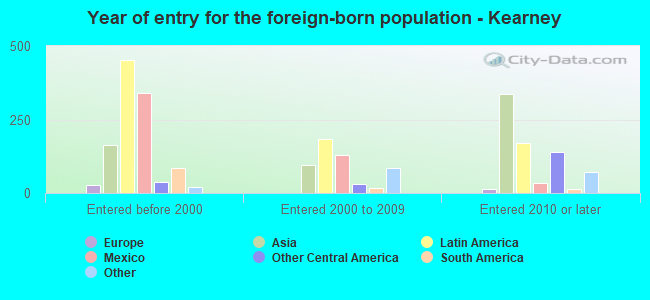
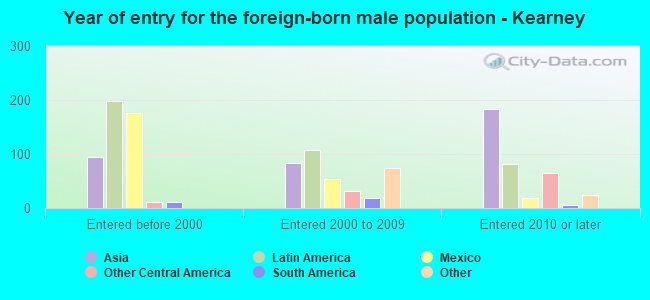
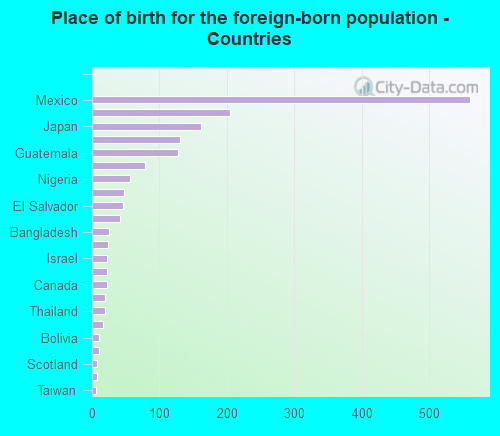
Foreign-born residents in Kearney 1,782 residents are foreign born (2.5% Latin America , 2.0% Asia , 0.5% Africa ).
This city:
5.2%Nebraska:
7.5%
Marital status for residents in Kearney Marital status - White (Caucasian) population 15 years and over
Males 42.5% Never married44.6% Now married1.2% Separated2.5% Widowed9.3% DivorcedFemales 33.8% Never married42.0% Now married0.1% Separated11.1% Widowed13.0% DivorcedWomen who gave birth in the past 12 months Now married:
49.8% (245)Unmarried:
50.2% (247)
Women who did not give birth in the past 12 months Now married:
35.5% (2,406)Unmarried:
64.5% (4,375)
Marital status - Black or African American population 15 years and over
Males 44.0% Never married44.0% Now married0.0% Separated0.0% Widowed12.0% DivorcedFemales 61.8% Never married18.2% Now married0.0% Separated0.0% Widowed20.0% DivorcedWomen who did not give birth in the past 12 months Now married:
15.3% (22)Unmarried:
84.7% (124)
Marital status - American Indian / Alaska Native population 15 years and over
Males 64.9% Never married35.1% Now married0.0% Separated0.0% Widowed0.0% DivorcedFemales 60.5% Never married32.9% Now married5.3% Separated0.0% Widowed1.3% DivorcedWomen who gave birth in the past 12 months Now married:
93.3% (16)Unmarried:
6.7% (1)
Women who did not give birth in the past 12 months Now married:
24.6% (17)Unmarried:
75.4% (51)
Marital status - Asian population 15 years and over
Males 51.8% Never married43.8% Now married0.0% Separated0.0% Widowed4.4% DivorcedFemales 45.6% Never married50.4% Now married0.0% Separated4.1% Widowed0.0% DivorcedWomen who did not give birth in the past 12 months Now married:
40.9% (88)Unmarried:
59.1% (127)
Marital status - Other race population 15 years and over
Males 52.1% Never married35.6% Now married0.0% Separated0.6% Widowed11.7% DivorcedFemales 44.5% Never married38.0% Now married2.0% Separated0.0% Widowed15.5% DivorcedWomen who gave birth in the past 12 months Now married:
0.0% (0)Unmarried:
100.0% (16)
Women who did not give birth in the past 12 months Now married:
35.1% (185)Unmarried:
64.9% (342)
Marital status - Two or more races population 15 years and over
Males 53.5% Never married28.5% Now married0.8% Separated1.4% Widowed15.8% DivorcedFemales 64.7% Never married16.9% Now married0.0% Separated4.8% Widowed13.6% DivorcedWomen who gave birth in the past 12 months Now married:
0.0% (0)Unmarried:
100.0% (16)
Women who did not give birth in the past 12 months Now married:
15.4% (73)Unmarried:
84.6% (402)
Marital status - White alone, not Hispanic / Latino population 15 years and over
Males 41.5% Never married45.5% Now married1.2% Separated2.6% Widowed9.2% DivorcedFemales 33.3% Never married42.4% Now married0.1% Separated11.3% Widowed12.9% DivorcedWomen who gave birth in the past 12 months Now married:
48.7% (241)Unmarried:
51.3% (254)
Women who did not give birth in the past 12 months Now married:
35.9% (2,401)Unmarried:
64.1% (4,288)
Marital status - Hispanic or Latino population 15 years and over
Males 59.4% Never married29.6% Now married0.3% Separated0.3% Widowed10.5% DivorcedFemales 50.0% Never married32.8% Now married1.0% Separated2.1% Widowed14.2% DivorcedWomen who gave birth in the past 12 months Now married:
65.8% (26)Unmarried:
34.2% (14)
Women who did not give birth in the past 12 months Now married:
29.3% (281)Unmarried:
70.7% (676)
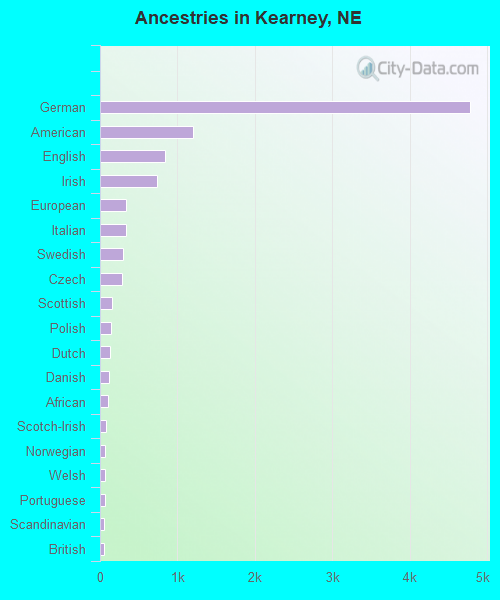
Ancestries in Kearney
4,787 33.0% German1,208 8.3% American839 5.8% English737 5.1% Irish339 2.3% European331 2.3% Italian291 2.0% Swedish289 2.0% Czech155 1.1% Scottish136 0.9% Polish132 0.9% Dutch120 0.8% Danish102 0.7% African81 0.6% Scotch-Irish70 0.5% Norwegian63 0.4% Welsh60 0.4% Portuguese50 0.3% Scandinavian46 0.3% British39 0.3% Lebanese36 0.2% French30 0.2% French Canadian26 0.2% Austrian25 0.2% Palestinian22 0.2% Czechoslovakian17 0.1% Finnish16 0.1% Greek16 0.1% Trinidadian and Tobagonian15 0.1% Armenian13 0.09% Australian13 0.09% German Russian12 0.08% Cajun11 0.08% Haitian10 0.07% Russian8 0.06% Assyrian7 0.05% Pennsylvania German5 0.03% Eastern European
Geographical mobility in Kearney Same house 1 year ago 22,198 79.4% White (Caucasian)211 53.8% Black or African American203 91.5% American Indian / Alaska Native570 74.4% Asian1,668 83.4% Other race1,598 77.7% Two or more races21,813 79.4% White alone, not Hispanic / Latino3,099 85.4% Hispanic or LatinoMoved within same county 2,774 9.9% White / Caucasian107 27.3% Black or African American7 3.2% American Indian / Alaska Native51 6.7% Asian217 10.9% Other race222 10.8% Two or more races2,747 10.0% White alone, not Hispanic / Latino291 8.0% Hispanic or LatinoMoved within same state 2,260 8.1% White / Caucasian27 6.9% Black or African American14 6.3% American Indian / Alaska Native18 2.3% Asian65 3.3% Other race115 5.6% Two or more races2,256 8.2% White alone, not Hispanic / Latino140 3.8% Hispanic or LatinoMoved from different state 331 1.2% White / Caucasian10 1.2% Asian18 0.9% Other race31 1.5% Two or more races293 1.1% White alone, not Hispanic / Latino47 1.3% Hispanic or LatinoMoved from abroad 17 0.1% White133 17.4% Asian11 0.0% White alone, not Hispanic / Latino10 0.3% Hispanic or Latino
Children Nativity (place of birth) in Kearney
Children under 6 years - Living with two parents Both parents native 1,188 100.0% NativeBoth parents foreign-born 150 100.0% NativeOne native, one foreign-born parent 63 100.0% NativeChildren under 6 years - Living with one parent Native parent 768 100.0% NativeForeign-born parent 33 100.0% NativeChildren 6 to 17 years - Living with two parents Both parents native 2,359 99.6% Native9 0.4% Foreign-bornBoth parents foreign-born 380 91.1% Native37 8.9% Foreign-bornOne native, one foreign-born parent 162 100.0% NativeChildren 6 to 17 years - Living with one parent Native parent 1,353 100.0% NativeForeign-born parent 194 52.9% Native173 47.1% Foreign-born
Grandparents responsible for own grandchildren in Kearney
Grandparents (30 to 59 years) White / Caucasian 86 78.4% Responsible for grandchildren24 21.6% Not responsible for grandchildrenOther race 26 100.0% Not responsible for grandchildrenWhite alone, not Hispanic / Latino 86 86.1% Responsible for grandchildren14 13.9% Not responsible for grandchildrenHispanic or Latino 21 100.0% Not responsible for grandchildrenGrandparents (60 years and over) White / Caucasian 62 35.5% Responsible for grandchildren113 64.5% Not responsible for grandchildrenWhite alone, not Hispanic / Latino 62 39.0% Responsible for grandchildren98 61.0% Not responsible for grandchildrenHispanic or Latino 26 100.0% Not responsible for grandchildren