Races in Ken Caryl, Colorado (CO) Detailed Stats
Data:
Races - White alone (%)
Races - White alone (% change since 2000)
Races - Black alone (%)
Races - Black alone (% change since 2000)
Races - American Indian alone (%)
Races - American Indian alone (% change since 2000)
Races - Asian alone (%)
Races - Asian alone (% change since 2000)
Races - Hispanic (%)
Races - Hispanic (% change since 2000)
Races - Native Hawaiian and Other Pacific Islander alone (%)
Races - Native Hawaiian and Other Pacific Islander alone (% change since 2000)
Races - Two or more races(%)
Races - Two or more races(% change since 2000)
Races - Other race alone (%)
Races - Other race alone (% change since 2000)
Racial diversity
Place of birth - Born in state of residence (%)
Place of birth - Born in state of residence (%) - White
Place of birth - Born in state of residence (%) - Black or African American
Place of birth - Born in state of residence (%) - Asian
Place of birth - Born in state of residence (%) - Hispanic or Latino
Place of birth - Born in state of residence (%) - American Indian and Alaska Native
Place of birth - Born in state of residence (%) - Multirace
Place of birth - Born in state of residence (%) - Other Race
Place of birth - Born in other state (%)
Place of birth - Born in other state (%) - White
Place of birth - Born in other state (%) - Black or African American
Place of birth - Born in other state (%) - Asian
Place of birth - Born in other state (%) - Hispanic or Latino
Place of birth - Born in other state (%) - American Indian and Alaska Native
Place of birth - Born in other state (%) - Multirace
Place of birth - Born in other state (%) - Other Race
Place of birth - Native, outside of US (%)
Place of birth - Native, outside of US (%) - White
Place of birth - Native, outside of US (%) - Black or African American
Place of birth - Native, outside of US (%) - Asian
Place of birth - Native, outside of US (%) - Hispanic or Latino
Place of birth - Native, outside of US (%) - American Indian and Alaska Native
Place of birth - Native, outside of US (%) - Multirace
Place of birth - Native, outside of US (%) - Other Race
Place of birth - Foreign born (%)
Place of birth - Foreign born (%) - White
Place of birth - Foreign born (%) - Black or African American
Place of birth - Foreign born (%) - Asian
Place of birth - Foreign born (%) - Hispanic or Latino
Place of birth - Foreign born (%) - American Indian and Alaska Native
Place of birth - Foreign born (%) - Multirace
Place of birth - Foreign born (%) - Other Race
Residents speaking English at home (%)
Residents speaking English at home - Born in the United States (%)
Residents speaking English at home - Native, born elsewhere (%)
Residents speaking English at home - Foreign born (%)
Residents speaking Spanish at home (%)
Residents speaking Spanish at home - Born in the United States (%)
Residents speaking Spanish at home - Native, born elsewhere (%)
Residents speaking Spanish at home - Foreign born (%)
Residents speaking other language at home (%)
Residents speaking other language at home - Born in the United States (%)
Residents speaking other language at home - Native, born elsewhere (%)
Residents speaking other language at home - Foreign born (%)
Marital status - Never married (%)
Marital status - Now married (%)
Marital status - Separated (%)
Marital status - Widowed (%)
Marital status - Divorced (%)
Ancestries Reported - Arab (%)
Ancestries Reported - Czech (%)
Ancestries Reported - Danish (%)
Ancestries Reported - Dutch (%)
Ancestries Reported - English (%)
Ancestries Reported - French (%)
Ancestries Reported - French Canadian (%)
Ancestries Reported - German (%)
Ancestries Reported - Greek (%)
Ancestries Reported - Hungarian (%)
Ancestries Reported - Irish (%)
Ancestries Reported - Italian (%)
Ancestries Reported - Lithuanian (%)
Ancestries Reported - Norwegian (%)
Ancestries Reported - Polish (%)
Ancestries Reported - Portuguese (%)
Ancestries Reported - Russian (%)
Ancestries Reported - Scotch-Irish (%)
Ancestries Reported - Scottish (%)
Ancestries Reported - Slovak (%)
Ancestries Reported - Subsaharan African (%)
Ancestries Reported - Swedish (%)
Ancestries Reported - Swiss (%)
Ancestries Reported - Ukrainian (%)
Ancestries Reported - United States (%)
Ancestries Reported - Welsh (%)
Ancestries Reported - West Indian (%)
Ancestries Reported - Other (%)
Geographical mobility - Same house 1 year ago (%)
Geographical mobility - Same house 1 year ago (%) - White
Geographical mobility - Same house 1 year ago (%) - Black or African American
Geographical mobility - Same house 1 year ago (%) - Asian
Geographical mobility - Same house 1 year ago (%) - Hispanic or Latino
Geographical mobility - Same house 1 year ago (%) - American Indian and Alaska Native
Geographical mobility - Same house 1 year ago (%) - Multirace
Geographical mobility - Same house 1 year ago (%) - Other Race
Geographical mobility - Moved within same county (%)
Geographical mobility - Moved within same county (%) - White
Geographical mobility - Moved within same county (%) - Black or African American
Geographical mobility - Moved within same county (%) - Asian
Geographical mobility - Moved within same county (%) - Hispanic or Latino
Geographical mobility - Moved within same county (%) - American Indian and Alaska Native
Geographical mobility - Moved within same county (%) - Multirace
Geographical mobility - Moved within same county (%) - Other Race
Geographical mobility - Moved from different county within same state (%)
Geographical mobility - Moved from different county within same state (%) - White
Geographical mobility - Moved from different county within same state (%) - Black or African American
Geographical mobility - Moved from different county within same state (%) - Asian
Geographical mobility - Moved from different county within same state (%) - Hispanic or Latino
Geographical mobility - Moved from different county within same state (%) - American Indian and Alaska Native
Geographical mobility - Moved from different county within same state (%) - Multirace
Geographical mobility - Moved from different county within same state (%) - Other Race
Geographical mobility - Moved from different state (%)
Geographical mobility - Moved from different state (%) - White
Geographical mobility - Moved from different state (%) - Black or African American
Geographical mobility - Moved from different state (%) - Asian
Geographical mobility - Moved from different state (%) - Hispanic or Latino
Geographical mobility - Moved from different state (%) - American Indian and Alaska Native
Geographical mobility - Moved from different state (%) - Multirace
Geographical mobility - Moved from different state (%) - Other Race
Geographical mobility - Moved from abroad (%)
Geographical mobility - Moved from abroad (%) - White
Geographical mobility - Moved from abroad (%) - Black or African American
Geographical mobility - Moved from abroad (%) - Asian
Geographical mobility - Moved from abroad (%) - Hispanic or Latino
Geographical mobility - Moved from abroad (%) - American Indian and Alaska Native
Geographical mobility - Moved from abroad (%) - Multirace
Geographical mobility - Moved from abroad (%) - Other Race
Place of birth for the foreign-born population - Ireland (%)
Place of birth for the foreign-born population - Denmark (%)
Place of birth for the foreign-born population - Norway (%)
Place of birth for the foreign-born population - Sweden (%)
Place of birth for the foreign-born population - United Kingdom (%)
Place of birth for the foreign-born population - England (%)
Place of birth for the foreign-born population - Scotland (%)
Place of birth for the foreign-born population - Other Northern Europe (%)
Place of birth for the foreign-born population - Austria (%)
Place of birth for the foreign-born population - Belgium (%)
Place of birth for the foreign-born population - France (%)
Place of birth for the foreign-born population - Germany (%)
Place of birth for the foreign-born population - Netherlands (%)
Place of birth for the foreign-born population - Switzerland (%)
Place of birth for the foreign-born population - Other Western Europe (%)
Place of birth for the foreign-born population - Greece (%)
Place of birth for the foreign-born population - Italy (%)
Place of birth for the foreign-born population - Portugal (%)
Place of birth for the foreign-born population - Spain (%)
Place of birth for the foreign-born population - Other Southern Europe (%)
Place of birth for the foreign-born population - Albania (%)
Place of birth for the foreign-born population - Belarus (%)
Place of birth for the foreign-born population - Bosnia and Herzegovina (%)
Place of birth for the foreign-born population - Bulgaria (%)
Place of birth for the foreign-born population - Croatia (%)
Place of birth for the foreign-born population - Czechoslovakia (%)
Place of birth for the foreign-born population - Hungary (%)
Place of birth for the foreign-born population - Latvia (%)
Place of birth for the foreign-born population - Lithuania (%)
Place of birth for the foreign-born population - North Macedonia (Macedonia) (%)
Place of birth for the foreign-born population - Moldova (%)
Place of birth for the foreign-born population - Poland (%)
Place of birth for the foreign-born population - Romania (%)
Place of birth for the foreign-born population - Russia (%)
Place of birth for the foreign-born population - Serbia (%)
Place of birth for the foreign-born population - Ukraine (%)
Place of birth for the foreign-born population - Other Eastern Europe (%)
Place of birth for the foreign-born population - China (%)
Place of birth for the foreign-born population - Hong Kong (%)
Place of birth for the foreign-born population - Taiwan (%)
Place of birth for the foreign-born population - Japan (%)
Place of birth for the foreign-born population - Korea (%)
Place of birth for the foreign-born population - Other Eastern Asia (%)
Place of birth for the foreign-born population - Afghanistan (%)
Place of birth for the foreign-born population - Bangladesh (%)
Place of birth for the foreign-born population - India (%)
Place of birth for the foreign-born population - Iran (%)
Place of birth for the foreign-born population - Kazakhstan (%)
Place of birth for the foreign-born population - Nepal (%)
Place of birth for the foreign-born population - Pakistan (%)
Place of birth for the foreign-born population - Sri Lanka (%)
Place of birth for the foreign-born population - Uzbekistan (%)
Place of birth for the foreign-born population - Other South Central Asia (%)
Place of birth for the foreign-born population - Burma (%)
Place of birth for the foreign-born population - Cambodia (%)
Place of birth for the foreign-born population - Indonesia (%)
Place of birth for the foreign-born population - Laos (%)
Place of birth for the foreign-born population - Malaysia (%)
Place of birth for the foreign-born population - Philippines (%)
Place of birth for the foreign-born population - Singapore (%)
Place of birth for the foreign-born population - Thailand (%)
Place of birth for the foreign-born population - Vietnam (%)
Place of birth for the foreign-born population - Other South Eastern Asia (%)
Place of birth for the foreign-born population - Armenia (%)
Place of birth for the foreign-born population - Iraq (%)
Place of birth for the foreign-born population - Israel (%)
Place of birth for the foreign-born population - Jordan (%)
Place of birth for the foreign-born population - Kuwait (%)
Place of birth for the foreign-born population - Lebanon (%)
Place of birth for the foreign-born population - Saudi Arabia (%)
Place of birth for the foreign-born population - Syria (%)
Place of birth for the foreign-born population - Turkey (%)
Place of birth for the foreign-born population - Yemen (%)
Place of birth for the foreign-born population - Other Western Asia (%)
Place of birth for the foreign-born population - Eritrea (%)
Place of birth for the foreign-born population - Ethiopia (%)
Place of birth for the foreign-born population - Kenya (%)
Place of birth for the foreign-born population - Somalia (%)
Place of birth for the foreign-born population - Uganda (%)
Place of birth for the foreign-born population - Zimbabwe (%)
Place of birth for the foreign-born population - Other Eastern Africa (%)
Place of birth for the foreign-born population - Cameroon (%)
Place of birth for the foreign-born population - Congo (%)
Place of birth for the foreign-born population - Democratic Republic of Congo (Zaire) (%)
Place of birth for the foreign-born population - Other Middle Africa (%)
Place of birth for the foreign-born population - Egypt (%)
Place of birth for the foreign-born population - Morocco (%)
Place of birth for the foreign-born population - Sudan (%)
Place of birth for the foreign-born population - Other Northern Africa (%)
Place of birth for the foreign-born population - South Africa (%)
Place of birth for the foreign-born population - Other Southern Africa (%)
Place of birth for the foreign-born population - Cabo Verde (%)
Place of birth for the foreign-born population - Ghana (%)
Place of birth for the foreign-born population - Liberia (%)
Place of birth for the foreign-born population - Nigeria (%)
Place of birth for the foreign-born population - Senegal (%)
Place of birth for the foreign-born population - Sierra Leone (%)
Place of birth for the foreign-born population - Other Western Africa (%)
Place of birth for the foreign-born population - Australia (%)
Place of birth for the foreign-born population - New Zealand (%)
Place of birth for the foreign-born population - Fiji (%)
Place of birth for the foreign-born population - Micronesia (%)
Place of birth for the foreign-born population - Bahamas (%)
Place of birth for the foreign-born population - Barbados (%)
Place of birth for the foreign-born population - Cuba (%)
Place of birth for the foreign-born population - Dominica (%)
Place of birth for the foreign-born population - Dominican Republic (%)
Place of birth for the foreign-born population - Grenada (%)
Place of birth for the foreign-born population - Haiti (%)
Place of birth for the foreign-born population - Jamaica (%)
Place of birth for the foreign-born population - St. Vincent and the Grenadines (%)
Place of birth for the foreign-born population - Trinidad and Tobago (%)
Place of birth for the foreign-born population - West Indies (%)
Place of birth for the foreign-born population - Other Caribbean (%)
Place of birth for the foreign-born population - Belize (%)
Place of birth for the foreign-born population - Costa Rica (%)
Place of birth for the foreign-born population - El Salvador (%)
Place of birth for the foreign-born population - Guatemala (%)
Place of birth for the foreign-born population - Honduras (%)
Place of birth for the foreign-born population - Mexico (%)
Place of birth for the foreign-born population - Nicaragua (%)
Place of birth for the foreign-born population - Panama (%)
Place of birth for the foreign-born population - Other Central America (%)
Place of birth for the foreign-born population - Argentina (%)
Place of birth for the foreign-born population - Bolivia (%)
Place of birth for the foreign-born population - Brazil (%)
Place of birth for the foreign-born population - Chile (%)
Place of birth for the foreign-born population - Colombia (%)
Place of birth for the foreign-born population - Ecuador (%)
Place of birth for the foreign-born population - Guyana (%)
Place of birth for the foreign-born population - Peru (%)
Place of birth for the foreign-born population - Uruguay (%)
Place of birth for the foreign-born population - Venezuela (%)
Place of birth for the foreign-born population - Other South America (%)
Place of birth for the foreign-born population - Canada (%)
Place of birth for the foreign-born population - Other Northern America (%)
Place of birth for the foreign-born population - Other (%)
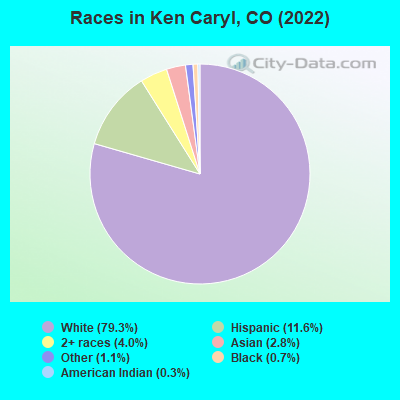
According to 2022 data, the most numerous races in Ken Caryl, CO are White alone (29,416 residents), Hispanic (3,474 residents), and Two or more races (1,463 residents). 93.3% of Ken Caryl residents speak English at home. 4.3% of Ken Caryl, CO residents are foreign-born (1.4% born in Europe, 1.4% born in Asia, 0.9% born in Latin America), which is 109.0% less than the foreign-born rate of 9.0% across the entire state of Colorado.
Race distribution in Ken Caryl
2000 2022
3,202,880 74.5% White alone 735,601 17.1% Hispanic 158,443 3.7% Black alone 93,277 2.2% Asian alone 72,721 1.7% Two or more races 28,982 0.7% American Indian alone 5,512 0.1% Other race alone 3,845 0.09% Native Hawaiian and Other
3,793,270 65.0% White alone 1,314,962 22.5% Hispanic 268,754 4.6% Two or more races 220,756 3.8% Black alone 182,658 3.1% Asian alone 29,798 0.5% Other race alone 23,389 0.4% American Indian alone 6,339 0.1% Native Hawaiian and Other
Income and house value in Ken Caryl Median household income in 2022 $125,075 White non-Hispanic householdersover $200,000 Black householders$142,638 American Indian and Alaska Native householders$144,559 Asian householdersover $200,000 Native Hawaiian and other Pacific Islander householders$141,078 Some other race householders$159,769 Two or more races householders$115,580 Hispanic or Latino race householdersMedian 2022 house value $618,345 White Non-Hispanic householders$650,191 Black or African American householders$776,580 American Indian or Alaska Native householders $648,532 Asian householders$746,392 Native Hawaiian and other Pacific Islander householders$640,570 Some other race householders$524,133 Two or more races householders$594,460 Hispanic or Latino householders
Median age by race in Ken Caryl
43.9 Median age for White residents43.2 45.5 36.4 Median age for Black or African American residents36.9 24.0 48.7 Median age for American Indian / Alaska Native residents37.1 54.6 40.5 Median age for Asian residents43.6 37.4 63.0 Median age for Native Hawaiian / Pacific Islander residents27.2 Median age for Other race residents24.5 41.0 21.0 Median age for Two or more races residents23.2 17.1 44.2 Median age for White alone residents43.0 44.9 27.7 Median age for Hispanic or Latino residents27.7 28.2
Owner/renter occupied households by race in Ken Caryl
House owners and renters - White residents 10,694 83.3% Owner occupied2,142 16.7% Renter occupiedHouse owners and renters - Black or African American residents 96 100.0% Owner occupiedHouse owners and renters - American Indian / Alaska Native residents 34 59.0% Owner occupied24 41.0% Renter occupiedHouse owners and renters - Asian residents 183 75.1% Owner occupied61 24.9% Renter occupiedHouse owners and renters - Other race residents 56 48.7% Owner occupied60 51.3% Renter occupiedHouse owners and renters - Two or more races residents 512 64.7% Owner occupied279 35.3% Renter occupiedHouse owners and renters - White alone residents 10,484 84.1% Owner occupied1,975 15.9% Renter occupiedHouse owners and renters - Hispanic or Latino residents 723 64.9% Owner occupied392 35.1% Renter occupied
Language usage in Ken Caryl
English speakers - Total 93.3% of residents of Ken Caryl speak English at home.
3.3% of residents speak Spanish at home 828 76.7% Speak English very well252 23.3% Speak English less than very well4.0% of residents speak other language at home 969 73.3% Speak English very well353 26.7% Speak English less than very well
English speakers - Born in the United States 96.4% of residents of Ken Caryl speak English at home.
2.3% of residents speak Spanish at home 258 67.0% Speak English very well127 33.0% Speak English less than very well1.3% of residents speak other language at home 202 92.2% Speak English very well17 7.8% Speak English less than very well
English speakers - Native, born elsewhere 70.0% of residents of Ken Caryl speak English at home.
4.6% of residents speak Spanish at home 10 52.6% Speak English very well9 47.4% Speak English less than very well22.5% of residents speak other language at home 93 100.0% Speak English very well
English speakers - Foreign-born 37.8% of residents of Ken Caryl speak English at home.
17.1% of residents speak Spanish at home 206 79.8% Speak English very well52 20.2% Speak English less than very well48.3% of residents speak other language at home 433 59.3% Speak English very well297 40.7% Speak English less than very well
White (Caucasian) - Speak only English Native:
98.6% (27,379)Foreign-born:
77.8% (418)
White (Caucasian) - Speak another language Native:
2.7% (742)Foreign-born:
44.4% (238)
Black or African American - Speak only English Native:
98.2% (165)Foreign-born:
91.1% (15)
Asian - Speak only English Native:
73.9% (255)Foreign-born:
16.4% (73)
Asian - Speak another language Native:
26.4% (91)Foreign-born:
84.0% (373)
Other race - Speak only English Native:
48.6% (247)Foreign-born:
6.5% (16)
Other race - Speak another language Native:
56.3% (286)Foreign-born:
92.3% (228)
Two or more races - Speak only English Native:
81.7% (2,283)Foreign-born:
23.6% (21)
Two or more races - Speak another language Native:
13.8% (385)Foreign-born:
49.8% (45)
White alone - Speak only English Native:
97.5% (26,350)Foreign-born:
56.1% (410)
White alone - Speak another language Native:
2.5% (668)Foreign-born:
44.4% (325)
Hispanic or Latino - Speak another language Native:
19.7% (574)Foreign-born:
94.3% (231)
Foreign-born residents in Ken Caryl 1,529 residents are foreign born (1.4% Europe , 1.4% Asia , 0.9% Latin America ).
This city:
4.3%Colorado:
100.0%
Marital status for residents in Ken Caryl Marital status - White (Caucasian) population 15 years and over
Males 27.3% Never married59.9% Now married1.0% Separated1.3% Widowed10.6% DivorcedFemales 19.8% Never married55.9% Now married1.1% Separated6.2% Widowed17.1% DivorcedWomen who gave birth in the past 12 months Now married:
78.2% (207)Unmarried:
21.8% (58)
Women who did not give birth in the past 12 months Now married:
49.4% (3,034)Unmarried:
50.6% (3,107)
Marital status - Black or African American population 15 years and over
Males 33.6% Never married59.8% Now married0.0% Separated0.0% Widowed6.5% DivorcedFemales 79.0% Never married21.0% Now married0.0% Separated0.0% Widowed0.0% DivorcedWomen who did not give birth in the past 12 months Now married:
0.0% (0)Unmarried:
100.0% (45)
Marital status - American Indian / Alaska Native population 15 years and over
Males 4.8% Never married95.2% Now married0.0% Separated0.0% Widowed0.0% DivorcedFemales 52.4% Never married0.0% Now married0.0% Separated0.0% Widowed47.6% DivorcedWomen who did not give birth in the past 12 months Now married:
0.0% (0)Unmarried:
100.0% (25)
Marital status - Asian population 15 years and over
Males 33.6% Never married52.5% Now married0.0% Separated8.1% Widowed5.8% DivorcedFemales 15.8% Never married78.6% Now married0.0% Separated0.0% Widowed5.5% DivorcedWomen who gave birth in the past 12 months Now married:
100.0% (9)Unmarried:
0.0% (0)
Women who did not give birth in the past 12 months Now married:
77.2% (267)Unmarried:
22.8% (79)
Marital status - Other race population 15 years and over
Males 53.5% Never married39.4% Now married0.0% Separated0.0% Widowed7.1% DivorcedFemales 49.4% Never married25.3% Now married8.2% Separated8.8% Widowed8.2% DivorcedWomen who gave birth in the past 12 months Now married:
0.0% (0)Unmarried:
100.0% (42)
Women who did not give birth in the past 12 months Now married:
37.5% (37)Unmarried:
62.5% (61)
Marital status - Two or more races population 15 years and over
Males 43.1% Never married53.1% Now married0.0% Separated0.0% Widowed3.8% DivorcedFemales 30.8% Never married69.2% Now married0.0% Separated0.0% Widowed0.0% DivorcedWomen who gave birth in the past 12 months Now married:
100.0% (152)Unmarried:
0.0% (0)
Women who did not give birth in the past 12 months Now married:
51.4% (322)Unmarried:
48.6% (305)
Marital status - White alone, not Hispanic / Latino population 15 years and over
Males 27.2% Never married59.6% Now married1.0% Separated1.4% Widowed10.8% DivorcedFemales 19.2% Never married56.3% Now married1.0% Separated6.5% Widowed17.0% DivorcedWomen who gave birth in the past 12 months Now married:
75.7% (172)Unmarried:
24.3% (55)
Women who did not give birth in the past 12 months Now married:
50.4% (3,080)Unmarried:
49.6% (3,027)
Marital status - Hispanic or Latino population 15 years and over
Males 35.1% Never married57.8% Now married0.0% Separated0.0% Widowed7.2% DivorcedFemales 31.1% Never married47.3% Now married2.4% Separated3.0% Widowed16.2% DivorcedWomen who gave birth in the past 12 months Now married:
55.9% (56)Unmarried:
44.1% (44)
Women who did not give birth in the past 12 months Now married:
39.9% (283)Unmarried:
60.1% (426)
Ancestries in Ken Caryl
2,412 17.7% German1,427 10.5% English1,191 8.7% American976 7.2% Irish860 6.3% European508 3.7% Italian388 2.8% Norwegian328 2.4% Scottish277 2.0% Polish209 1.5% Dutch205 1.5% Swedish130 1.0% French126 0.9% British111 0.8% Ghanaian110 0.8% Scotch-Irish105 0.8% Scandinavian90 0.7% Welsh84 0.6% Portuguese73 0.5% Russian72 0.5% Lithuanian72 0.5% Ukrainian65 0.5% Canadian60 0.4% Brazilian58 0.4% Czech55 0.4% Finnish50 0.4% Danish48 0.4% Northern European44 0.3% Eastern European35 0.3% Hungarian34 0.2% Czechoslovakian33 0.2% Bulgarian27 0.2% South African24 0.2% French Canadian23 0.2% Swiss21 0.2% Romanian21 0.2% Turkish18 0.1% Nigerian17 0.1% Australian17 0.1% Slavic14 0.1% Croatian12 0.09% Slovene11 0.08% Lebanese9 0.07% Greek6 0.04% Slovak1 0.01% African
Geographical mobility in Ken Caryl Same house 1 year ago 25,634 88.1% White (Caucasian)168 89.3% Black or African American90 87.8% American Indian / Alaska Native801 83.5% Asian30 94.1% Native Hawaiian / Pacific Islander689 89.7% Other race2,962 98.0% Two or more races25,368 88.4% White alone, not Hispanic / Latino2,798 87.8% Hispanic or LatinoMoved within same county 1,409 4.8% White / Caucasian21 11.2% Black or African American136 14.2% Asian69 2.3% Two or more races1,468 5.1% White alone, not Hispanic / Latino169 5.3% Hispanic or LatinoMoved within same state 1,173 4.0% White / Caucasian14 13.2% American Indian / Alaska Native7 0.7% Asian60 2.0% Two or more races996 3.5% White alone, not Hispanic / Latino144 4.5% Hispanic or LatinoMoved from different state 957 3.3% White / Caucasian2 1.0% Black or African American53 6.9% Other race39 1.3% Two or more races949 3.3% White alone, not Hispanic / Latino85 2.7% Hispanic or LatinoMoved from abroad 5 0.0% White28 2.9% Asian10 0.0% White alone, not Hispanic / Latino
Children Nativity (place of birth) in Ken Caryl
Children under 6 years - Living with two parents Both parents native 1,652 100.0% NativeBoth parents foreign-born 41 75.3% Native13 24.7% Foreign-bornOne native, one foreign-born parent 270 100.0% NativeChildren under 6 years - Living with one parent Native parent 300 100.0% NativeForeign-born parent 16 100.0% NativeChildren 6 to 17 years - Living with two parents Both parents native 3,311 100.0% Native0 0.0% Foreign-bornBoth parents foreign-born 37 44.4% Native46 55.6% Foreign-bornOne native, one foreign-born parent 273 100.0% NativeChildren 6 to 17 years - Living with one parent Native parent 1,199 100.0% NativeForeign-born parent 210 51.7% Native196 48.3% Foreign-born
Grandparents responsible for own grandchildren in Ken Caryl
Grandparents (30 to 59 years) White / Caucasian 66 77.7% Responsible for grandchildren19 22.3% Not responsible for grandchildrenOther race 12 100.0% Not responsible for grandchildrenWhite alone, not Hispanic / Latino 65 72.0% Responsible for grandchildren26 28.0% Not responsible for grandchildrenHispanic or Latino 11 100.0% Not responsible for grandchildrenGrandparents (60 years and over) White / Caucasian 41 13.7% Responsible for grandchildren258 86.3% Not responsible for grandchildrenOther race 4 100.0% Not responsible for grandchildrenWhite alone, not Hispanic / Latino 30 9.3% Responsible for grandchildren293 90.7% Not responsible for grandchildrenHispanic or Latino 20 42.0% Responsible for grandchildren28 58.0% Not responsible for grandchildren