Races in Kendall, Florida (FL) Detailed Stats
Data:
Races - White alone (%)
Races - White alone (% change since 2000)
Races - Black alone (%)
Races - Black alone (% change since 2000)
Races - American Indian alone (%)
Races - American Indian alone (% change since 2000)
Races - Asian alone (%)
Races - Asian alone (% change since 2000)
Races - Hispanic (%)
Races - Hispanic (% change since 2000)
Races - Native Hawaiian and Other Pacific Islander alone (%)
Races - Native Hawaiian and Other Pacific Islander alone (% change since 2000)
Races - Two or more races(%)
Races - Two or more races(% change since 2000)
Races - Other race alone (%)
Races - Other race alone (% change since 2000)
Racial diversity
Place of birth - Born in state of residence (%)
Place of birth - Born in state of residence (%) - White
Place of birth - Born in state of residence (%) - Black or African American
Place of birth - Born in state of residence (%) - Asian
Place of birth - Born in state of residence (%) - Hispanic or Latino
Place of birth - Born in state of residence (%) - American Indian and Alaska Native
Place of birth - Born in state of residence (%) - Multirace
Place of birth - Born in state of residence (%) - Other Race
Place of birth - Born in other state (%)
Place of birth - Born in other state (%) - White
Place of birth - Born in other state (%) - Black or African American
Place of birth - Born in other state (%) - Asian
Place of birth - Born in other state (%) - Hispanic or Latino
Place of birth - Born in other state (%) - American Indian and Alaska Native
Place of birth - Born in other state (%) - Multirace
Place of birth - Born in other state (%) - Other Race
Place of birth - Native, outside of US (%)
Place of birth - Native, outside of US (%) - White
Place of birth - Native, outside of US (%) - Black or African American
Place of birth - Native, outside of US (%) - Asian
Place of birth - Native, outside of US (%) - Hispanic or Latino
Place of birth - Native, outside of US (%) - American Indian and Alaska Native
Place of birth - Native, outside of US (%) - Multirace
Place of birth - Native, outside of US (%) - Other Race
Place of birth - Foreign born (%)
Place of birth - Foreign born (%) - White
Place of birth - Foreign born (%) - Black or African American
Place of birth - Foreign born (%) - Asian
Place of birth - Foreign born (%) - Hispanic or Latino
Place of birth - Foreign born (%) - American Indian and Alaska Native
Place of birth - Foreign born (%) - Multirace
Place of birth - Foreign born (%) - Other Race
Residents speaking English at home (%)
Residents speaking English at home - Born in the United States (%)
Residents speaking English at home - Native, born elsewhere (%)
Residents speaking English at home - Foreign born (%)
Residents speaking Spanish at home (%)
Residents speaking Spanish at home - Born in the United States (%)
Residents speaking Spanish at home - Native, born elsewhere (%)
Residents speaking Spanish at home - Foreign born (%)
Residents speaking other language at home (%)
Residents speaking other language at home - Born in the United States (%)
Residents speaking other language at home - Native, born elsewhere (%)
Residents speaking other language at home - Foreign born (%)
Marital status - Never married (%)
Marital status - Now married (%)
Marital status - Separated (%)
Marital status - Widowed (%)
Marital status - Divorced (%)
Ancestries Reported - Arab (%)
Ancestries Reported - Czech (%)
Ancestries Reported - Danish (%)
Ancestries Reported - Dutch (%)
Ancestries Reported - English (%)
Ancestries Reported - French (%)
Ancestries Reported - French Canadian (%)
Ancestries Reported - German (%)
Ancestries Reported - Greek (%)
Ancestries Reported - Hungarian (%)
Ancestries Reported - Irish (%)
Ancestries Reported - Italian (%)
Ancestries Reported - Lithuanian (%)
Ancestries Reported - Norwegian (%)
Ancestries Reported - Polish (%)
Ancestries Reported - Portuguese (%)
Ancestries Reported - Russian (%)
Ancestries Reported - Scotch-Irish (%)
Ancestries Reported - Scottish (%)
Ancestries Reported - Slovak (%)
Ancestries Reported - Subsaharan African (%)
Ancestries Reported - Swedish (%)
Ancestries Reported - Swiss (%)
Ancestries Reported - Ukrainian (%)
Ancestries Reported - United States (%)
Ancestries Reported - Welsh (%)
Ancestries Reported - West Indian (%)
Ancestries Reported - Other (%)
Geographical mobility - Same house 1 year ago (%)
Geographical mobility - Same house 1 year ago (%) - White
Geographical mobility - Same house 1 year ago (%) - Black or African American
Geographical mobility - Same house 1 year ago (%) - Asian
Geographical mobility - Same house 1 year ago (%) - Hispanic or Latino
Geographical mobility - Same house 1 year ago (%) - American Indian and Alaska Native
Geographical mobility - Same house 1 year ago (%) - Multirace
Geographical mobility - Same house 1 year ago (%) - Other Race
Geographical mobility - Moved within same county (%)
Geographical mobility - Moved within same county (%) - White
Geographical mobility - Moved within same county (%) - Black or African American
Geographical mobility - Moved within same county (%) - Asian
Geographical mobility - Moved within same county (%) - Hispanic or Latino
Geographical mobility - Moved within same county (%) - American Indian and Alaska Native
Geographical mobility - Moved within same county (%) - Multirace
Geographical mobility - Moved within same county (%) - Other Race
Geographical mobility - Moved from different county within same state (%)
Geographical mobility - Moved from different county within same state (%) - White
Geographical mobility - Moved from different county within same state (%) - Black or African American
Geographical mobility - Moved from different county within same state (%) - Asian
Geographical mobility - Moved from different county within same state (%) - Hispanic or Latino
Geographical mobility - Moved from different county within same state (%) - American Indian and Alaska Native
Geographical mobility - Moved from different county within same state (%) - Multirace
Geographical mobility - Moved from different county within same state (%) - Other Race
Geographical mobility - Moved from different state (%)
Geographical mobility - Moved from different state (%) - White
Geographical mobility - Moved from different state (%) - Black or African American
Geographical mobility - Moved from different state (%) - Asian
Geographical mobility - Moved from different state (%) - Hispanic or Latino
Geographical mobility - Moved from different state (%) - American Indian and Alaska Native
Geographical mobility - Moved from different state (%) - Multirace
Geographical mobility - Moved from different state (%) - Other Race
Geographical mobility - Moved from abroad (%)
Geographical mobility - Moved from abroad (%) - White
Geographical mobility - Moved from abroad (%) - Black or African American
Geographical mobility - Moved from abroad (%) - Asian
Geographical mobility - Moved from abroad (%) - Hispanic or Latino
Geographical mobility - Moved from abroad (%) - American Indian and Alaska Native
Geographical mobility - Moved from abroad (%) - Multirace
Geographical mobility - Moved from abroad (%) - Other Race
Place of birth for the foreign-born population - Ireland (%)
Place of birth for the foreign-born population - Denmark (%)
Place of birth for the foreign-born population - Norway (%)
Place of birth for the foreign-born population - Sweden (%)
Place of birth for the foreign-born population - United Kingdom (%)
Place of birth for the foreign-born population - England (%)
Place of birth for the foreign-born population - Scotland (%)
Place of birth for the foreign-born population - Other Northern Europe (%)
Place of birth for the foreign-born population - Austria (%)
Place of birth for the foreign-born population - Belgium (%)
Place of birth for the foreign-born population - France (%)
Place of birth for the foreign-born population - Germany (%)
Place of birth for the foreign-born population - Netherlands (%)
Place of birth for the foreign-born population - Switzerland (%)
Place of birth for the foreign-born population - Other Western Europe (%)
Place of birth for the foreign-born population - Greece (%)
Place of birth for the foreign-born population - Italy (%)
Place of birth for the foreign-born population - Portugal (%)
Place of birth for the foreign-born population - Spain (%)
Place of birth for the foreign-born population - Other Southern Europe (%)
Place of birth for the foreign-born population - Albania (%)
Place of birth for the foreign-born population - Belarus (%)
Place of birth for the foreign-born population - Bosnia and Herzegovina (%)
Place of birth for the foreign-born population - Bulgaria (%)
Place of birth for the foreign-born population - Croatia (%)
Place of birth for the foreign-born population - Czechoslovakia (%)
Place of birth for the foreign-born population - Hungary (%)
Place of birth for the foreign-born population - Latvia (%)
Place of birth for the foreign-born population - Lithuania (%)
Place of birth for the foreign-born population - North Macedonia (Macedonia) (%)
Place of birth for the foreign-born population - Moldova (%)
Place of birth for the foreign-born population - Poland (%)
Place of birth for the foreign-born population - Romania (%)
Place of birth for the foreign-born population - Russia (%)
Place of birth for the foreign-born population - Serbia (%)
Place of birth for the foreign-born population - Ukraine (%)
Place of birth for the foreign-born population - Other Eastern Europe (%)
Place of birth for the foreign-born population - China (%)
Place of birth for the foreign-born population - Hong Kong (%)
Place of birth for the foreign-born population - Taiwan (%)
Place of birth for the foreign-born population - Japan (%)
Place of birth for the foreign-born population - Korea (%)
Place of birth for the foreign-born population - Other Eastern Asia (%)
Place of birth for the foreign-born population - Afghanistan (%)
Place of birth for the foreign-born population - Bangladesh (%)
Place of birth for the foreign-born population - India (%)
Place of birth for the foreign-born population - Iran (%)
Place of birth for the foreign-born population - Kazakhstan (%)
Place of birth for the foreign-born population - Nepal (%)
Place of birth for the foreign-born population - Pakistan (%)
Place of birth for the foreign-born population - Sri Lanka (%)
Place of birth for the foreign-born population - Uzbekistan (%)
Place of birth for the foreign-born population - Other South Central Asia (%)
Place of birth for the foreign-born population - Burma (%)
Place of birth for the foreign-born population - Cambodia (%)
Place of birth for the foreign-born population - Indonesia (%)
Place of birth for the foreign-born population - Laos (%)
Place of birth for the foreign-born population - Malaysia (%)
Place of birth for the foreign-born population - Philippines (%)
Place of birth for the foreign-born population - Singapore (%)
Place of birth for the foreign-born population - Thailand (%)
Place of birth for the foreign-born population - Vietnam (%)
Place of birth for the foreign-born population - Other South Eastern Asia (%)
Place of birth for the foreign-born population - Armenia (%)
Place of birth for the foreign-born population - Iraq (%)
Place of birth for the foreign-born population - Israel (%)
Place of birth for the foreign-born population - Jordan (%)
Place of birth for the foreign-born population - Kuwait (%)
Place of birth for the foreign-born population - Lebanon (%)
Place of birth for the foreign-born population - Saudi Arabia (%)
Place of birth for the foreign-born population - Syria (%)
Place of birth for the foreign-born population - Turkey (%)
Place of birth for the foreign-born population - Yemen (%)
Place of birth for the foreign-born population - Other Western Asia (%)
Place of birth for the foreign-born population - Eritrea (%)
Place of birth for the foreign-born population - Ethiopia (%)
Place of birth for the foreign-born population - Kenya (%)
Place of birth for the foreign-born population - Somalia (%)
Place of birth for the foreign-born population - Uganda (%)
Place of birth for the foreign-born population - Zimbabwe (%)
Place of birth for the foreign-born population - Other Eastern Africa (%)
Place of birth for the foreign-born population - Cameroon (%)
Place of birth for the foreign-born population - Congo (%)
Place of birth for the foreign-born population - Democratic Republic of Congo (Zaire) (%)
Place of birth for the foreign-born population - Other Middle Africa (%)
Place of birth for the foreign-born population - Egypt (%)
Place of birth for the foreign-born population - Morocco (%)
Place of birth for the foreign-born population - Sudan (%)
Place of birth for the foreign-born population - Other Northern Africa (%)
Place of birth for the foreign-born population - South Africa (%)
Place of birth for the foreign-born population - Other Southern Africa (%)
Place of birth for the foreign-born population - Cabo Verde (%)
Place of birth for the foreign-born population - Ghana (%)
Place of birth for the foreign-born population - Liberia (%)
Place of birth for the foreign-born population - Nigeria (%)
Place of birth for the foreign-born population - Senegal (%)
Place of birth for the foreign-born population - Sierra Leone (%)
Place of birth for the foreign-born population - Other Western Africa (%)
Place of birth for the foreign-born population - Australia (%)
Place of birth for the foreign-born population - New Zealand (%)
Place of birth for the foreign-born population - Fiji (%)
Place of birth for the foreign-born population - Micronesia (%)
Place of birth for the foreign-born population - Bahamas (%)
Place of birth for the foreign-born population - Barbados (%)
Place of birth for the foreign-born population - Cuba (%)
Place of birth for the foreign-born population - Dominica (%)
Place of birth for the foreign-born population - Dominican Republic (%)
Place of birth for the foreign-born population - Grenada (%)
Place of birth for the foreign-born population - Haiti (%)
Place of birth for the foreign-born population - Jamaica (%)
Place of birth for the foreign-born population - St. Vincent and the Grenadines (%)
Place of birth for the foreign-born population - Trinidad and Tobago (%)
Place of birth for the foreign-born population - West Indies (%)
Place of birth for the foreign-born population - Other Caribbean (%)
Place of birth for the foreign-born population - Belize (%)
Place of birth for the foreign-born population - Costa Rica (%)
Place of birth for the foreign-born population - El Salvador (%)
Place of birth for the foreign-born population - Guatemala (%)
Place of birth for the foreign-born population - Honduras (%)
Place of birth for the foreign-born population - Mexico (%)
Place of birth for the foreign-born population - Nicaragua (%)
Place of birth for the foreign-born population - Panama (%)
Place of birth for the foreign-born population - Other Central America (%)
Place of birth for the foreign-born population - Argentina (%)
Place of birth for the foreign-born population - Bolivia (%)
Place of birth for the foreign-born population - Brazil (%)
Place of birth for the foreign-born population - Chile (%)
Place of birth for the foreign-born population - Colombia (%)
Place of birth for the foreign-born population - Ecuador (%)
Place of birth for the foreign-born population - Guyana (%)
Place of birth for the foreign-born population - Peru (%)
Place of birth for the foreign-born population - Uruguay (%)
Place of birth for the foreign-born population - Venezuela (%)
Place of birth for the foreign-born population - Other South America (%)
Place of birth for the foreign-born population - Canada (%)
Place of birth for the foreign-born population - Other Northern America (%)
Place of birth for the foreign-born population - Other (%)
Latest news about races in Kendall, FL collected exclusively by city-data.com from local newspapers, TV, and radio stations
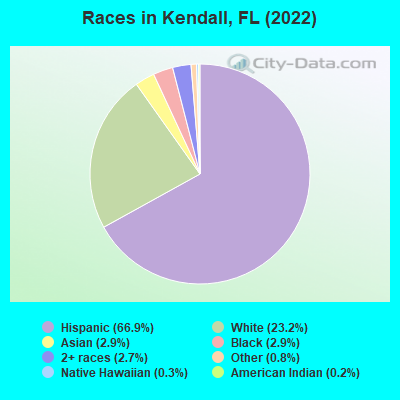
According to 2022 data, the most numerous races in Kendall, FL are White alone (18,770 residents), Hispanic (54,150 residents), and Black alone (2,359 residents). 34.3% of Kendall residents speak English at home. 45.3% of Kendall, FL residents are foreign-born (38.7% born in Latin America), which is 53.6% greater than the foreign-born rate of 21.0% across the entire state of Florida.
Race distribution in Kendall
2000 2022
10,458,509 65.4% White alone 2,682,715 16.8% Hispanic 2,264,268 14.2% Black alone 261,693 1.6% Asian alone 236,954 1.5% Two or more races 42,358 0.3% American Indian alone 28,994 0.2% Other race alone 6,887 0.04% Native Hawaiian and Other
11,309,403 50.8% White alone 6,025,039 27.1% Hispanic 3,241,015 14.6% Black alone 861,630 3.9% Two or more races 623,692 2.8% Asian alone 152,054 0.7% Other race alone 22,504 0.1% American Indian alone 9,486 0.04% Native Hawaiian and Other
Income and house value in Kendall Median household income in 2022 $106,961 White non-Hispanic householders$91,617 Black householders$81,474 Asian householders$77,943 Some other race householders$84,950 Two or more races householders$85,020 Hispanic or Latino race householdersMedian 2022 house value $696,262 White Non-Hispanic householders$672,660 Black or African American householders$517,343 American Indian or Alaska Native householders $654,007 Asian householders$569,115 Some other race householders$636,115 Two or more races householders$642,206 Hispanic or Latino householders
Median age by race in Kendall
36.5 Median age for White residents34.2 40.3 61.6 Median age for Black or African American residents61.9 61.4 -666,666,666.0 Median age for American Indian / Alaska Native residents-666,666,666.0 -666,666,666.0 26.7 Median age for Asian residents36.8 26.2 -666,666,666.0 Median age for Native Hawaiian / Pacific Islander residents-666,666,666.0 -666,666,666.0 36.2 Median age for Other race residents38.1 33.8 51.5 Median age for Two or more races residents49.4 56.2 35.5 Median age for White alone residents33.1 40.2 45.9 Median age for Hispanic or Latino residents43.0 48.9
Owner/renter occupied households by race in Kendall
House owners and renters - White residents 7,414 66.4% Owner occupied3,753 33.6% Renter occupiedHouse owners and renters - Black or African American residents 611 62.2% Owner occupied372 37.8% Renter occupiedHouse owners and renters - American Indian / Alaska Native residents 7 100.0% Owner occupiedHouse owners and renters - Asian residents 600 70.3% Owner occupied253 29.7% Renter occupiedHouse owners and renters - Other race residents 1,093 38.2% Owner occupied1,770 61.8% Renter occupiedHouse owners and renters - Two or more races residents 10,050 65.7% Owner occupied5,252 34.3% Renter occupiedHouse owners and renters - White alone residents 4,687 73.1% Owner occupied1,725 26.9% Renter occupiedHouse owners and renters - Hispanic or Latino residents 13,431 60.1% Owner occupied8,914 39.9% Renter occupied
Language usage in Kendall
English speakers - Total 34.3% of residents of Kendall speak English at home.
62.0% of residents speak Spanish at home 33,920 70.3% Speak English very well14,341 29.7% Speak English less than very well3.8% of residents speak other language at home 2,111 71.5% Speak English very well841 28.5% Speak English less than very well
English speakers - Born in the United States 66.1% of residents of Kendall speak English at home.
30.7% of residents speak Spanish at home 3,453 93.8% Speak English very well230 6.2% Speak English less than very well3.1% of residents speak other language at home 170 45.1% Speak English very well207 54.9% Speak English less than very well
English speakers - Native, born elsewhere 21.2% of residents of Kendall speak English at home.
76.5% of residents speak Spanish at home 1,877 74.5% Speak English very well643 25.5% Speak English less than very well2.3% of residents speak other language at home 75 100.0% Speak English very well
English speakers - Foreign-born 13.4% of residents of Kendall speak English at home.
80.9% of residents speak Spanish at home 16,019 56.4% Speak English very well12,392 43.6% Speak English less than very well5.7% of residents speak other language at home 1,379 68.5% Speak English very well634 31.5% Speak English less than very well
White (Caucasian) - Speak only English Native:
61.8% (13,919)Foreign-born:
15.1% (894)
White (Caucasian) - Speak another language Native:
38.2% (8,602)Foreign-born:
84.9% (5,044)
Black or African American - Speak only English Native:
80.3% (1,360)Foreign-born:
75.2% (700)
Black or African American - Speak another language Native:
19.7% (334)Foreign-born:
29.7% (276)
Asian - Speak only English Native:
20.0% (190)Foreign-born:
26.6% (342)
Asian - Speak another language Native:
80.0% (758)Foreign-born:
73.4% (946)
Other race - Speak only English Native:
17.9% (755)Foreign-born:
27.2% (1,212)
Other race - Speak another language Native:
82.1% (3,453)Foreign-born:
72.8% (3,243)
Two or more races - Speak only English Native:
41.1% (5,562)Foreign-born:
5.0% (1,108)
Two or more races - Speak another language Native:
58.9% (7,976)Foreign-born:
95.0% (21,141)
White alone - Speak only English Native:
71.4% (11,868)Foreign-born:
45.4% (711)
White alone - Speak another language Native:
28.6% (4,756)Foreign-born:
54.6% (856)
Hispanic or Latino - Speak only English Native:
31.6% (7,020)Foreign-born:
6.0% (1,795)
Hispanic or Latino - Speak another language Native:
68.4% (15,178)Foreign-born:
94.0% (28,310)
Foreign-born residents in Kendall 35,312 residents are foreign born (38.7% Latin America ).
This city:
45.3%Florida:
21.1%
Marital status for residents in Kendall Marital status - White (Caucasian) population 15 years and over
Males 40.2% Never married50.5% Now married0.2% Separated2.0% Widowed7.1% DivorcedFemales 23.5% Never married45.2% Now married4.7% Separated13.0% Widowed13.6% DivorcedWomen who gave birth in the past 12 months Now married:
67.8% (135)Unmarried:
32.2% (64)
Women who did not give birth in the past 12 months Now married:
42.3% (2,081)Unmarried:
57.7% (2,841)
Marital status - Black or African American population 15 years and over
Males 40.5% Never married41.8% Now married3.7% Separated0.0% Widowed13.9% DivorcedFemales 38.3% Never married40.5% Now married0.0% Separated4.4% Widowed16.8% DivorcedWomen who did not give birth in the past 12 months Now married:
41.3% (239)Unmarried:
58.7% (339)
Marital status - American Indian / Alaska Native population 15 years and over
Males 0.0% Never married100.0% Now married0.0% Separated0.0% Widowed0.0% DivorcedFemales 0.0% Never married100.0% Now married0.0% Separated0.0% Widowed0.0% DivorcedMarital status - Asian population 15 years and over
Males 37.2% Never married57.1% Now married0.0% Separated0.8% Widowed4.9% DivorcedFemales 45.0% Never married47.0% Now married0.0% Separated2.1% Widowed5.8% DivorcedWomen who gave birth in the past 12 months Now married:
100.0% (50)Unmarried:
0.0% (0)
Women who did not give birth in the past 12 months Now married:
23.8% (174)Unmarried:
76.2% (559)
Marital status - Other race population 15 years and over
Males 42.6% Never married52.1% Now married0.8% Separated0.9% Widowed3.6% DivorcedFemales 26.7% Never married53.0% Now married4.5% Separated10.1% Widowed5.7% DivorcedWomen who gave birth in the past 12 months Now married:
16.7% (14)Unmarried:
83.3% (70)
Women who did not give birth in the past 12 months Now married:
52.6% (846)Unmarried:
47.4% (763)
Marital status - Two or more races population 15 years and over
Males 23.5% Never married51.8% Now married1.3% Separated0.3% Widowed23.1% DivorcedFemales 25.4% Never married33.7% Now married0.5% Separated15.7% Widowed24.8% DivorcedWomen who gave birth in the past 12 months Now married:
43.4% (102)Unmarried:
56.6% (133)
Women who did not give birth in the past 12 months Now married:
34.7% (2,838)Unmarried:
65.3% (5,349)
Marital status - White alone, not Hispanic / Latino population 15 years and over
Males 46.2% Never married45.1% Now married0.3% Separated3.1% Widowed5.3% DivorcedFemales 21.2% Never married49.5% Now married2.5% Separated13.8% Widowed13.0% DivorcedWomen who gave birth in the past 12 months Now married:
86.6% (174)Unmarried:
13.4% (27)
Women who did not give birth in the past 12 months Now married:
47.3% (1,255)Unmarried:
52.7% (1,400)
Marital status - Hispanic or Latino population 15 years and over
Males 28.6% Never married52.6% Now married1.5% Separated0.2% Widowed17.2% DivorcedFemales 25.3% Never married37.4% Now married2.3% Separated14.3% Widowed20.8% DivorcedWomen who gave birth in the past 12 months Now married:
25.6% (102)Unmarried:
74.4% (296)
Women who did not give birth in the past 12 months Now married:
42.3% (5,359)Unmarried:
57.7% (7,298)
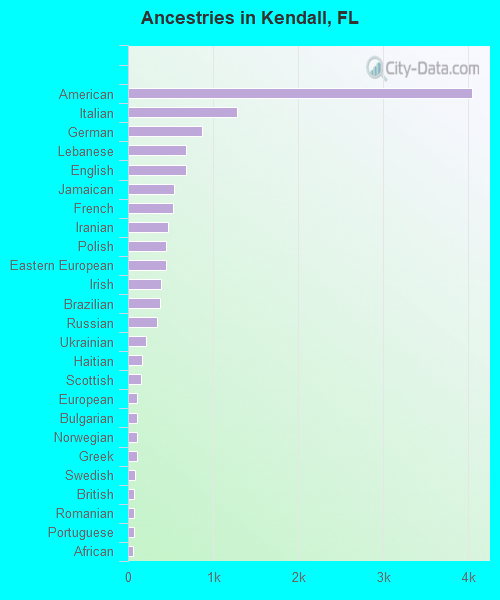
Ancestries in Kendall
4,043 8.3% American1,282 2.6% Italian865 1.8% German678 1.4% Lebanese677 1.4% English540 1.1% Jamaican524 1.1% French474 1.0% Iranian452 0.9% Polish444 0.9% Eastern European385 0.8% Irish372 0.8% Brazilian345 0.7% Russian212 0.4% Ukrainian163 0.3% Haitian147 0.3% Scottish106 0.2% European104 0.2% Bulgarian103 0.2% Norwegian101 0.2% Greek88 0.2% Swedish74 0.2% British72 0.1% Romanian66 0.1% Portuguese64 0.1% African56 0.1% Arab45 0.09% Trinidadian and Tobagonian40 0.08% Austrian40 0.08% Danish38 0.08% Hungarian33 0.07% Bermudan33 0.07% Basque33 0.07% Kenyan25 0.05% Dutch21 0.04% Latvian18 0.04% Canadian17 0.03% Lithuanian16 0.03% Welsh15 0.03% Swiss15 0.03% Albanian14 0.03% Slovak13 0.03% Belgian12 0.02% Armenian11 0.02% Scotch-Irish11 0.02% Turkish11 0.02% Bahamian11 0.02% British West Indian10 0.02% Slavic10 0.02% Barbadian9 0.02% Northern European9 0.02% South African8 0.02% Syrian7 0.01% Czech7 0.01% Moroccan6 0.01% Croatian6 0.01% French Canadian5 0.01% Finnish4 0.01% Palestinian
Geographical mobility in Kendall Same house 1 year ago 27,118 92.4% White (Caucasian)2,330 82.2% Black or African American16 100.0% American Indian / Alaska Native2,269 89.8% Asian29 100.0% Native Hawaiian / Pacific Islander5,074 80.9% Other race34,611 94.0% Two or more races16,126 90.3% White alone, not Hispanic / Latino49,514 91.4% Hispanic or LatinoMoved within same county 1,469 5.0% White / Caucasian243 8.6% Black or African American94 3.7% Asian801 12.8% Other race1,366 3.7% Two or more races1,183 6.6% White alone, not Hispanic / Latino3,341 6.2% Hispanic or LatinoMoved within same state 177 0.6% White / Caucasian6 0.2% Black or African American26 0.4% Other race406 1.1% Two or more races90 0.5% White alone, not Hispanic / Latino465 0.9% Hispanic or LatinoMoved from different state 505 1.7% White / Caucasian53 1.9% Black or African American144 5.7% Asian103 1.6% Other race81 0.2% Two or more races315 1.8% White alone, not Hispanic / Latino334 0.6% Hispanic or LatinoMoved from abroad 79 0.3% White246 8.7% Black or African American94 3.7% Asian94 1.5% Other race357 1.0% Two or more races4 0.0% White alone, not Hispanic / Latino496 0.9% Hispanic or Latino
Children Nativity (place of birth) in Kendall
Children under 6 years - Living with two parents Both parents native 1,743 100.0% NativeBoth parents foreign-born 486 74.0% Native171 26.0% Foreign-bornOne native, one foreign-born parent 673 100.0% NativeChildren under 6 years - Living with one parent Native parent 186 100.0% NativeForeign-born parent 928 100.0% NativeChildren 6 to 17 years - Living with two parents Both parents native 2,536 100.0% NativeBoth parents foreign-born 4,509 95.3% Native220 4.7% Foreign-bornOne native, one foreign-born parent 1,055 95.3% Native52 4.7% Foreign-bornChildren 6 to 17 years - Living with one parent Native parent 1,079 85.0% Native190 15.0% Foreign-bornForeign-born parent 1,126 70.6% Native468 29.4% Foreign-born
Place of birth for residents in Kendall 30,480 Americas30,324 Latin America17,991 Caribbean8,667 South America3,666 Central America2,524 Europe2,167 Asia1,228 Southern Europe906 South Central Asia824 Eastern Asia731 China612 Eastern Europe529 Western Europe245 Western Asia190 South Eastern Asia155 Northern America153 Northern Europe86 Oceania52 Africa33 Eastern Africa13 Australia and New Zealand Subregion9 Southern Africa6 Northern Africa1 Western Africa15,708 Cuba3,012 Colombia1,899 Nicaragua1,550 Peru1,513 Venezuela1,063 Spain1,009 Jamaica758 Mexico741 Dominican Republic646 China636 Honduras616 Ecuador605 Argentina546 India454 Brazil451 Bolivia333 France322 Russia271 Chile222 Iran204 Haiti178 Trinidad and Tobago136 Pakistan125 Costa Rica122 Canada122 Panama114 Germany109 Lebanon102 Italy101 El Salvador99 Saudi Arabia85 Ukraine79 Uruguay78 Japan71 Philippines65 Guyana61 Bulgaria54 Poland53 Taiwan49 Ireland48 Singapore47 Romania43 Bahamas40 Greece38 Netherlands32 United Kingdom30 Hong Kong28 Scotland27 Vietnam24 Denmark23 Laos20 Portugal20 Guatemala19 Switzerland19 Kenya13 Hungary13 Korea13 Zimbabwe12 Israel11 Sweden11 Turkey10 Belgium10 Austria10 Iraq9 Barbados9 Latvia9 Albania9 Thailand9 South Africa8 New Zealand7 Indonesia5 Morocco4 Belarus4 Australia1 Nigeria
Grandparents responsible for own grandchildren in Kendall
Grandparents (30 to 59 years) White / Caucasian 73 100.0% Not responsible for grandchildrenBlack or African American 7 48.8% Responsible for grandchildren7 51.2% Not responsible for grandchildrenTwo or more races 58 100.0% Not responsible for grandchildrenWhite alone, not Hispanic / Latino 30 100.0% Not responsible for grandchildrenHispanic or Latino 106 100.0% Not responsible for grandchildrenGrandparents (60 years and over) White / Caucasian 75 17.8% Responsible for grandchildren349 82.2% Not responsible for grandchildrenBlack or African American 21 100.0% Not responsible for grandchildrenTwo or more races 71 18.9% Responsible for grandchildren302 81.1% Not responsible for grandchildrenWhite alone, not Hispanic / Latino 126 100.0% Not responsible for grandchildrenHispanic or Latino 216 30.5% Responsible for grandchildren491 69.5% Not responsible for grandchildren