Races in Kirksville, Missouri (MO) Detailed Stats
Data:
Races - White alone (%)
Races - White alone (% change since 2000)
Races - Black alone (%)
Races - Black alone (% change since 2000)
Races - American Indian alone (%)
Races - American Indian alone (% change since 2000)
Races - Asian alone (%)
Races - Asian alone (% change since 2000)
Races - Hispanic (%)
Races - Hispanic (% change since 2000)
Races - Native Hawaiian and Other Pacific Islander alone (%)
Races - Native Hawaiian and Other Pacific Islander alone (% change since 2000)
Races - Two or more races(%)
Races - Two or more races(% change since 2000)
Races - Other race alone (%)
Races - Other race alone (% change since 2000)
Racial diversity
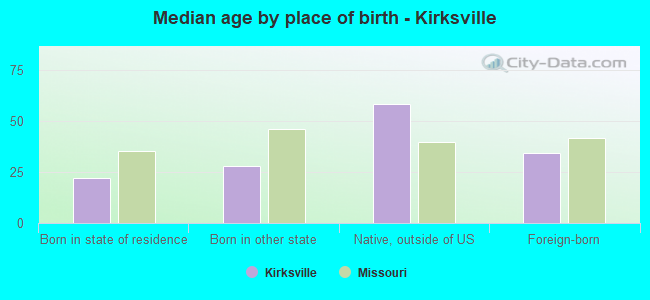
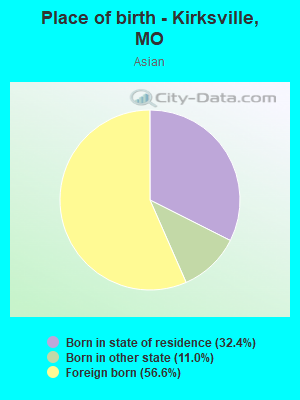
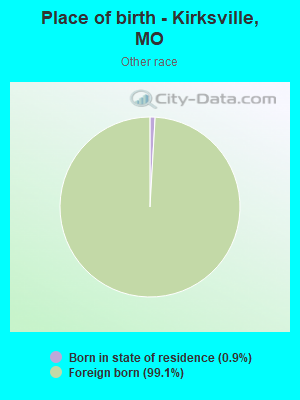
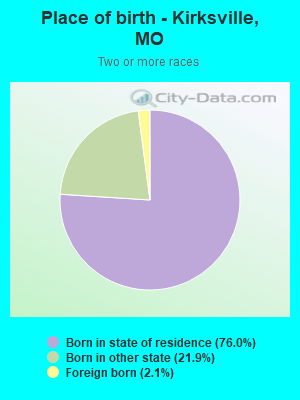
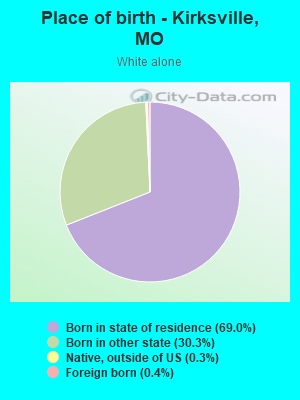
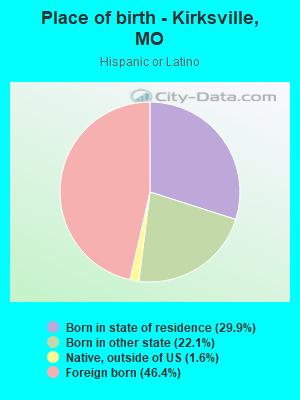
Place of birth - Born in state of residence (%)
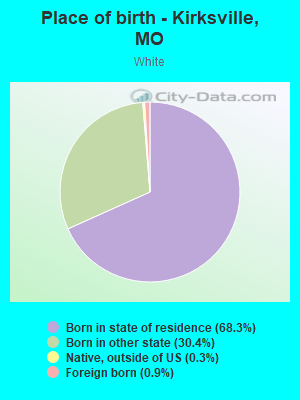
Place of birth - Born in state of residence (%) - White
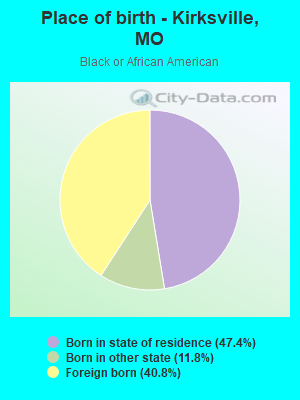
Place of birth - Born in state of residence (%) - Black or African American
Place of birth - Born in state of residence (%) - Asian
Place of birth - Born in state of residence (%) - Hispanic or Latino
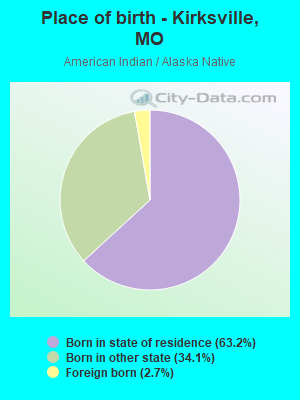
Place of birth - Born in state of residence (%) - American Indian and Alaska Native
Place of birth - Born in state of residence (%) - Multirace
Place of birth - Born in state of residence (%) - Other Race
Place of birth - Born in other state (%)
Place of birth - Born in other state (%) - White
Place of birth - Born in other state (%) - Black or African American
Place of birth - Born in other state (%) - Asian
Place of birth - Born in other state (%) - Hispanic or Latino
Place of birth - Born in other state (%) - American Indian and Alaska Native
Place of birth - Born in other state (%) - Multirace
Place of birth - Born in other state (%) - Other Race
Place of birth - Native, outside of US (%)
Place of birth - Native, outside of US (%) - White
Place of birth - Native, outside of US (%) - Black or African American
Place of birth - Native, outside of US (%) - Asian
Place of birth - Native, outside of US (%) - Hispanic or Latino
Place of birth - Native, outside of US (%) - American Indian and Alaska Native
Place of birth - Native, outside of US (%) - Multirace
Place of birth - Native, outside of US (%) - Other Race
Place of birth - Foreign born (%)
Place of birth - Foreign born (%) - White
Place of birth - Foreign born (%) - Black or African American
Place of birth - Foreign born (%) - Asian
Place of birth - Foreign born (%) - Hispanic or Latino
Place of birth - Foreign born (%) - American Indian and Alaska Native
Place of birth - Foreign born (%) - Multirace
Place of birth - Foreign born (%) - Other Race
Residents speaking English at home (%)
Residents speaking English at home - Born in the United States (%)
Residents speaking English at home - Native, born elsewhere (%)
Residents speaking English at home - Foreign born (%)
Residents speaking Spanish at home (%)
Residents speaking Spanish at home - Born in the United States (%)
Residents speaking Spanish at home - Native, born elsewhere (%)
Residents speaking Spanish at home - Foreign born (%)
Residents speaking other language at home (%)
Residents speaking other language at home - Born in the United States (%)
Residents speaking other language at home - Native, born elsewhere (%)
Residents speaking other language at home - Foreign born (%)
Marital status - Never married (%)
Marital status - Now married (%)
Marital status - Separated (%)
Marital status - Widowed (%)
Marital status - Divorced (%)
Ancestries Reported - Arab (%)
Ancestries Reported - Czech (%)
Ancestries Reported - Danish (%)
Ancestries Reported - Dutch (%)
Ancestries Reported - English (%)
Ancestries Reported - French (%)
Ancestries Reported - French Canadian (%)
Ancestries Reported - German (%)
Ancestries Reported - Greek (%)
Ancestries Reported - Hungarian (%)
Ancestries Reported - Irish (%)
Ancestries Reported - Italian (%)
Ancestries Reported - Lithuanian (%)
Ancestries Reported - Norwegian (%)
Ancestries Reported - Polish (%)
Ancestries Reported - Portuguese (%)
Ancestries Reported - Russian (%)
Ancestries Reported - Scotch-Irish (%)
Ancestries Reported - Scottish (%)
Ancestries Reported - Slovak (%)
Ancestries Reported - Subsaharan African (%)
Ancestries Reported - Swedish (%)
Ancestries Reported - Swiss (%)
Ancestries Reported - Ukrainian (%)
Ancestries Reported - United States (%)
Ancestries Reported - Welsh (%)
Ancestries Reported - West Indian (%)
Ancestries Reported - Other (%)
Geographical mobility - Same house 1 year ago (%)
Geographical mobility - Same house 1 year ago (%) - White
Geographical mobility - Same house 1 year ago (%) - Black or African American
Geographical mobility - Same house 1 year ago (%) - Asian
Geographical mobility - Same house 1 year ago (%) - Hispanic or Latino
Geographical mobility - Same house 1 year ago (%) - American Indian and Alaska Native
Geographical mobility - Same house 1 year ago (%) - Multirace
Geographical mobility - Same house 1 year ago (%) - Other Race
Geographical mobility - Moved within same county (%)
Geographical mobility - Moved within same county (%) - White
Geographical mobility - Moved within same county (%) - Black or African American
Geographical mobility - Moved within same county (%) - Asian
Geographical mobility - Moved within same county (%) - Hispanic or Latino
Geographical mobility - Moved within same county (%) - American Indian and Alaska Native
Geographical mobility - Moved within same county (%) - Multirace
Geographical mobility - Moved within same county (%) - Other Race
Geographical mobility - Moved from different county within same state (%)
Geographical mobility - Moved from different county within same state (%) - White
Geographical mobility - Moved from different county within same state (%) - Black or African American
Geographical mobility - Moved from different county within same state (%) - Asian
Geographical mobility - Moved from different county within same state (%) - Hispanic or Latino
Geographical mobility - Moved from different county within same state (%) - American Indian and Alaska Native
Geographical mobility - Moved from different county within same state (%) - Multirace
Geographical mobility - Moved from different county within same state (%) - Other Race
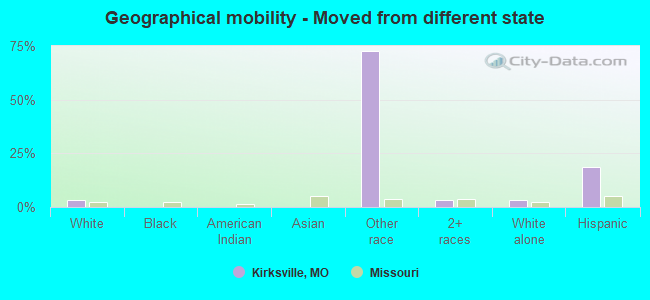
Geographical mobility - Moved from different state (%)
Geographical mobility - Moved from different state (%) - White
Geographical mobility - Moved from different state (%) - Black or African American
Geographical mobility - Moved from different state (%) - Asian
Geographical mobility - Moved from different state (%) - Hispanic or Latino
Geographical mobility - Moved from different state (%) - American Indian and Alaska Native
Geographical mobility - Moved from different state (%) - Multirace
Geographical mobility - Moved from different state (%) - Other Race
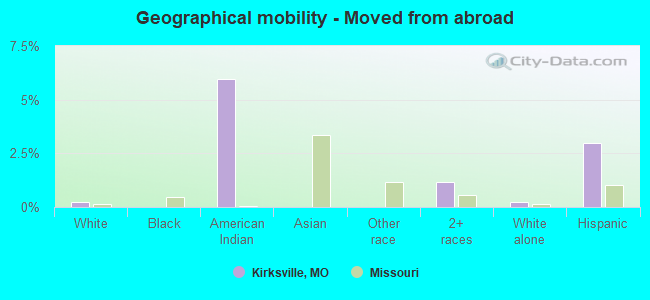
Geographical mobility - Moved from abroad (%)
Geographical mobility - Moved from abroad (%) - White
Geographical mobility - Moved from abroad (%) - Black or African American
Geographical mobility - Moved from abroad (%) - Asian
Geographical mobility - Moved from abroad (%) - Hispanic or Latino
Geographical mobility - Moved from abroad (%) - American Indian and Alaska Native
Geographical mobility - Moved from abroad (%) - Multirace
Geographical mobility - Moved from abroad (%) - Other Race
Place of birth for the foreign-born population - Ireland (%)
Place of birth for the foreign-born population - Denmark (%)
Place of birth for the foreign-born population - Norway (%)
Place of birth for the foreign-born population - Sweden (%)
Place of birth for the foreign-born population - United Kingdom (%)
Place of birth for the foreign-born population - England (%)
Place of birth for the foreign-born population - Scotland (%)
Place of birth for the foreign-born population - Other Northern Europe (%)
Place of birth for the foreign-born population - Austria (%)
Place of birth for the foreign-born population - Belgium (%)
Place of birth for the foreign-born population - France (%)
Place of birth for the foreign-born population - Germany (%)
Place of birth for the foreign-born population - Netherlands (%)
Place of birth for the foreign-born population - Switzerland (%)
Place of birth for the foreign-born population - Other Western Europe (%)
Place of birth for the foreign-born population - Greece (%)
Place of birth for the foreign-born population - Italy (%)
Place of birth for the foreign-born population - Portugal (%)
Place of birth for the foreign-born population - Spain (%)
Place of birth for the foreign-born population - Other Southern Europe (%)
Place of birth for the foreign-born population - Albania (%)
Place of birth for the foreign-born population - Belarus (%)
Place of birth for the foreign-born population - Bosnia and Herzegovina (%)
Place of birth for the foreign-born population - Bulgaria (%)
Place of birth for the foreign-born population - Croatia (%)
Place of birth for the foreign-born population - Czechoslovakia (%)
Place of birth for the foreign-born population - Hungary (%)
Place of birth for the foreign-born population - Latvia (%)
Place of birth for the foreign-born population - Lithuania (%)
Place of birth for the foreign-born population - North Macedonia (Macedonia) (%)
Place of birth for the foreign-born population - Moldova (%)
Place of birth for the foreign-born population - Poland (%)
Place of birth for the foreign-born population - Romania (%)
Place of birth for the foreign-born population - Russia (%)
Place of birth for the foreign-born population - Serbia (%)
Place of birth for the foreign-born population - Ukraine (%)
Place of birth for the foreign-born population - Other Eastern Europe (%)
Place of birth for the foreign-born population - China (%)
Place of birth for the foreign-born population - Hong Kong (%)
Place of birth for the foreign-born population - Taiwan (%)
Place of birth for the foreign-born population - Japan (%)
Place of birth for the foreign-born population - Korea (%)
Place of birth for the foreign-born population - Other Eastern Asia (%)
Place of birth for the foreign-born population - Afghanistan (%)
Place of birth for the foreign-born population - Bangladesh (%)
Place of birth for the foreign-born population - India (%)
Place of birth for the foreign-born population - Iran (%)
Place of birth for the foreign-born population - Kazakhstan (%)
Place of birth for the foreign-born population - Nepal (%)
Place of birth for the foreign-born population - Pakistan (%)
Place of birth for the foreign-born population - Sri Lanka (%)
Place of birth for the foreign-born population - Uzbekistan (%)
Place of birth for the foreign-born population - Other South Central Asia (%)
Place of birth for the foreign-born population - Burma (%)
Place of birth for the foreign-born population - Cambodia (%)
Place of birth for the foreign-born population - Indonesia (%)
Place of birth for the foreign-born population - Laos (%)
Place of birth for the foreign-born population - Malaysia (%)
Place of birth for the foreign-born population - Philippines (%)
Place of birth for the foreign-born population - Singapore (%)
Place of birth for the foreign-born population - Thailand (%)
Place of birth for the foreign-born population - Vietnam (%)
Place of birth for the foreign-born population - Other South Eastern Asia (%)
Place of birth for the foreign-born population - Armenia (%)
Place of birth for the foreign-born population - Iraq (%)
Place of birth for the foreign-born population - Israel (%)
Place of birth for the foreign-born population - Jordan (%)
Place of birth for the foreign-born population - Kuwait (%)
Place of birth for the foreign-born population - Lebanon (%)
Place of birth for the foreign-born population - Saudi Arabia (%)
Place of birth for the foreign-born population - Syria (%)
Place of birth for the foreign-born population - Turkey (%)
Place of birth for the foreign-born population - Yemen (%)
Place of birth for the foreign-born population - Other Western Asia (%)
Place of birth for the foreign-born population - Eritrea (%)
Place of birth for the foreign-born population - Ethiopia (%)
Place of birth for the foreign-born population - Kenya (%)
Place of birth for the foreign-born population - Somalia (%)
Place of birth for the foreign-born population - Uganda (%)
Place of birth for the foreign-born population - Zimbabwe (%)
Place of birth for the foreign-born population - Other Eastern Africa (%)
Place of birth for the foreign-born population - Cameroon (%)
Place of birth for the foreign-born population - Congo (%)
Place of birth for the foreign-born population - Democratic Republic of Congo (Zaire) (%)
Place of birth for the foreign-born population - Other Middle Africa (%)
Place of birth for the foreign-born population - Egypt (%)
Place of birth for the foreign-born population - Morocco (%)
Place of birth for the foreign-born population - Sudan (%)
Place of birth for the foreign-born population - Other Northern Africa (%)
Place of birth for the foreign-born population - South Africa (%)
Place of birth for the foreign-born population - Other Southern Africa (%)
Place of birth for the foreign-born population - Cabo Verde (%)
Place of birth for the foreign-born population - Ghana (%)
Place of birth for the foreign-born population - Liberia (%)
Place of birth for the foreign-born population - Nigeria (%)
Place of birth for the foreign-born population - Senegal (%)
Place of birth for the foreign-born population - Sierra Leone (%)
Place of birth for the foreign-born population - Other Western Africa (%)
Place of birth for the foreign-born population - Australia (%)
Place of birth for the foreign-born population - New Zealand (%)
Place of birth for the foreign-born population - Fiji (%)
Place of birth for the foreign-born population - Micronesia (%)
Place of birth for the foreign-born population - Bahamas (%)
Place of birth for the foreign-born population - Barbados (%)
Place of birth for the foreign-born population - Cuba (%)
Place of birth for the foreign-born population - Dominica (%)
Place of birth for the foreign-born population - Dominican Republic (%)
Place of birth for the foreign-born population - Grenada (%)
Place of birth for the foreign-born population - Haiti (%)
Place of birth for the foreign-born population - Jamaica (%)
Place of birth for the foreign-born population - St. Vincent and the Grenadines (%)
Place of birth for the foreign-born population - Trinidad and Tobago (%)
Place of birth for the foreign-born population - West Indies (%)
Place of birth for the foreign-born population - Other Caribbean (%)
Place of birth for the foreign-born population - Belize (%)
Place of birth for the foreign-born population - Costa Rica (%)
Place of birth for the foreign-born population - El Salvador (%)
Place of birth for the foreign-born population - Guatemala (%)
Place of birth for the foreign-born population - Honduras (%)
Place of birth for the foreign-born population - Mexico (%)
Place of birth for the foreign-born population - Nicaragua (%)
Place of birth for the foreign-born population - Panama (%)
Place of birth for the foreign-born population - Other Central America (%)
Place of birth for the foreign-born population - Argentina (%)
Place of birth for the foreign-born population - Bolivia (%)
Place of birth for the foreign-born population - Brazil (%)
Place of birth for the foreign-born population - Chile (%)
Place of birth for the foreign-born population - Colombia (%)
Place of birth for the foreign-born population - Ecuador (%)
Place of birth for the foreign-born population - Guyana (%)
Place of birth for the foreign-born population - Peru (%)
Place of birth for the foreign-born population - Uruguay (%)
Place of birth for the foreign-born population - Venezuela (%)
Place of birth for the foreign-born population - Other South America (%)
Place of birth for the foreign-born population - Canada (%)
Place of birth for the foreign-born population - Other Northern America (%)
Place of birth for the foreign-born population - Other (%)
Latest news about races in Kirksville, MO collected exclusively by city-data.com from local newspapers, TV, and radio stations
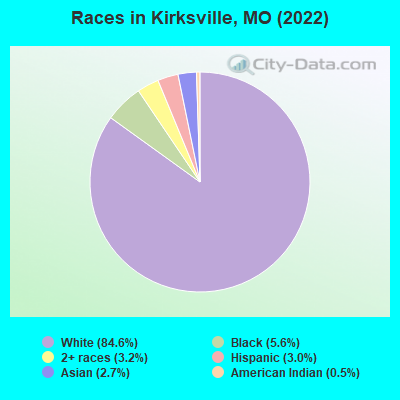
According to 2022 data, the most numerous races in Kirksville, MO are White alone (14,886 residents), Black alone (983 residents), and Two or more races (564 residents). 93.2% of Kirksville residents speak English at home. 5.5% of Kirksville, MO residents are foreign-born (2.3% born in Africa, 1.7% born in Asia, 1.4% born in Latin America), which is 27.5% greater than the foreign-born rate of 4.0% across the entire state of Missouri.
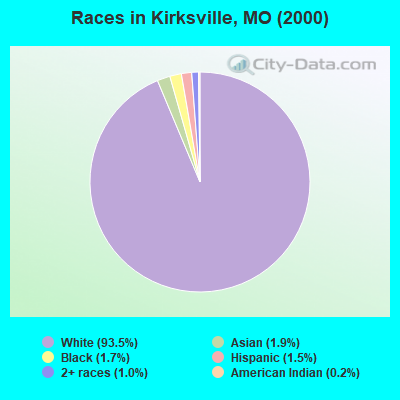
Race distribution in Kirksville
2000 2022
4,686,474 83.8% White alone 625,667 11.2% Black alone 118,592 2.1% Hispanic 71,905 1.3% Two or more races 61,041 1.1% Asian alone 23,302 0.4% American Indian alone 5,291 0.09% Other race alone 2,939 0.05% Native Hawaiian and Other
4,733,411 76.6% White alone 656,739 10.6% Black alone 316,300 5.1% Two or more races 291,763 4.7% Hispanic 132,436 2.1% Asian alone 27,467 0.4% Other race alone 12,313 0.2% American Indian alone 7,528 0.1% Native Hawaiian and Other
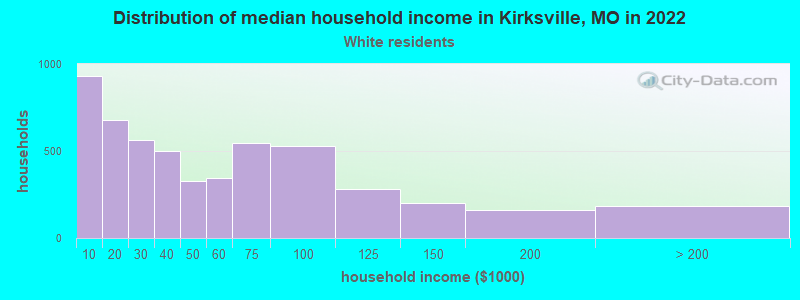
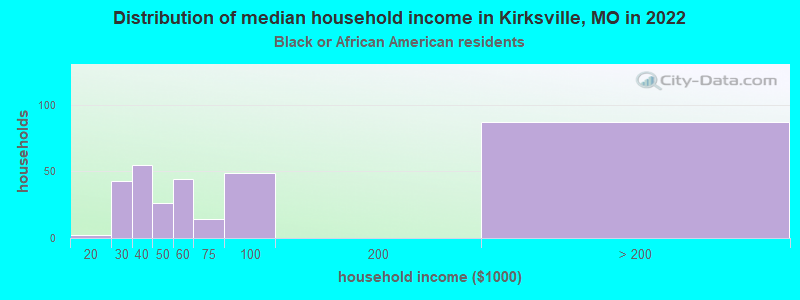
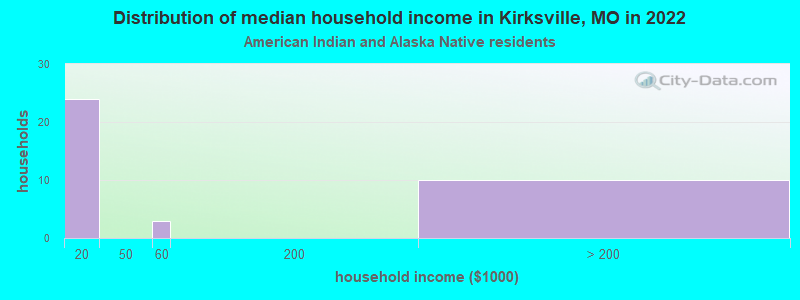
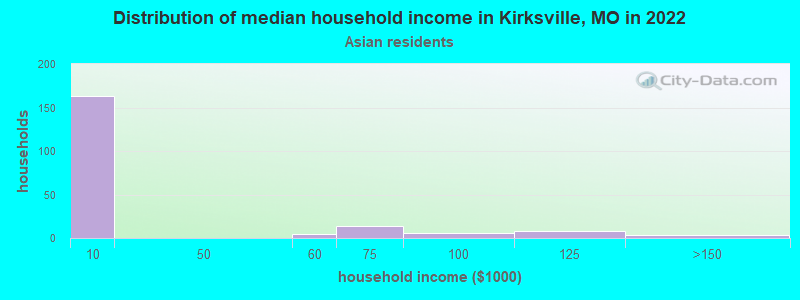
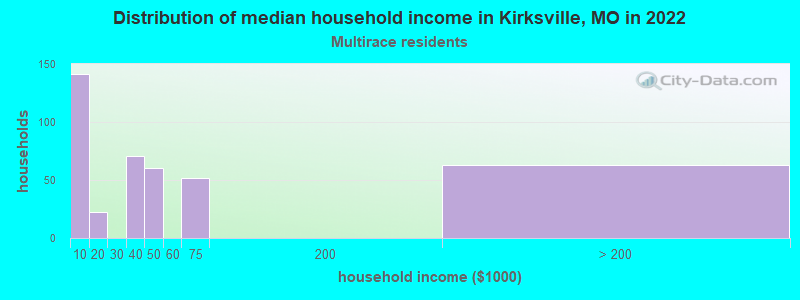
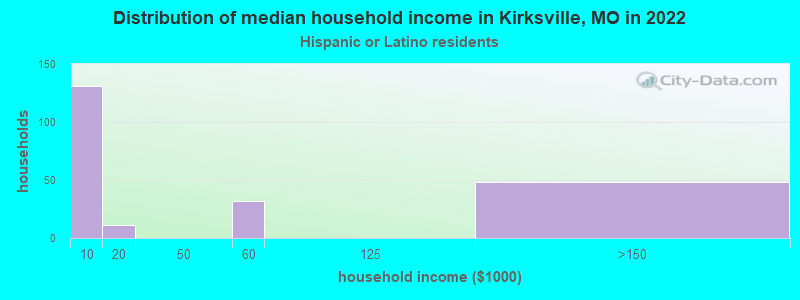
Income and house value in Kirksville Median household income in 2022 $39,938 White non-Hispanic householders$59,812 Black householders$2,317 Asian householders$37,186 Two or more races householders$2,420 Hispanic or Latino race householdersMedian 2022 house value $153,583 White Non-Hispanic householders$244,249 Black or African American householders$116,511 American Indian or Alaska Native householders $184,087 Asian householders$344,237 Two or more races householders$204,000 Hispanic or Latino householders
Median age by race in Kirksville
24.0 Median age for White residents23.9 24.1 29.2 Median age for Black or African American residents29.8 26.2 34.2 Median age for American Indian / Alaska Native residents47.3 32.0 26.7 Median age for Asian residents21.7 27.3 -693,430,656.2 Median age for Native Hawaiian / Pacific Islander residents-683,513,838.1 -752,136,751.4 37.4 Median age for Other race residents-694,252,872.9 20.0 23.6 Median age for Two or more races residents24.4 23.0 24.0 Median age for White alone residents24.0 24.2 21.8 Median age for Hispanic or Latino residents22.1 21.6
Owner/renter occupied households by race in Kirksville
House owners and renters - White residents 2,715 52.7% Owner occupied2,440 47.3% Renter occupiedHouse owners and renters - Black or African American residents 108 34.2% Owner occupied207 65.8% Renter occupiedHouse owners and renters - American Indian / Alaska Native residents 35 72.6% Owner occupied13 27.4% Renter occupiedHouse owners and renters - Asian residents 5 3.1% Owner occupied168 96.9% Renter occupiedHouse owners and renters - Other race residents 34 100.0% Renter occupiedHouse owners and renters - Two or more races residents 116 29.0% Owner occupied284 71.0% Renter occupiedHouse owners and renters - White alone residents 2,678 52.4% Owner occupied2,429 47.6% Renter occupiedHouse owners and renters - Hispanic or Latino residents 54 26.7% Owner occupied147 73.3% Renter occupied
Language usage in Kirksville
English speakers - Total 93.2% of residents of Kirksville speak English at home.
1.9% of residents speak Spanish at home 129 40.4% Speak English very well190 59.6% Speak English less than very well4.8% of residents speak other language at home 235 29.0% Speak English very well574 71.0% Speak English less than very well
English speakers - Born in the United States 97.6% of residents of Kirksville speak English at home.
0.4% of residents speak Spanish at home 21 100.0% Speak English very well1.6% of residents speak other language at home 15 18.5% Speak English very well66 81.5% Speak English less than very well
All residents speak only English at home
English speakers - Foreign-born 15.4% of residents of Kirksville speak English at home.
22.2% of residents speak Spanish at home 44 20.4% Speak English very well172 79.6% Speak English less than very well63.2% of residents speak other language at home 125 20.4% Speak English very well489 79.6% Speak English less than very well
White (Caucasian) - Speak only English Native:
99.7% (14,312)Foreign-born:
17.0% (24)
White (Caucasian) - Speak another language Native:
0.5% (69)Foreign-born:
82.6% (117)
Black or African American - Speak another language Native:
27.7% (107)Foreign-born:
99.5% (408)
American Indian / Alaska Native - Speak another language Native:
27.1% (26)Foreign-born:
100.0% (3)
Asian - Speak only English Native:
34.3% (63)Foreign-born:
38.3% (105)
Asian - Speak another language Native:
59.1% (109)Foreign-born:
61.5% (170)
Other race - Speak only English Native:
100.0% (1)Foreign-born:
33.2% (43)
Two or more races - Speak another language Native:
1.3% (10)Foreign-born:
100.0% (15)
White alone - Speak only English Native:
99.4% (14,209)Foreign-born:
38.2% (24)
White alone - Speak another language Native:
0.5% (73)Foreign-born:
60.3% (39)
Hispanic or Latino - Speak only English Native:
90.8% (261)Foreign-born:
11.4% (28)
Hispanic or Latino - Speak another language Native:
10.6% (31)Foreign-born:
88.7% (216)
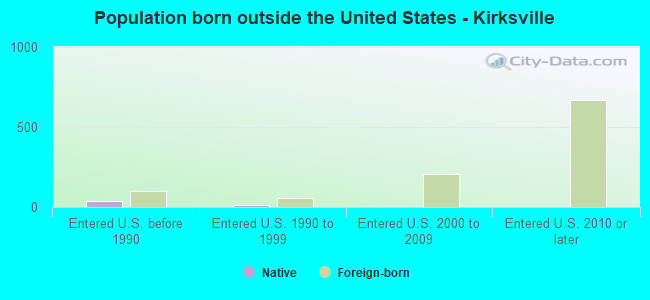
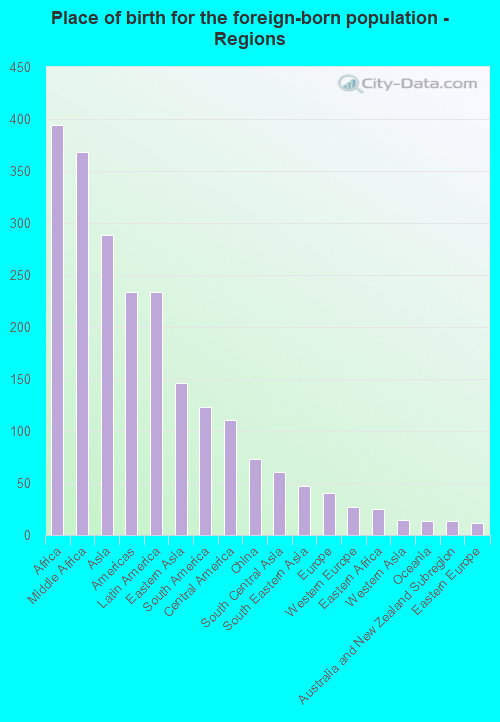
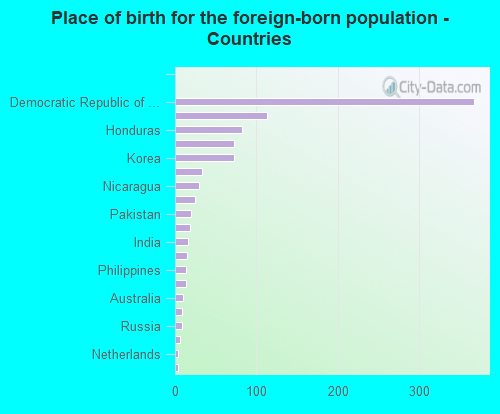
Foreign-born residents in Kirksville 971 residents are foreign born (2.3% Africa , 1.7% Asia , 1.4% Latin America ).
This city:
5.5%Missouri:
4.2%
Marital status for residents in Kirksville Marital status - White (Caucasian) population 15 years and over
Males 55.6% Never married31.7% Now married0.9% Separated2.9% Widowed8.8% DivorcedFemales 52.7% Never married26.5% Now married1.6% Separated8.1% Widowed11.1% DivorcedWomen who gave birth in the past 12 months Now married:
83.0% (86)Unmarried:
17.0% (18)
Women who did not give birth in the past 12 months Now married:
20.4% (950)Unmarried:
79.6% (3,714)
Marital status - Black or African American population 15 years and over
Males 50.6% Never married44.0% Now married4.2% Separated0.0% Widowed1.2% DivorcedFemales 53.6% Never married37.3% Now married0.0% Separated0.0% Widowed9.1% DivorcedWomen who gave birth in the past 12 months Now married:
84.1% (124)Unmarried:
15.9% (23)
Women who did not give birth in the past 12 months Now married:
9.4% (19)Unmarried:
90.6% (180)
Marital status - American Indian / Alaska Native population 15 years and over
Males 64.1% Never married35.9% Now married0.0% Separated0.0% Widowed0.0% DivorcedFemales 0.0% Never married0.0% Now married0.0% Separated0.0% Widowed100.0% DivorcedWomen who did not give birth in the past 12 months Now married:
0.0% (0)Unmarried:
100.0% (26)
Marital status - Asian population 15 years and over
Males 62.0% Never married38.0% Now married0.0% Separated0.0% Widowed0.0% DivorcedFemales 52.6% Never married47.4% Now married0.0% Separated0.0% Widowed0.0% DivorcedWomen who gave birth in the past 12 months Now married:
100.0% (16)Unmarried:
0.0% (0)
Women who did not give birth in the past 12 months Now married:
31.5% (79)Unmarried:
68.5% (172)
Marital status - Other race population 15 years and over
Males 0.0% Never married100.0% Now married0.0% Separated0.0% Widowed0.0% DivorcedFemales 50.8% Never married49.2% Now married0.0% Separated0.0% Widowed0.0% DivorcedWomen who did not give birth in the past 12 months Now married:
49.2% (35)Unmarried:
50.8% (36)
Marital status - Two or more races population 15 years and over
Males 69.4% Never married11.5% Now married0.0% Separated19.0% Widowed0.0% DivorcedFemales 83.8% Never married8.1% Now married0.0% Separated8.1% Widowed0.0% DivorcedWomen who did not give birth in the past 12 months Now married:
8.8% (22)Unmarried:
91.2% (229)
Marital status - White alone, not Hispanic / Latino population 15 years and over
Males 55.3% Never married31.8% Now married0.9% Separated3.0% Widowed9.0% DivorcedFemales 52.4% Never married26.4% Now married1.7% Separated8.2% Widowed11.3% DivorcedWomen who gave birth in the past 12 months Now married:
83.0% (87)Unmarried:
17.0% (18)
Women who did not give birth in the past 12 months Now married:
20.1% (920)Unmarried:
79.9% (3,661)
Marital status - Hispanic or Latino population 15 years and over
Males 64.5% Never married35.5% Now married0.0% Separated0.0% Widowed0.0% DivorcedFemales 70.5% Never married24.0% Now married0.0% Separated0.0% Widowed5.6% DivorcedWomen who did not give birth in the past 12 months Now married:
24.0% (76)Unmarried:
76.0% (240)
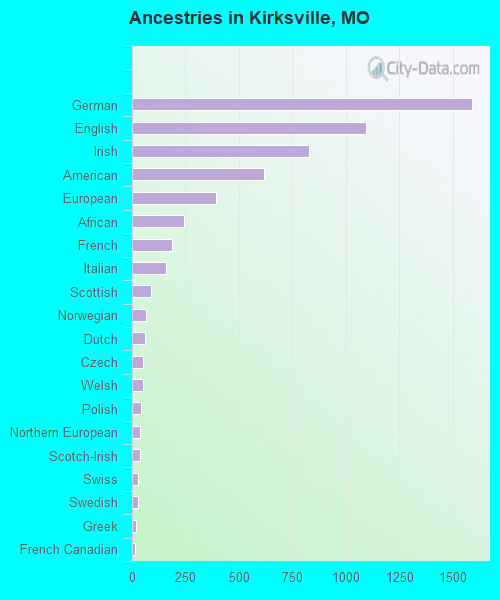
Ancestries in Kirksville
1,589 21.2% German1,095 14.6% English827 11.0% Irish618 8.3% American393 5.3% European243 3.2% African188 2.5% French159 2.1% Italian88 1.2% Scottish64 0.9% Norwegian59 0.8% Dutch51 0.7% Czech50 0.7% Welsh41 0.5% Polish36 0.5% Northern European36 0.5% Scotch-Irish30 0.4% Swiss27 0.4% Swedish21 0.3% Greek16 0.2% French Canadian11 0.1% Turkish9 0.1% British8 0.1% Austrian6 0.08% Russian5 0.07% Ukrainian3 0.04% Scandinavian
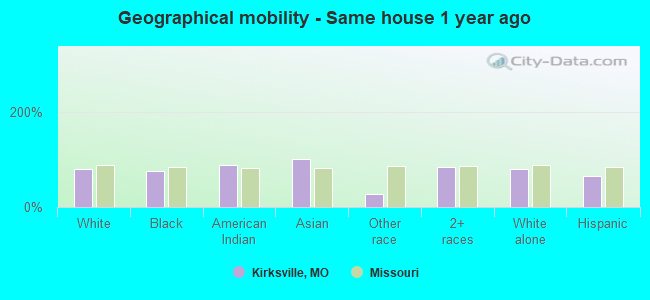
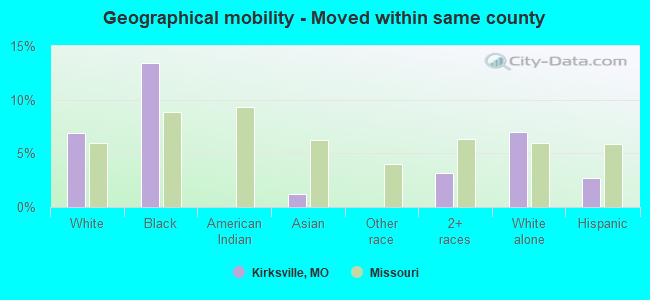
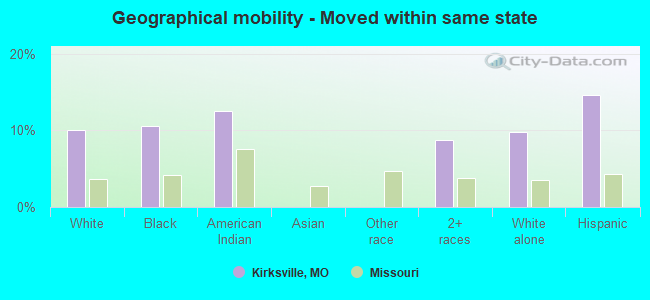
Geographical mobility in Kirksville Same house 1 year ago 11,797 79.3% White (Caucasian)715 75.2% Black or African American86 86.6% American Indian / Alaska Native483 100.0% Asian38 27.3% Other race628 84.3% Two or more races11,719 79.4% White alone, not Hispanic / Latino349 65.6% Hispanic or LatinoMoved within same county 1,031 6.9% White / Caucasian128 13.4% Black or African American6 1.2% Asian24 3.2% Two or more races1,028 7.0% White alone, not Hispanic / Latino14 2.7% Hispanic or LatinoMoved within same state 1,502 10.1% White / Caucasian101 10.6% Black or African American12 12.5% American Indian / Alaska Native65 8.8% Two or more races1,451 9.8% White alone, not Hispanic / Latino77 14.5% Hispanic or LatinoMoved from different state 466 3.1% White / Caucasian100 72.5% Other race24 3.2% Two or more races471 3.2% White alone, not Hispanic / Latino98 18.4% Hispanic or LatinoMoved from abroad 38 0.3% White6 5.9% American Indian / Alaska Native9 1.2% Two or more races34 0.2% White alone, not Hispanic / Latino16 3.0% Hispanic or Latino
Children Nativity (place of birth) in Kirksville
Children under 6 years - Living with two parents Both parents native 532 99.7% Native1 0.3% Foreign-bornBoth parents foreign-born 201 96.1% Native8 3.9% Foreign-bornOne native, one foreign-born parent 20 100.0% NativeChildren under 6 years - Living with one parent Native parent 182 100.0% NativeForeign-born parent 12 100.0% NativeChildren 6 to 17 years - Living with two parents Both parents native 1,215 100.0% NativeBoth parents foreign-born 8 17.2% Native38 82.8% Foreign-bornOne native, one foreign-born parent 107 100.0% NativeChildren 6 to 17 years - Living with one parent Native parent 545 100.0% Native
Grandparents responsible for own grandchildren in Kirksville
Grandparents (30 to 59 years) White / Caucasian 18 100.0% Responsible for grandchildrenWhite alone, not Hispanic / Latino 18 100.0% Responsible for grandchildren
Grandparents (60 years and over) White / Caucasian 20 100.0% Not responsible for grandchildrenWhite alone, not Hispanic / Latino 21 100.0% Not responsible for grandchildren