Races in Knoxville, Tennessee (TN) Detailed Stats
Data:
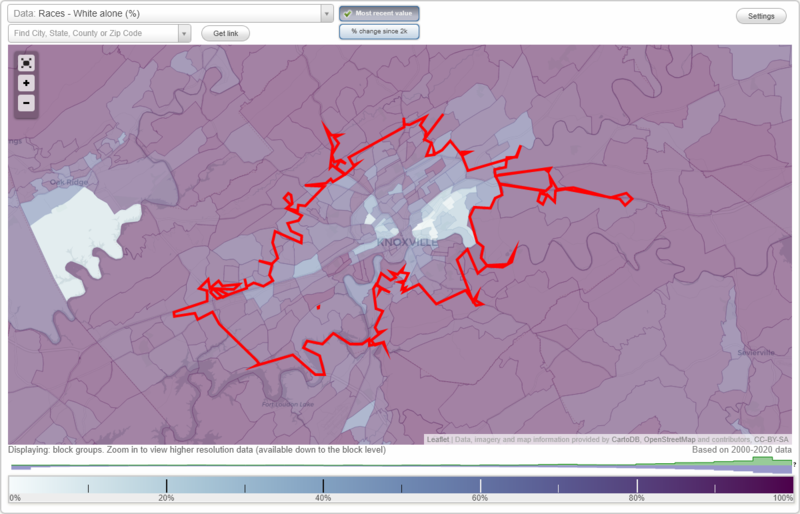
Races - White alone (%)
Races - White alone (% change since 2000)
Races - Black alone (%)
Races - Black alone (% change since 2000)
Races - American Indian alone (%)
Races - American Indian alone (% change since 2000)
Races - Asian alone (%)
Races - Asian alone (% change since 2000)
Races - Hispanic (%)
Races - Hispanic (% change since 2000)
Races - Native Hawaiian and Other Pacific Islander alone (%)
Races - Native Hawaiian and Other Pacific Islander alone (% change since 2000)
Races - Two or more races(%)
Races - Two or more races(% change since 2000)
Races - Other race alone (%)
Races - Other race alone (% change since 2000)
Racial diversity
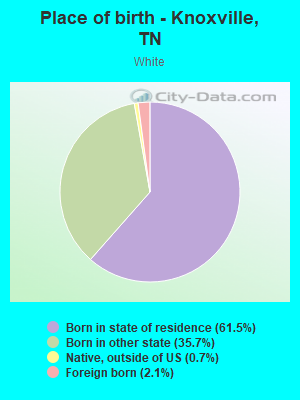
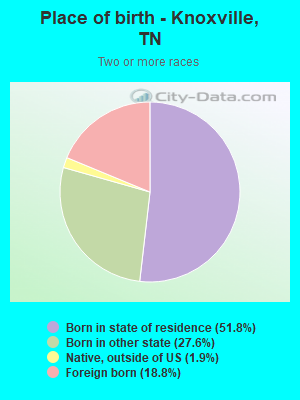
Place of birth - Born in state of residence (%)
Place of birth - Born in state of residence (%) - White
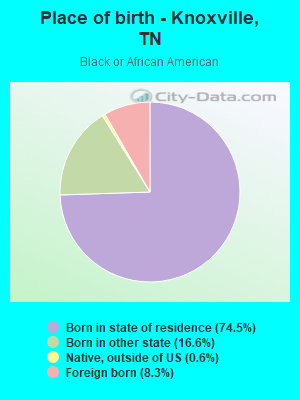
Place of birth - Born in state of residence (%) - Black or African American
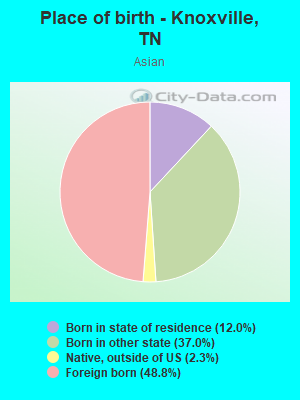
Place of birth - Born in state of residence (%) - Asian
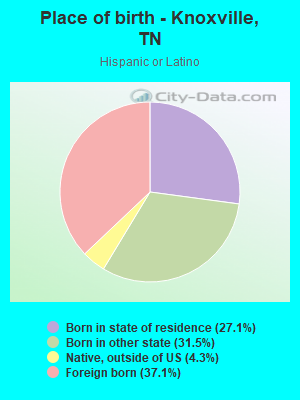
Place of birth - Born in state of residence (%) - Hispanic or Latino
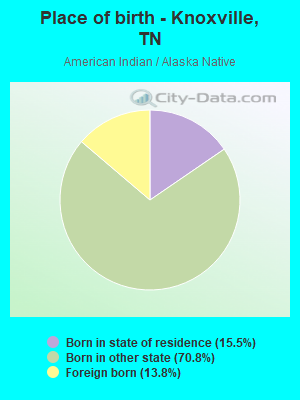
Place of birth - Born in state of residence (%) - American Indian and Alaska Native
Place of birth - Born in state of residence (%) - Multirace
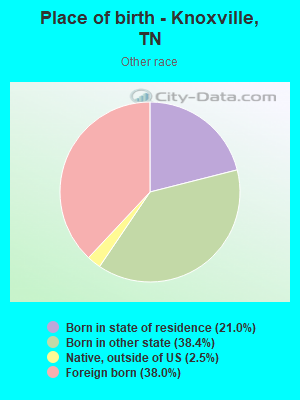
Place of birth - Born in state of residence (%) - Other Race
Place of birth - Born in other state (%)
Place of birth - Born in other state (%) - White
Place of birth - Born in other state (%) - Black or African American
Place of birth - Born in other state (%) - Asian
Place of birth - Born in other state (%) - Hispanic or Latino
Place of birth - Born in other state (%) - American Indian and Alaska Native
Place of birth - Born in other state (%) - Multirace
Place of birth - Born in other state (%) - Other Race
Place of birth - Native, outside of US (%)
Place of birth - Native, outside of US (%) - White
Place of birth - Native, outside of US (%) - Black or African American
Place of birth - Native, outside of US (%) - Asian
Place of birth - Native, outside of US (%) - Hispanic or Latino
Place of birth - Native, outside of US (%) - American Indian and Alaska Native
Place of birth - Native, outside of US (%) - Multirace
Place of birth - Native, outside of US (%) - Other Race
Place of birth - Foreign born (%)
Place of birth - Foreign born (%) - White
Place of birth - Foreign born (%) - Black or African American
Place of birth - Foreign born (%) - Asian
Place of birth - Foreign born (%) - Hispanic or Latino
Place of birth - Foreign born (%) - American Indian and Alaska Native
Place of birth - Foreign born (%) - Multirace
Place of birth - Foreign born (%) - Other Race
Residents speaking English at home (%)
Residents speaking English at home - Born in the United States (%)
Residents speaking English at home - Native, born elsewhere (%)
Residents speaking English at home - Foreign born (%)
Residents speaking Spanish at home (%)
Residents speaking Spanish at home - Born in the United States (%)
Residents speaking Spanish at home - Native, born elsewhere (%)
Residents speaking Spanish at home - Foreign born (%)
Residents speaking other language at home (%)
Residents speaking other language at home - Born in the United States (%)
Residents speaking other language at home - Native, born elsewhere (%)
Residents speaking other language at home - Foreign born (%)
Marital status - Never married (%)
Marital status - Now married (%)
Marital status - Separated (%)
Marital status - Widowed (%)
Marital status - Divorced (%)
Ancestries Reported - Arab (%)
Ancestries Reported - Czech (%)
Ancestries Reported - Danish (%)
Ancestries Reported - Dutch (%)
Ancestries Reported - English (%)
Ancestries Reported - French (%)
Ancestries Reported - French Canadian (%)
Ancestries Reported - German (%)
Ancestries Reported - Greek (%)
Ancestries Reported - Hungarian (%)
Ancestries Reported - Irish (%)
Ancestries Reported - Italian (%)
Ancestries Reported - Lithuanian (%)
Ancestries Reported - Norwegian (%)
Ancestries Reported - Polish (%)
Ancestries Reported - Portuguese (%)
Ancestries Reported - Russian (%)
Ancestries Reported - Scotch-Irish (%)
Ancestries Reported - Scottish (%)
Ancestries Reported - Slovak (%)
Ancestries Reported - Subsaharan African (%)
Ancestries Reported - Swedish (%)
Ancestries Reported - Swiss (%)
Ancestries Reported - Ukrainian (%)
Ancestries Reported - United States (%)
Ancestries Reported - Welsh (%)
Ancestries Reported - West Indian (%)
Ancestries Reported - Other (%)
Geographical mobility - Same house 1 year ago (%)
Geographical mobility - Same house 1 year ago (%) - White
Geographical mobility - Same house 1 year ago (%) - Black or African American
Geographical mobility - Same house 1 year ago (%) - Asian
Geographical mobility - Same house 1 year ago (%) - Hispanic or Latino
Geographical mobility - Same house 1 year ago (%) - American Indian and Alaska Native
Geographical mobility - Same house 1 year ago (%) - Multirace
Geographical mobility - Same house 1 year ago (%) - Other Race
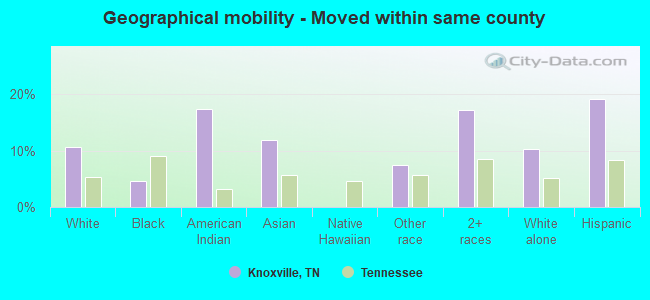
Geographical mobility - Moved within same county (%)
Geographical mobility - Moved within same county (%) - White
Geographical mobility - Moved within same county (%) - Black or African American
Geographical mobility - Moved within same county (%) - Asian
Geographical mobility - Moved within same county (%) - Hispanic or Latino
Geographical mobility - Moved within same county (%) - American Indian and Alaska Native
Geographical mobility - Moved within same county (%) - Multirace
Geographical mobility - Moved within same county (%) - Other Race
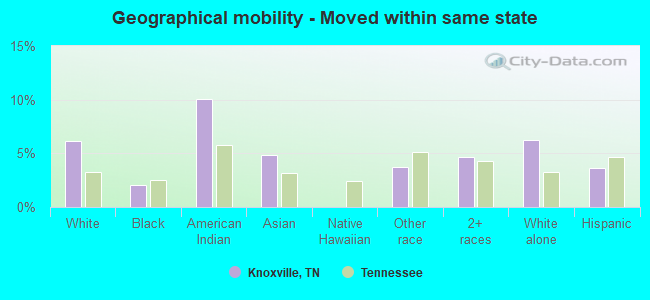
Geographical mobility - Moved from different county within same state (%)
Geographical mobility - Moved from different county within same state (%) - White
Geographical mobility - Moved from different county within same state (%) - Black or African American
Geographical mobility - Moved from different county within same state (%) - Asian
Geographical mobility - Moved from different county within same state (%) - Hispanic or Latino
Geographical mobility - Moved from different county within same state (%) - American Indian and Alaska Native
Geographical mobility - Moved from different county within same state (%) - Multirace
Geographical mobility - Moved from different county within same state (%) - Other Race
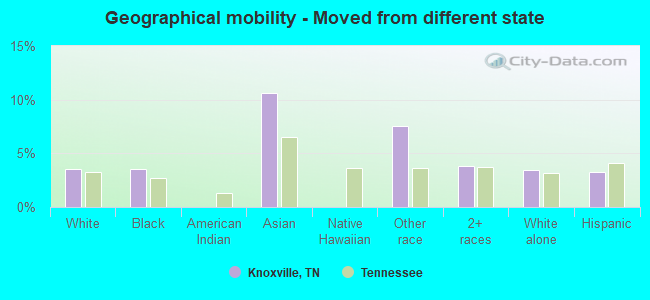
Geographical mobility - Moved from different state (%)
Geographical mobility - Moved from different state (%) - White
Geographical mobility - Moved from different state (%) - Black or African American
Geographical mobility - Moved from different state (%) - Asian
Geographical mobility - Moved from different state (%) - Hispanic or Latino
Geographical mobility - Moved from different state (%) - American Indian and Alaska Native
Geographical mobility - Moved from different state (%) - Multirace
Geographical mobility - Moved from different state (%) - Other Race
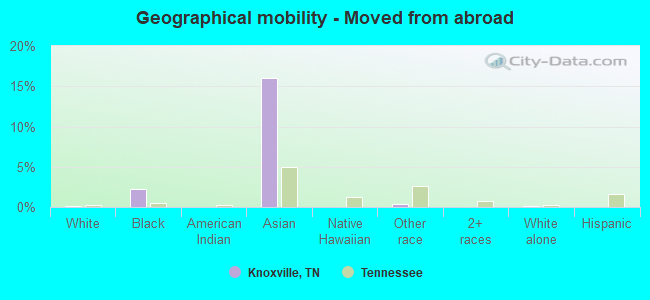
Geographical mobility - Moved from abroad (%)
Geographical mobility - Moved from abroad (%) - White
Geographical mobility - Moved from abroad (%) - Black or African American
Geographical mobility - Moved from abroad (%) - Asian
Geographical mobility - Moved from abroad (%) - Hispanic or Latino
Geographical mobility - Moved from abroad (%) - American Indian and Alaska Native
Geographical mobility - Moved from abroad (%) - Multirace
Geographical mobility - Moved from abroad (%) - Other Race
Place of birth for the foreign-born population - Ireland (%)
Place of birth for the foreign-born population - Denmark (%)
Place of birth for the foreign-born population - Norway (%)
Place of birth for the foreign-born population - Sweden (%)
Place of birth for the foreign-born population - United Kingdom (%)
Place of birth for the foreign-born population - England (%)
Place of birth for the foreign-born population - Scotland (%)
Place of birth for the foreign-born population - Other Northern Europe (%)
Place of birth for the foreign-born population - Austria (%)
Place of birth for the foreign-born population - Belgium (%)
Place of birth for the foreign-born population - France (%)
Place of birth for the foreign-born population - Germany (%)
Place of birth for the foreign-born population - Netherlands (%)
Place of birth for the foreign-born population - Switzerland (%)
Place of birth for the foreign-born population - Other Western Europe (%)
Place of birth for the foreign-born population - Greece (%)
Place of birth for the foreign-born population - Italy (%)
Place of birth for the foreign-born population - Portugal (%)
Place of birth for the foreign-born population - Spain (%)
Place of birth for the foreign-born population - Other Southern Europe (%)
Place of birth for the foreign-born population - Albania (%)
Place of birth for the foreign-born population - Belarus (%)
Place of birth for the foreign-born population - Bosnia and Herzegovina (%)
Place of birth for the foreign-born population - Bulgaria (%)
Place of birth for the foreign-born population - Croatia (%)
Place of birth for the foreign-born population - Czechoslovakia (%)
Place of birth for the foreign-born population - Hungary (%)
Place of birth for the foreign-born population - Latvia (%)
Place of birth for the foreign-born population - Lithuania (%)
Place of birth for the foreign-born population - North Macedonia (Macedonia) (%)
Place of birth for the foreign-born population - Moldova (%)
Place of birth for the foreign-born population - Poland (%)
Place of birth for the foreign-born population - Romania (%)
Place of birth for the foreign-born population - Russia (%)
Place of birth for the foreign-born population - Serbia (%)
Place of birth for the foreign-born population - Ukraine (%)
Place of birth for the foreign-born population - Other Eastern Europe (%)
Place of birth for the foreign-born population - China (%)
Place of birth for the foreign-born population - Hong Kong (%)
Place of birth for the foreign-born population - Taiwan (%)
Place of birth for the foreign-born population - Japan (%)
Place of birth for the foreign-born population - Korea (%)
Place of birth for the foreign-born population - Other Eastern Asia (%)
Place of birth for the foreign-born population - Afghanistan (%)
Place of birth for the foreign-born population - Bangladesh (%)
Place of birth for the foreign-born population - India (%)
Place of birth for the foreign-born population - Iran (%)
Place of birth for the foreign-born population - Kazakhstan (%)
Place of birth for the foreign-born population - Nepal (%)
Place of birth for the foreign-born population - Pakistan (%)
Place of birth for the foreign-born population - Sri Lanka (%)
Place of birth for the foreign-born population - Uzbekistan (%)
Place of birth for the foreign-born population - Other South Central Asia (%)
Place of birth for the foreign-born population - Burma (%)
Place of birth for the foreign-born population - Cambodia (%)
Place of birth for the foreign-born population - Indonesia (%)
Place of birth for the foreign-born population - Laos (%)
Place of birth for the foreign-born population - Malaysia (%)
Place of birth for the foreign-born population - Philippines (%)
Place of birth for the foreign-born population - Singapore (%)
Place of birth for the foreign-born population - Thailand (%)
Place of birth for the foreign-born population - Vietnam (%)
Place of birth for the foreign-born population - Other South Eastern Asia (%)
Place of birth for the foreign-born population - Armenia (%)
Place of birth for the foreign-born population - Iraq (%)
Place of birth for the foreign-born population - Israel (%)
Place of birth for the foreign-born population - Jordan (%)
Place of birth for the foreign-born population - Kuwait (%)
Place of birth for the foreign-born population - Lebanon (%)
Place of birth for the foreign-born population - Saudi Arabia (%)
Place of birth for the foreign-born population - Syria (%)
Place of birth for the foreign-born population - Turkey (%)
Place of birth for the foreign-born population - Yemen (%)
Place of birth for the foreign-born population - Other Western Asia (%)
Place of birth for the foreign-born population - Eritrea (%)
Place of birth for the foreign-born population - Ethiopia (%)
Place of birth for the foreign-born population - Kenya (%)
Place of birth for the foreign-born population - Somalia (%)
Place of birth for the foreign-born population - Uganda (%)
Place of birth for the foreign-born population - Zimbabwe (%)
Place of birth for the foreign-born population - Other Eastern Africa (%)
Place of birth for the foreign-born population - Cameroon (%)
Place of birth for the foreign-born population - Congo (%)
Place of birth for the foreign-born population - Democratic Republic of Congo (Zaire) (%)
Place of birth for the foreign-born population - Other Middle Africa (%)
Place of birth for the foreign-born population - Egypt (%)
Place of birth for the foreign-born population - Morocco (%)
Place of birth for the foreign-born population - Sudan (%)
Place of birth for the foreign-born population - Other Northern Africa (%)
Place of birth for the foreign-born population - South Africa (%)
Place of birth for the foreign-born population - Other Southern Africa (%)
Place of birth for the foreign-born population - Cabo Verde (%)
Place of birth for the foreign-born population - Ghana (%)
Place of birth for the foreign-born population - Liberia (%)
Place of birth for the foreign-born population - Nigeria (%)
Place of birth for the foreign-born population - Senegal (%)
Place of birth for the foreign-born population - Sierra Leone (%)
Place of birth for the foreign-born population - Other Western Africa (%)
Place of birth for the foreign-born population - Australia (%)
Place of birth for the foreign-born population - New Zealand (%)
Place of birth for the foreign-born population - Fiji (%)
Place of birth for the foreign-born population - Micronesia (%)
Place of birth for the foreign-born population - Bahamas (%)
Place of birth for the foreign-born population - Barbados (%)
Place of birth for the foreign-born population - Cuba (%)
Place of birth for the foreign-born population - Dominica (%)
Place of birth for the foreign-born population - Dominican Republic (%)
Place of birth for the foreign-born population - Grenada (%)
Place of birth for the foreign-born population - Haiti (%)
Place of birth for the foreign-born population - Jamaica (%)
Place of birth for the foreign-born population - St. Vincent and the Grenadines (%)
Place of birth for the foreign-born population - Trinidad and Tobago (%)
Place of birth for the foreign-born population - West Indies (%)
Place of birth for the foreign-born population - Other Caribbean (%)
Place of birth for the foreign-born population - Belize (%)
Place of birth for the foreign-born population - Costa Rica (%)
Place of birth for the foreign-born population - El Salvador (%)
Place of birth for the foreign-born population - Guatemala (%)
Place of birth for the foreign-born population - Honduras (%)
Place of birth for the foreign-born population - Mexico (%)
Place of birth for the foreign-born population - Nicaragua (%)
Place of birth for the foreign-born population - Panama (%)
Place of birth for the foreign-born population - Other Central America (%)
Place of birth for the foreign-born population - Argentina (%)
Place of birth for the foreign-born population - Bolivia (%)
Place of birth for the foreign-born population - Brazil (%)
Place of birth for the foreign-born population - Chile (%)
Place of birth for the foreign-born population - Colombia (%)
Place of birth for the foreign-born population - Ecuador (%)
Place of birth for the foreign-born population - Guyana (%)
Place of birth for the foreign-born population - Peru (%)
Place of birth for the foreign-born population - Uruguay (%)
Place of birth for the foreign-born population - Venezuela (%)
Place of birth for the foreign-born population - Other South America (%)
Place of birth for the foreign-born population - Canada (%)
Place of birth for the foreign-born population - Other Northern America (%)
Place of birth for the foreign-born population - Other (%)
Latest news about races in Knoxville, TN collected exclusively by city-data.com from local newspapers, TV, and radio stations
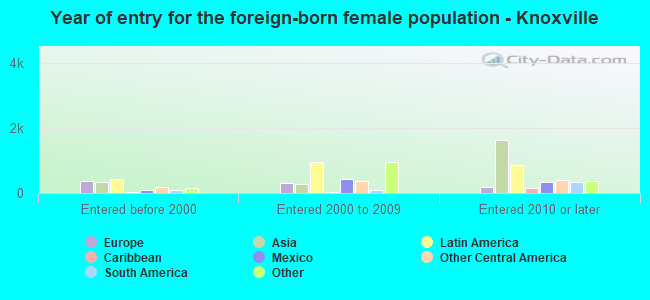
According to 2022 data, the most numerous races in Knoxville, TN are White alone (142,438 residents), Black alone (32,569 residents), and Hispanic (9,665 residents). 91.9% of Knoxville residents speak English at home. 6.4% of Knoxville, TN residents are foreign-born (2.7% born in Latin America, 1.8% born in Asia, 0.9% born in Europe, 0.8% born in Africa), which is 21.6% greater than the foreign-born rate of 5.0% across the entire state of Tennessee.
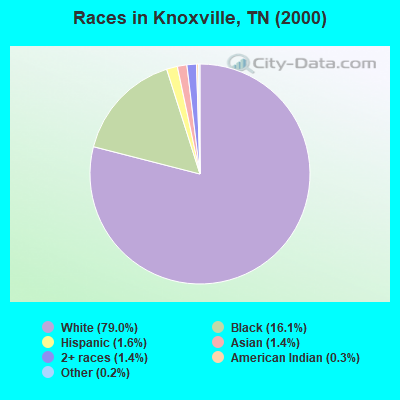
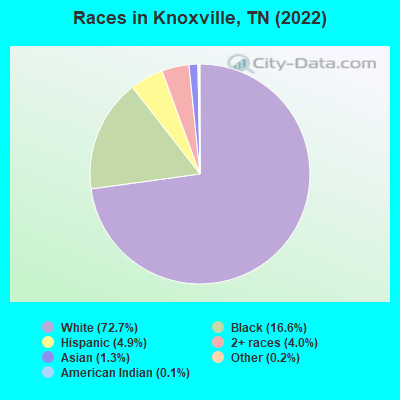
Race distribution in Knoxville
2000 2022
137,336 79.0% White alone 28,015 16.1% Black alone 2,751 1.6% Hispanic 2,447 1.4% Two or more races 2,516 1.4% Asian alone 504 0.3% American Indian alone 276 0.2% Other race alone 45 0.03% Native Hawaiian and Other
142,438 72.7% White alone 32,569 16.6% Black alone 9,665 4.9% Hispanic 7,799 4.0% Two or more races 2,619 1.3% Asian alone 402 0.2% Other race alone 286 0.1% American Indian alone 93 0.05% Native Hawaiian and Other
2000 2022
4,505,930 79.2% White alone 928,204 16.3% Black alone 123,838 2.2% Hispanic 54,824 1.0% Two or more races 56,077 1.0% Asian alone 13,820 0.2% American Indian alone 4,780 0.08% Other race alone 1,810 0.03% Native Hawaiian and Other
5,070,026 71.9% White alone 1,089,738 15.5% Black alone 442,629 6.3% Hispanic 279,381 4.0% Two or more races 131,817 1.9% Asian alone 26,972 0.4% Other race alone 6,387 0.09% American Indian alone 4,389 0.06% Native Hawaiian and Other
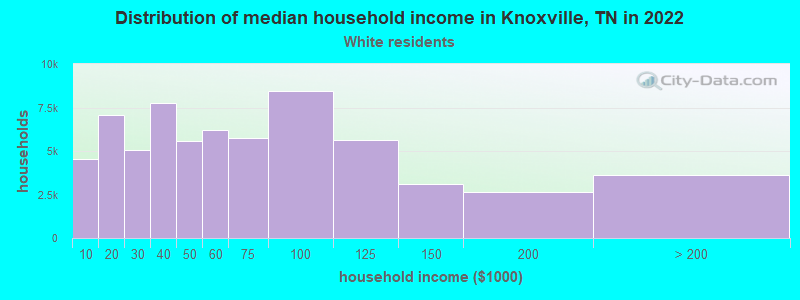
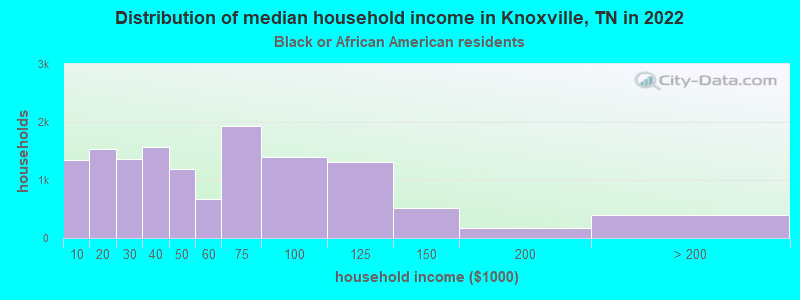
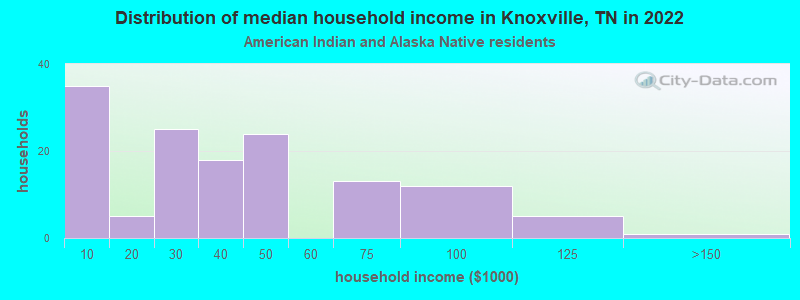
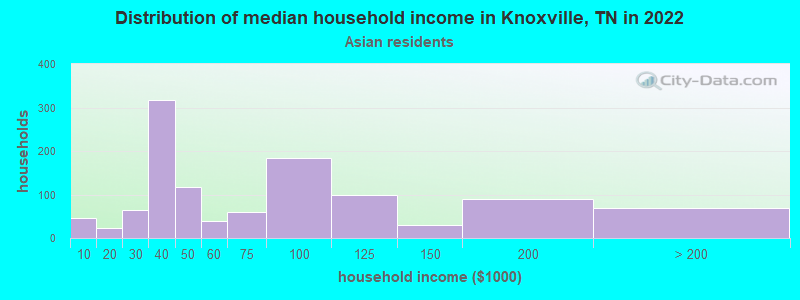
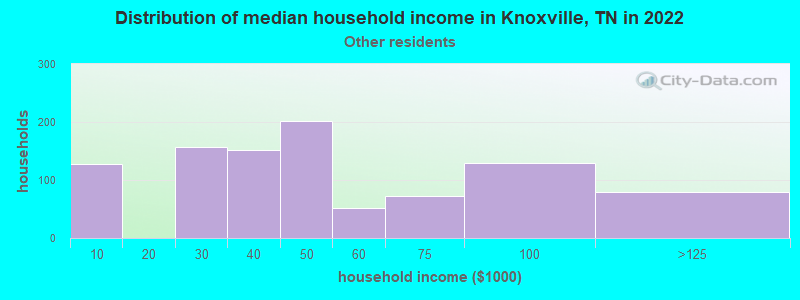
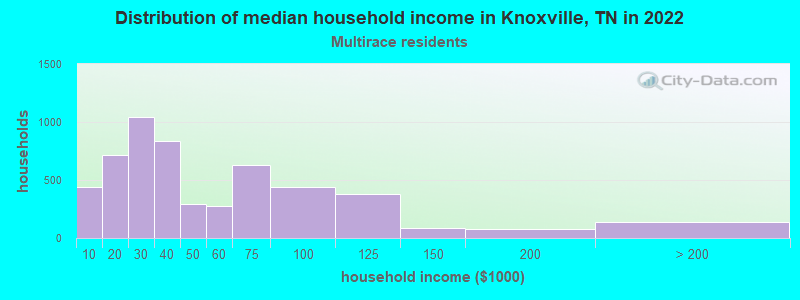
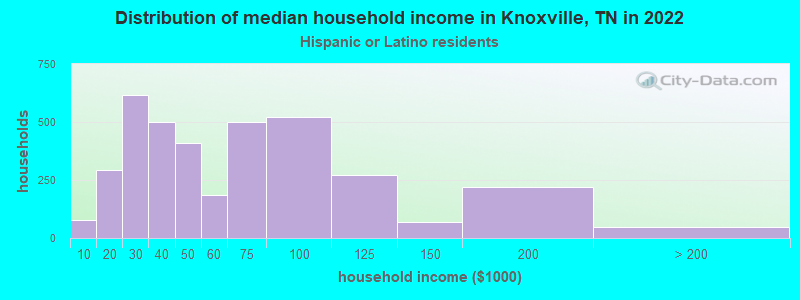
Income and house value in Knoxville Median household income in 2022 $54,306 White non-Hispanic householders$46,167 Black householders$44,597 Asian householders$47,962 Some other race householders$40,176 Two or more races householders$48,043 Hispanic or Latino race householdersMedian 2022 house value $243,400 White Non-Hispanic householders$183,312 Black or African American householders$213,508 American Indian or Alaska Native householders $341,919 Asian householders$419,392 Native Hawaiian and other Pacific Islander householders$244,010 Some other race householders$252,245 Two or more races householders$276,341 Hispanic or Latino householders
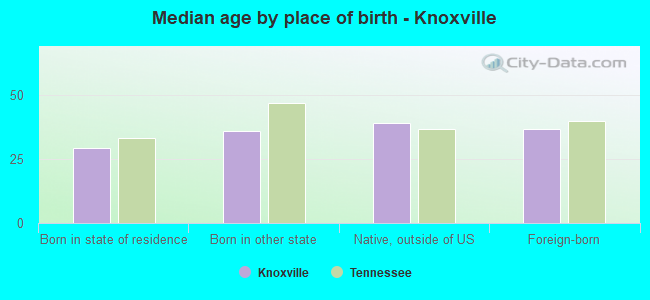
Median age by race in Knoxville
34.0 Median age for White residents33.2 35.1 31.6 Median age for Black or African American residents30.5 34.2 58.1 Median age for American Indian / Alaska Native residents58.3 52.6 25.3 Median age for Asian residents24.9 27.4 -666,666,666.0 Median age for Native Hawaiian / Pacific Islander residents-666,666,666.0 -666,666,666.0 22.6 Median age for Other race residents19.7 31.2 25.3 Median age for Two or more races residents26.4 24.4 34.1 Median age for White alone residents33.4 35.3 26.5 Median age for Hispanic or Latino residents27.1 25.9
Owner/renter occupied households by race in Knoxville
House owners and renters - White residents 30,630 46.8% Owner occupied34,802 53.2% Renter occupiedHouse owners and renters - Black or African American residents 5,605 41.8% Owner occupied7,804 58.2% Renter occupiedHouse owners and renters - American Indian / Alaska Native residents 23 23.4% Owner occupied74 76.6% Renter occupiedHouse owners and renters - Asian residents 153 19.5% Owner occupied633 80.5% Renter occupiedHouse owners and renters - Native Hawaiian / Pacific Islander residents 47 100.0% Renter occupiedHouse owners and renters - Other race residents 279 40.6% Owner occupied409 59.4% Renter occupiedHouse owners and renters - Two or more races residents 1,557 32.3% Owner occupied3,260 67.7% Renter occupiedHouse owners and renters - White alone residents 30,392 46.9% Owner occupied34,416 53.1% Renter occupiedHouse owners and renters - Hispanic or Latino residents 1,394 39.5% Owner occupied2,139 60.5% Renter occupied
Language usage in Knoxville
English speakers - Total 91.9% of residents of Knoxville speak English at home.
3.8% of residents speak Spanish at home 3,846 54.3% Speak English very well3,239 45.7% Speak English less than very well4.3% of residents speak other language at home 5,233 65.0% Speak English very well2,812 35.0% Speak English less than very well
English speakers - Born in the United States 93.1% of residents of Knoxville speak English at home.
3.9% of residents speak Spanish at home 2,387 99.0% Speak English very well23 1.0% Speak English less than very well3.0% of residents speak other language at home 1,777 95.5% Speak English very well83 4.5% Speak English less than very well
English speakers - Native, born elsewhere 80.8% of residents of Knoxville speak English at home.
14.6% of residents speak Spanish at home 128 56.4% Speak English very well99 43.6% Speak English less than very well4.6% of residents speak other language at home 72 100.0% Speak English very well
English speakers - Foreign-born 19.3% of residents of Knoxville speak English at home.
32.6% of residents speak Spanish at home 344 10.1% Speak English very well3,055 89.9% Speak English less than very well48.1% of residents speak other language at home 2,499 49.9% Speak English very well2,512 50.1% Speak English less than very well
White (Caucasian) - Speak only English Native:
97.6% (132,242)Foreign-born:
33.1% (1,003)
White (Caucasian) - Speak another language Native:
2.4% (3,232)Foreign-born:
66.9% (2,026)
Black or African American - Speak only English Native:
99.2% (27,452)Foreign-born:
31.9% (872)
Black or African American - Speak another language Native:
0.8% (227)Foreign-born:
68.1% (1,858)
American Indian / Alaska Native - Speak another language Native:
19.9% (54)Foreign-born:
100.0% (55)
Asian - Speak another language Native:
32.2% (432)Foreign-born:
100.0% (1,153)
Other race - Speak only English Native:
25.3% (430)Foreign-born:
4.0% (42)
Other race - Speak another language Native:
74.7% (1,272)Foreign-born:
96.0% (1,002)
Two or more races - Speak only English Native:
83.7% (8,012)Foreign-born:
3.6% (89)
Two or more races - Speak another language Native:
16.3% (1,557)Foreign-born:
96.4% (2,371)
White alone - Speak only English Native:
97.8% (131,315)Foreign-born:
33.1% (1,003)
White alone - Speak another language Native:
2.2% (2,957)Foreign-born:
66.9% (2,024)
Hispanic or Latino - Speak only English Native:
46.2% (2,518)Foreign-born:
1.8% (63)
Hispanic or Latino - Speak another language Native:
53.8% (2,938)Foreign-born:
98.2% (3,427)
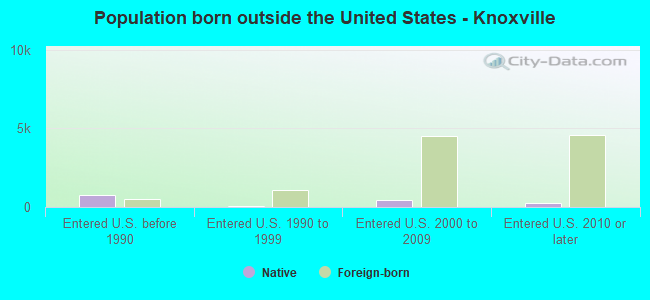
Foreign-born residents in Knoxville 12,572 residents are foreign born (2.7% Latin America , 1.8% Asia , 0.9% Europe , 0.8% Africa ).
This city:
6.4%Tennessee:
5.4%
Marital status for residents in Knoxville Marital status - White (Caucasian) population 15 years and over
Males 46.8% Never married38.1% Now married1.8% Separated2.4% Widowed10.8% DivorcedFemales 42.5% Never married33.3% Now married1.3% Separated7.7% Widowed15.2% DivorcedWomen who gave birth in the past 12 months Now married:
58.1% (721)Unmarried:
41.9% (519)
Women who did not give birth in the past 12 months Now married:
26.1% (10,724)Unmarried:
73.9% (30,352)
Marital status - Black or African American population 15 years and over
Males 53.5% Never married31.6% Now married0.4% Separated4.0% Widowed10.5% DivorcedFemales 54.6% Never married24.8% Now married3.3% Separated5.9% Widowed11.3% DivorcedWomen who gave birth in the past 12 months Now married:
27.5% (61)Unmarried:
72.5% (161)
Women who did not give birth in the past 12 months Now married:
20.4% (1,688)Unmarried:
79.6% (6,599)
Marital status - American Indian / Alaska Native population 15 years and over
Males 36.5% Never married54.2% Now married6.2% Separated0.0% Widowed3.1% DivorcedFemales 25.9% Never married38.5% Now married4.6% Separated2.9% Widowed28.2% DivorcedWomen who did not give birth in the past 12 months Now married:
62.5% (59)Unmarried:
37.5% (35)
Marital status - Asian population 15 years and over
Males 61.4% Never married35.0% Now married1.8% Separated0.0% Widowed1.7% DivorcedFemales 34.2% Never married50.9% Now married1.7% Separated9.3% Widowed3.9% DivorcedWomen who did not give birth in the past 12 months Now married:
47.7% (531)Unmarried:
52.3% (583)
Marital status - Other race population 15 years and over
Males 47.7% Never married49.6% Now married0.3% Separated1.6% Widowed0.7% DivorcedFemales 59.5% Never married37.6% Now married2.0% Separated0.0% Widowed1.0% DivorcedWomen who gave birth in the past 12 months Now married:
83.8% (49)Unmarried:
16.2% (9)
Women who did not give birth in the past 12 months Now married:
31.6% (380)Unmarried:
68.4% (823)
Marital status - Two or more races population 15 years and over
Males 70.9% Never married21.8% Now married2.4% Separated0.0% Widowed4.9% DivorcedFemales 64.9% Never married17.9% Now married0.5% Separated6.2% Widowed10.5% DivorcedWomen who gave birth in the past 12 months Now married:
56.8% (121)Unmarried:
43.2% (92)
Women who did not give birth in the past 12 months Now married:
24.0% (971)Unmarried:
76.0% (3,075)
Marital status - White alone, not Hispanic / Latino population 15 years and over
Males 46.6% Never married38.2% Now married1.9% Separated2.4% Widowed10.9% DivorcedFemales 42.3% Never married33.4% Now married1.3% Separated7.8% Widowed15.2% DivorcedWomen who gave birth in the past 12 months Now married:
56.6% (676)Unmarried:
43.4% (519)
Women who did not give birth in the past 12 months Now married:
26.3% (10,641)Unmarried:
73.7% (29,836)
Marital status - Hispanic or Latino population 15 years and over
Males 68.6% Never married27.2% Now married2.9% Separated0.0% Widowed1.3% DivorcedFemales 65.7% Never married19.2% Now married0.0% Separated6.8% Widowed8.3% DivorcedWomen who gave birth in the past 12 months Now married:
32.1% (84)Unmarried:
67.9% (178)
Women who did not give birth in the past 12 months Now married:
14.6% (425)Unmarried:
85.4% (2,489)
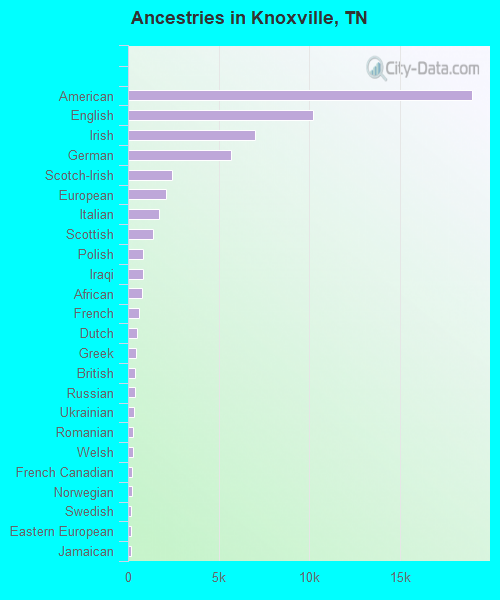
Ancestries in Knoxville
18,987 18.4% American10,236 9.9% English7,020 6.8% Irish5,670 5.5% German2,438 2.4% Scotch-Irish2,112 2.0% European1,718 1.7% Italian1,389 1.3% Scottish827 0.8% Polish807 0.8% Iraqi770 0.7% African605 0.6% French501 0.5% Dutch454 0.4% Greek399 0.4% British394 0.4% Russian333 0.3% Ukrainian282 0.3% Romanian249 0.2% Welsh226 0.2% French Canadian222 0.2% Norwegian190 0.2% Swedish181 0.2% Eastern European174 0.2% Jamaican151 0.1% Swiss139 0.1% Guyanese132 0.1% Northern European123 0.1% Sudanese116 0.1% Nigerian102 0.10% Ethiopian95 0.09% Canadian95 0.09% Palestinian95 0.09% Czech92 0.09% Egyptian85 0.08% Hungarian82 0.08% Danish79 0.08% Scandinavian72 0.07% Lebanese70 0.07% Iranian65 0.06% Turkish61 0.06% Haitian59 0.06% British West Indian49 0.05% Jordanian47 0.05% Arab46 0.04% Afghan39 0.04% Kenyan38 0.04% South African38 0.04% Yugoslavian38 0.04% Pennsylvania German37 0.04% Finnish37 0.04% Portuguese36 0.03% Ghanaian35 0.03% Estonian34 0.03% Bahamian33 0.03% Cape Verdean33 0.03% Syrian31 0.03% Austrian26 0.03% Celtic26 0.03% Brazilian26 0.03% Slovak24 0.02% Albanian21 0.02% Slovene21 0.02% Somali20 0.02% Armenian19 0.02% Belgian17 0.02% Bulgarian14 0.01% Serbian11 0.01% Luxembourger11 0.01% Dutch West Indian8 0.01% Macedonian8 0.01% Croatian7 0.01% Lithuanian6 0.01% Australian
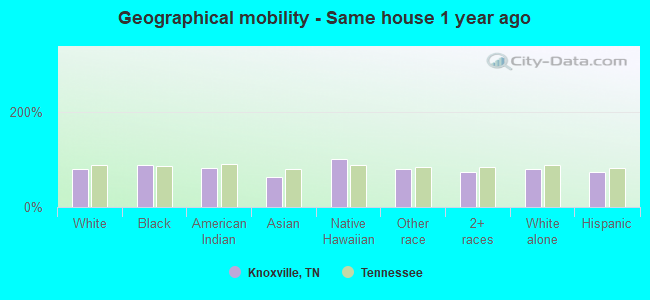
Geographical mobility in Knoxville Same house 1 year ago 113,543 79.5% White (Caucasian)28,460 87.7% Black or African American252 80.8% American Indian / Alaska Native2,043 61.8% Asian83 100.0% Native Hawaiian / Pacific Islander3,239 80.0% Other race9,797 74.3% Two or more races112,969 79.8% White alone, not Hispanic / Latino6,937 74.1% Hispanic or LatinoMoved within same county 15,079 10.6% White / Caucasian1,478 4.6% Black or African American54 17.3% American Indian / Alaska Native392 11.9% Asian300 7.4% Other race2,263 17.2% Two or more races14,592 10.3% White alone, not Hispanic / Latino1,784 19.1% Hispanic or LatinoMoved within same state 8,843 6.2% White / Caucasian658 2.0% Black or African American31 10.1% American Indian / Alaska Native161 4.9% Asian152 3.8% Other race615 4.7% Two or more races8,806 6.2% White alone, not Hispanic / Latino337 3.6% Hispanic or LatinoMoved from different state 5,083 3.6% White / Caucasian1,147 3.5% Black or African American352 10.6% Asian307 7.6% Other race506 3.8% Two or more races4,939 3.5% White alone, not Hispanic / Latino304 3.2% Hispanic or LatinoMoved from abroad 222 0.2% White709 2.2% Black or African American531 16.1% Asian16 0.4% Other race222 0.2% White alone, not Hispanic / Latino
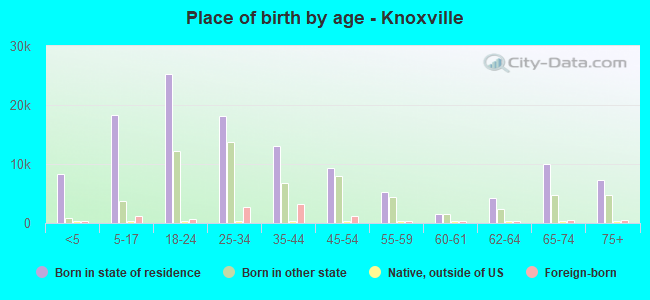
Children Nativity (place of birth) in Knoxville
Children under 6 years - Living with two parents Both parents native 4,537 100.0% NativeBoth parents foreign-born 993 83.2% Native200 16.8% Foreign-bornOne native, one foreign-born parent 489 100.0% NativeChildren under 6 years - Living with one parent Native parent 4,215 100.0% NativeForeign-born parent 523 85.2% Native91 14.8% Foreign-bornChildren 6 to 17 years - Living with two parents Both parents native 7,389 100.0% NativeBoth parents foreign-born 1,542 65.3% Native820 34.7% Foreign-bornOne native, one foreign-born parent 1,151 97.0% Native35 3.0% Foreign-bornChildren 6 to 17 years - Living with one parent Native parent 8,975 100.0% NativeForeign-born parent 969 58.2% Native697 41.8% Foreign-born
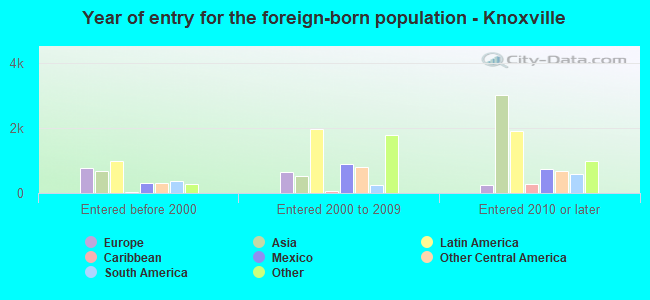
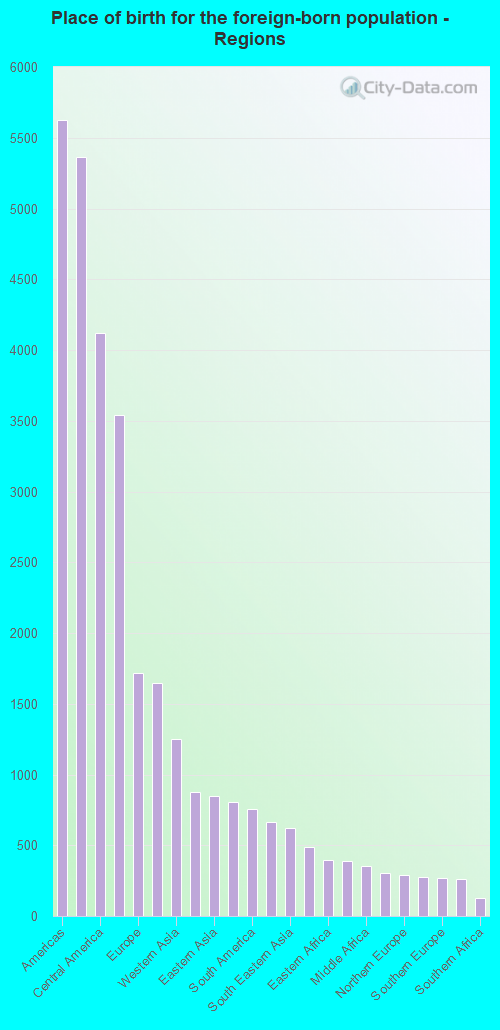
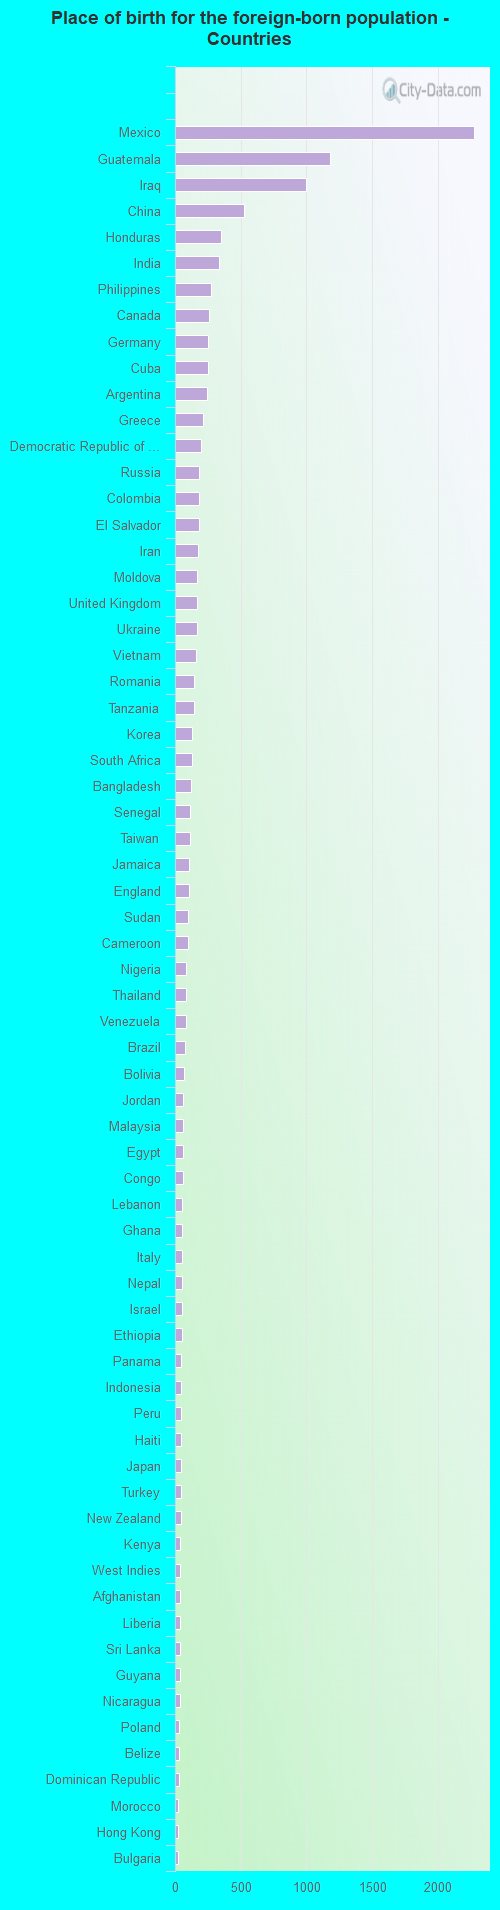
Place of birth for residents in Knoxville 5,624 Americas5,363 Latin America4,118 Central America3,538 Asia1,719 Europe1,646 Africa1,254 Western Asia879 Eastern Europe847 Eastern Asia803 South Central Asia755 South America667 China625 South Eastern Asia489 Caribbean399 Eastern Africa388 Western Africa355 Middle Africa303 Northern Africa293 Northern Europe275 Western Europe270 Southern Europe260 Northern America126 Southern Africa44 Oceania44 Australia and New Zealand Subregion2,277 Mexico1,182 Guatemala1,001 Iraq529 China352 Honduras338 India271 Philippines260 Canada252 Germany250 Cuba242 Argentina216 Greece198 Democratic Republic of Congo (Zaire)185 Russia180 Colombia179 El Salvador176 Iran171 Moldova168 United Kingdom167 Ukraine159 Vietnam143 Romania142 Tanzania133 Korea126 South Africa125 Bangladesh112 Senegal112 Taiwan103 Jamaica103 England98 Sudan98 Cameroon83 Nigeria83 Thailand82 Venezuela77 Brazil71 Bolivia63 Jordan60 Malaysia58 Egypt58 Congo55 Lebanon54 Ghana54 Italy53 Nepal53 Israel50 Ethiopia49 Panama49 Indonesia47 Peru45 Haiti45 Japan45 Turkey44 New Zealand41 Kenya39 West Indies38 Afghanistan37 Liberia36 Sri Lanka36 Guyana35 Nicaragua31 Poland30 Belize30 Dominican Republic26 Morocco25 Hong Kong21 Bulgaria20 Algeria19 Armenia18 Kazakhstan18 Somalia16 Czechoslovakia16 Denmark16 Sierra Leone16 France14 Kuwait14 Uganda12 Togo12 Costa Rica11 Bosnia and Herzegovina11 Trinidad and Tobago9 Pakistan8 North Macedonia (Macedonia)8 Ecuador7 Bahamas6 Uzbekistan5 Ireland5 Chile4 Uruguay1 Burma (Myanmar)
Grandparents responsible for own grandchildren in Knoxville
Grandparents (30 to 59 years) White / Caucasian 546 49.7% Responsible for grandchildren551 50.3% Not responsible for grandchildrenBlack or African American 150 77.4% Responsible for grandchildren44 22.6% Not responsible for grandchildrenAsian 62 100.0% Not responsible for grandchildrenTwo or more races 111 100.0% Not responsible for grandchildrenWhite alone, not Hispanic / Latino 546 51.2% Responsible for grandchildren520 48.8% Not responsible for grandchildrenHispanic or Latino 66 100.0% Not responsible for grandchildrenGrandparents (60 years and over) White / Caucasian 877 66.5% Responsible for grandchildren441 33.5% Not responsible for grandchildrenBlack or African American 268 63.4% Responsible for grandchildren155 36.6% Not responsible for grandchildrenAsian 39 100.0% Not responsible for grandchildrenTwo or more races 115 66.9% Responsible for grandchildren57 33.1% Not responsible for grandchildrenWhite alone, not Hispanic / Latino 891 68.7% Responsible for grandchildren407 31.3% Not responsible for grandchildrenHispanic or Latino 44 24.5% Responsible for grandchildren135 75.5% Not responsible for grandchildren
Zip codes: 37849 , 37871 , 37902 , 37909 , 37912 , 37914 , 37915 , 37916 , 37917 , 37918 , 37919 , 37921 , 37922 , 37923 , 37924 , 37931 .