Races in La Homa, Texas (TX) Detailed Stats
Data:
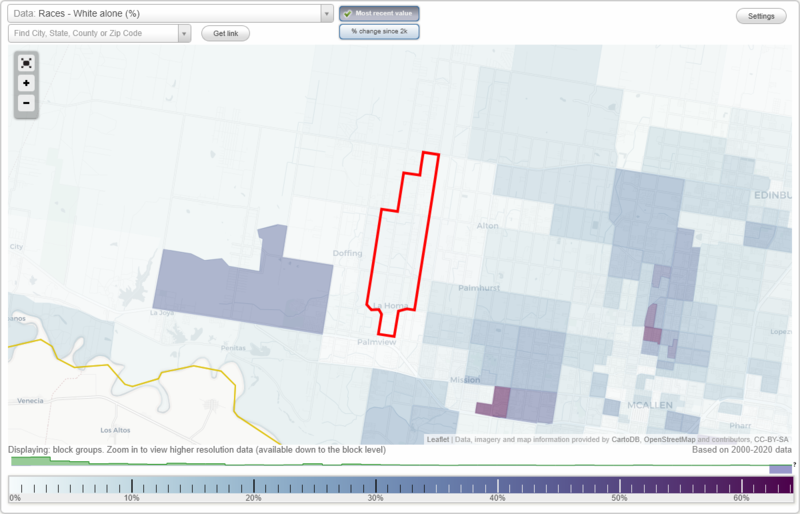
Races - White alone (%)
Races - White alone (% change since 2000)
Races - Black alone (%)
Races - Black alone (% change since 2000)
Races - American Indian alone (%)
Races - American Indian alone (% change since 2000)
Races - Asian alone (%)
Races - Asian alone (% change since 2000)
Races - Hispanic (%)
Races - Hispanic (% change since 2000)
Races - Native Hawaiian and Other Pacific Islander alone (%)
Races - Native Hawaiian and Other Pacific Islander alone (% change since 2000)
Races - Two or more races(%)
Races - Two or more races(% change since 2000)
Races - Other race alone (%)
Races - Other race alone (% change since 2000)
Racial diversity
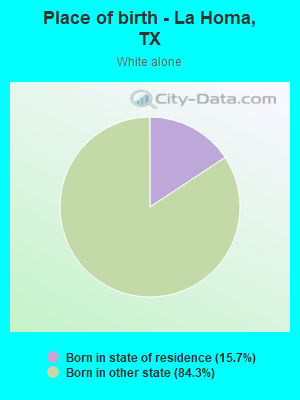
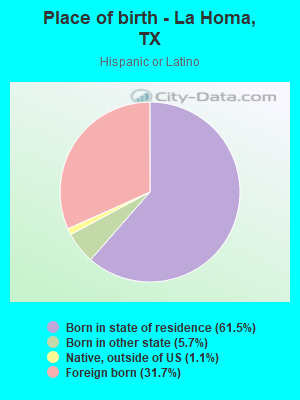
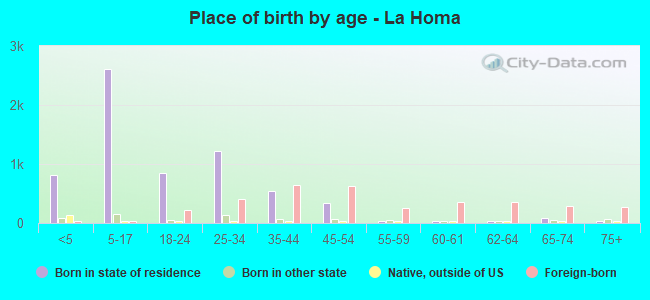
Place of birth - Born in state of residence (%)
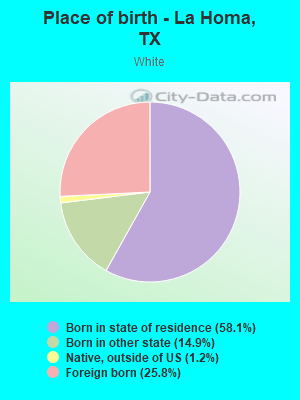
Place of birth - Born in state of residence (%) - White
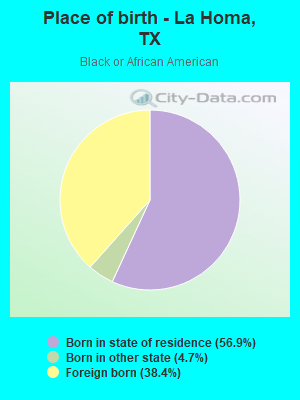
Place of birth - Born in state of residence (%) - Black or African American
Place of birth - Born in state of residence (%) - Asian
Place of birth - Born in state of residence (%) - Hispanic or Latino
Place of birth - Born in state of residence (%) - American Indian and Alaska Native
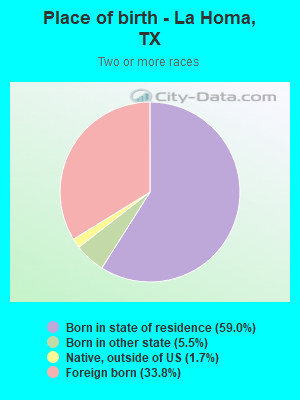
Place of birth - Born in state of residence (%) - Multirace
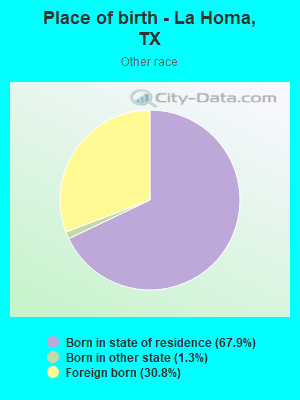
Place of birth - Born in state of residence (%) - Other Race
Place of birth - Born in other state (%)
Place of birth - Born in other state (%) - White
Place of birth - Born in other state (%) - Black or African American
Place of birth - Born in other state (%) - Asian
Place of birth - Born in other state (%) - Hispanic or Latino
Place of birth - Born in other state (%) - American Indian and Alaska Native
Place of birth - Born in other state (%) - Multirace
Place of birth - Born in other state (%) - Other Race
Place of birth - Native, outside of US (%)
Place of birth - Native, outside of US (%) - White
Place of birth - Native, outside of US (%) - Black or African American
Place of birth - Native, outside of US (%) - Asian
Place of birth - Native, outside of US (%) - Hispanic or Latino
Place of birth - Native, outside of US (%) - American Indian and Alaska Native
Place of birth - Native, outside of US (%) - Multirace
Place of birth - Native, outside of US (%) - Other Race
Place of birth - Foreign born (%)
Place of birth - Foreign born (%) - White
Place of birth - Foreign born (%) - Black or African American
Place of birth - Foreign born (%) - Asian
Place of birth - Foreign born (%) - Hispanic or Latino
Place of birth - Foreign born (%) - American Indian and Alaska Native
Place of birth - Foreign born (%) - Multirace
Place of birth - Foreign born (%) - Other Race
Residents speaking English at home (%)
Residents speaking English at home - Born in the United States (%)
Residents speaking English at home - Native, born elsewhere (%)
Residents speaking English at home - Foreign born (%)
Residents speaking Spanish at home (%)
Residents speaking Spanish at home - Born in the United States (%)
Residents speaking Spanish at home - Native, born elsewhere (%)
Residents speaking Spanish at home - Foreign born (%)
Residents speaking other language at home (%)
Residents speaking other language at home - Born in the United States (%)
Residents speaking other language at home - Native, born elsewhere (%)
Residents speaking other language at home - Foreign born (%)
Marital status - Never married (%)
Marital status - Now married (%)
Marital status - Separated (%)
Marital status - Widowed (%)
Marital status - Divorced (%)
Ancestries Reported - Arab (%)
Ancestries Reported - Czech (%)
Ancestries Reported - Danish (%)
Ancestries Reported - Dutch (%)
Ancestries Reported - English (%)
Ancestries Reported - French (%)
Ancestries Reported - French Canadian (%)
Ancestries Reported - German (%)
Ancestries Reported - Greek (%)
Ancestries Reported - Hungarian (%)
Ancestries Reported - Irish (%)
Ancestries Reported - Italian (%)
Ancestries Reported - Lithuanian (%)
Ancestries Reported - Norwegian (%)
Ancestries Reported - Polish (%)
Ancestries Reported - Portuguese (%)
Ancestries Reported - Russian (%)
Ancestries Reported - Scotch-Irish (%)
Ancestries Reported - Scottish (%)
Ancestries Reported - Slovak (%)
Ancestries Reported - Subsaharan African (%)
Ancestries Reported - Swedish (%)
Ancestries Reported - Swiss (%)
Ancestries Reported - Ukrainian (%)
Ancestries Reported - United States (%)
Ancestries Reported - Welsh (%)
Ancestries Reported - West Indian (%)
Ancestries Reported - Other (%)
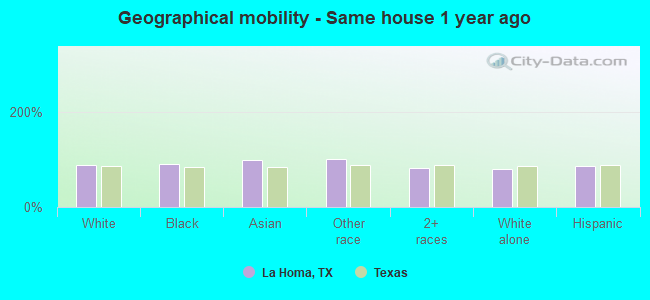
Geographical mobility - Same house 1 year ago (%)
Geographical mobility - Same house 1 year ago (%) - White
Geographical mobility - Same house 1 year ago (%) - Black or African American
Geographical mobility - Same house 1 year ago (%) - Asian
Geographical mobility - Same house 1 year ago (%) - Hispanic or Latino
Geographical mobility - Same house 1 year ago (%) - American Indian and Alaska Native
Geographical mobility - Same house 1 year ago (%) - Multirace
Geographical mobility - Same house 1 year ago (%) - Other Race
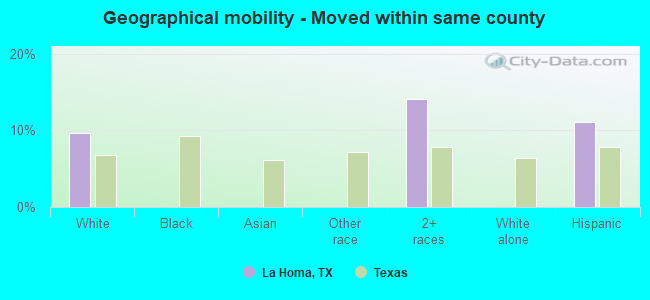
Geographical mobility - Moved within same county (%)
Geographical mobility - Moved within same county (%) - White
Geographical mobility - Moved within same county (%) - Black or African American
Geographical mobility - Moved within same county (%) - Asian
Geographical mobility - Moved within same county (%) - Hispanic or Latino
Geographical mobility - Moved within same county (%) - American Indian and Alaska Native
Geographical mobility - Moved within same county (%) - Multirace
Geographical mobility - Moved within same county (%) - Other Race
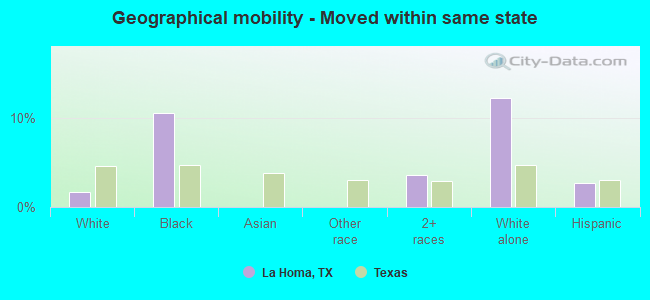
Geographical mobility - Moved from different county within same state (%)
Geographical mobility - Moved from different county within same state (%) - White
Geographical mobility - Moved from different county within same state (%) - Black or African American
Geographical mobility - Moved from different county within same state (%) - Asian
Geographical mobility - Moved from different county within same state (%) - Hispanic or Latino
Geographical mobility - Moved from different county within same state (%) - American Indian and Alaska Native
Geographical mobility - Moved from different county within same state (%) - Multirace
Geographical mobility - Moved from different county within same state (%) - Other Race
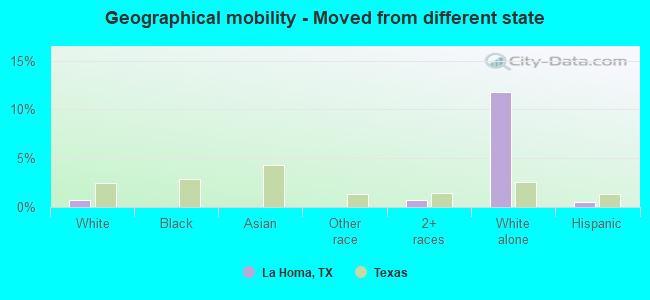
Geographical mobility - Moved from different state (%)
Geographical mobility - Moved from different state (%) - White
Geographical mobility - Moved from different state (%) - Black or African American
Geographical mobility - Moved from different state (%) - Asian
Geographical mobility - Moved from different state (%) - Hispanic or Latino
Geographical mobility - Moved from different state (%) - American Indian and Alaska Native
Geographical mobility - Moved from different state (%) - Multirace
Geographical mobility - Moved from different state (%) - Other Race
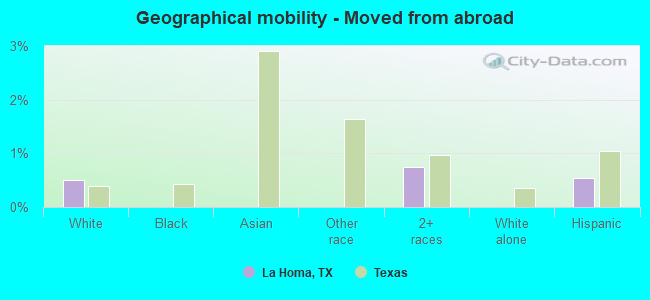
Geographical mobility - Moved from abroad (%)
Geographical mobility - Moved from abroad (%) - White
Geographical mobility - Moved from abroad (%) - Black or African American
Geographical mobility - Moved from abroad (%) - Asian
Geographical mobility - Moved from abroad (%) - Hispanic or Latino
Geographical mobility - Moved from abroad (%) - American Indian and Alaska Native
Geographical mobility - Moved from abroad (%) - Multirace
Geographical mobility - Moved from abroad (%) - Other Race
Place of birth for the foreign-born population - Ireland (%)
Place of birth for the foreign-born population - Denmark (%)
Place of birth for the foreign-born population - Norway (%)
Place of birth for the foreign-born population - Sweden (%)
Place of birth for the foreign-born population - United Kingdom (%)
Place of birth for the foreign-born population - England (%)
Place of birth for the foreign-born population - Scotland (%)
Place of birth for the foreign-born population - Other Northern Europe (%)
Place of birth for the foreign-born population - Austria (%)
Place of birth for the foreign-born population - Belgium (%)
Place of birth for the foreign-born population - France (%)
Place of birth for the foreign-born population - Germany (%)
Place of birth for the foreign-born population - Netherlands (%)
Place of birth for the foreign-born population - Switzerland (%)
Place of birth for the foreign-born population - Other Western Europe (%)
Place of birth for the foreign-born population - Greece (%)
Place of birth for the foreign-born population - Italy (%)
Place of birth for the foreign-born population - Portugal (%)
Place of birth for the foreign-born population - Spain (%)
Place of birth for the foreign-born population - Other Southern Europe (%)
Place of birth for the foreign-born population - Albania (%)
Place of birth for the foreign-born population - Belarus (%)
Place of birth for the foreign-born population - Bosnia and Herzegovina (%)
Place of birth for the foreign-born population - Bulgaria (%)
Place of birth for the foreign-born population - Croatia (%)
Place of birth for the foreign-born population - Czechoslovakia (%)
Place of birth for the foreign-born population - Hungary (%)
Place of birth for the foreign-born population - Latvia (%)
Place of birth for the foreign-born population - Lithuania (%)
Place of birth for the foreign-born population - North Macedonia (Macedonia) (%)
Place of birth for the foreign-born population - Moldova (%)
Place of birth for the foreign-born population - Poland (%)
Place of birth for the foreign-born population - Romania (%)
Place of birth for the foreign-born population - Russia (%)
Place of birth for the foreign-born population - Serbia (%)
Place of birth for the foreign-born population - Ukraine (%)
Place of birth for the foreign-born population - Other Eastern Europe (%)
Place of birth for the foreign-born population - China (%)
Place of birth for the foreign-born population - Hong Kong (%)
Place of birth for the foreign-born population - Taiwan (%)
Place of birth for the foreign-born population - Japan (%)
Place of birth for the foreign-born population - Korea (%)
Place of birth for the foreign-born population - Other Eastern Asia (%)
Place of birth for the foreign-born population - Afghanistan (%)
Place of birth for the foreign-born population - Bangladesh (%)
Place of birth for the foreign-born population - India (%)
Place of birth for the foreign-born population - Iran (%)
Place of birth for the foreign-born population - Kazakhstan (%)
Place of birth for the foreign-born population - Nepal (%)
Place of birth for the foreign-born population - Pakistan (%)
Place of birth for the foreign-born population - Sri Lanka (%)
Place of birth for the foreign-born population - Uzbekistan (%)
Place of birth for the foreign-born population - Other South Central Asia (%)
Place of birth for the foreign-born population - Burma (%)
Place of birth for the foreign-born population - Cambodia (%)
Place of birth for the foreign-born population - Indonesia (%)
Place of birth for the foreign-born population - Laos (%)
Place of birth for the foreign-born population - Malaysia (%)
Place of birth for the foreign-born population - Philippines (%)
Place of birth for the foreign-born population - Singapore (%)
Place of birth for the foreign-born population - Thailand (%)
Place of birth for the foreign-born population - Vietnam (%)
Place of birth for the foreign-born population - Other South Eastern Asia (%)
Place of birth for the foreign-born population - Armenia (%)
Place of birth for the foreign-born population - Iraq (%)
Place of birth for the foreign-born population - Israel (%)
Place of birth for the foreign-born population - Jordan (%)
Place of birth for the foreign-born population - Kuwait (%)
Place of birth for the foreign-born population - Lebanon (%)
Place of birth for the foreign-born population - Saudi Arabia (%)
Place of birth for the foreign-born population - Syria (%)
Place of birth for the foreign-born population - Turkey (%)
Place of birth for the foreign-born population - Yemen (%)
Place of birth for the foreign-born population - Other Western Asia (%)
Place of birth for the foreign-born population - Eritrea (%)
Place of birth for the foreign-born population - Ethiopia (%)
Place of birth for the foreign-born population - Kenya (%)
Place of birth for the foreign-born population - Somalia (%)
Place of birth for the foreign-born population - Uganda (%)
Place of birth for the foreign-born population - Zimbabwe (%)
Place of birth for the foreign-born population - Other Eastern Africa (%)
Place of birth for the foreign-born population - Cameroon (%)
Place of birth for the foreign-born population - Congo (%)
Place of birth for the foreign-born population - Democratic Republic of Congo (Zaire) (%)
Place of birth for the foreign-born population - Other Middle Africa (%)
Place of birth for the foreign-born population - Egypt (%)
Place of birth for the foreign-born population - Morocco (%)
Place of birth for the foreign-born population - Sudan (%)
Place of birth for the foreign-born population - Other Northern Africa (%)
Place of birth for the foreign-born population - South Africa (%)
Place of birth for the foreign-born population - Other Southern Africa (%)
Place of birth for the foreign-born population - Cabo Verde (%)
Place of birth for the foreign-born population - Ghana (%)
Place of birth for the foreign-born population - Liberia (%)
Place of birth for the foreign-born population - Nigeria (%)
Place of birth for the foreign-born population - Senegal (%)
Place of birth for the foreign-born population - Sierra Leone (%)
Place of birth for the foreign-born population - Other Western Africa (%)
Place of birth for the foreign-born population - Australia (%)
Place of birth for the foreign-born population - New Zealand (%)
Place of birth for the foreign-born population - Fiji (%)
Place of birth for the foreign-born population - Micronesia (%)
Place of birth for the foreign-born population - Bahamas (%)
Place of birth for the foreign-born population - Barbados (%)
Place of birth for the foreign-born population - Cuba (%)
Place of birth for the foreign-born population - Dominica (%)
Place of birth for the foreign-born population - Dominican Republic (%)
Place of birth for the foreign-born population - Grenada (%)
Place of birth for the foreign-born population - Haiti (%)
Place of birth for the foreign-born population - Jamaica (%)
Place of birth for the foreign-born population - St. Vincent and the Grenadines (%)
Place of birth for the foreign-born population - Trinidad and Tobago (%)
Place of birth for the foreign-born population - West Indies (%)
Place of birth for the foreign-born population - Other Caribbean (%)
Place of birth for the foreign-born population - Belize (%)
Place of birth for the foreign-born population - Costa Rica (%)
Place of birth for the foreign-born population - El Salvador (%)
Place of birth for the foreign-born population - Guatemala (%)
Place of birth for the foreign-born population - Honduras (%)
Place of birth for the foreign-born population - Mexico (%)
Place of birth for the foreign-born population - Nicaragua (%)
Place of birth for the foreign-born population - Panama (%)
Place of birth for the foreign-born population - Other Central America (%)
Place of birth for the foreign-born population - Argentina (%)
Place of birth for the foreign-born population - Bolivia (%)
Place of birth for the foreign-born population - Brazil (%)
Place of birth for the foreign-born population - Chile (%)
Place of birth for the foreign-born population - Colombia (%)
Place of birth for the foreign-born population - Ecuador (%)
Place of birth for the foreign-born population - Guyana (%)
Place of birth for the foreign-born population - Peru (%)
Place of birth for the foreign-born population - Uruguay (%)
Place of birth for the foreign-born population - Venezuela (%)
Place of birth for the foreign-born population - Other South America (%)
Place of birth for the foreign-born population - Canada (%)
Place of birth for the foreign-born population - Other Northern America (%)
Place of birth for the foreign-born population - Other (%)
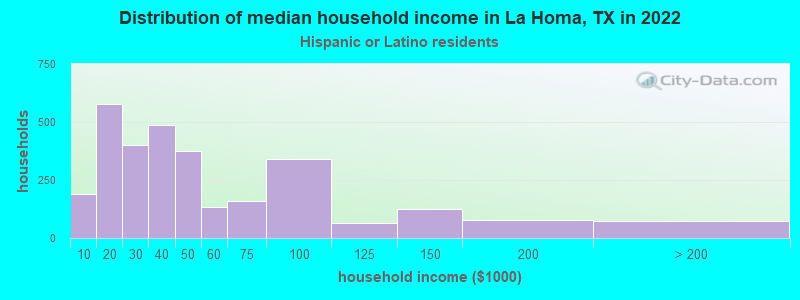
According to 2022 data, the most numerous races in La Homa, TX are Hispanic (10,642 residents), White alone (174 residents), and Black alone (6 residents). 7.7% of La Homa residents speak English at home. 31.7% of La Homa, TX residents are foreign-born (30.9% born in Latin America), which is 46.3% greater than the foreign-born rate of 17.0% across the entire state of Texas.
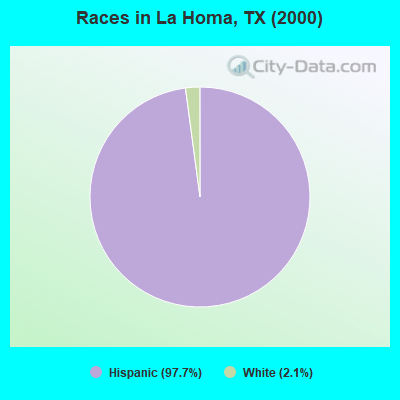
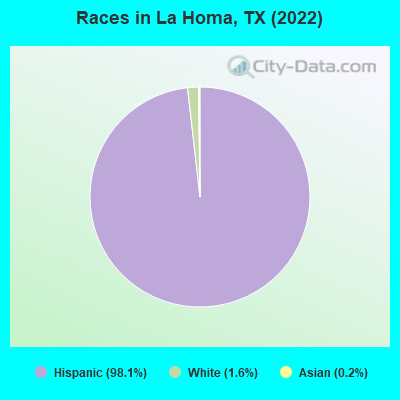
Race distribution in La Homa
2000 2022
10,933,313 52.4% White alone 6,669,666 32.0% Hispanic 2,364,255 11.3% Black alone 554,445 2.7% Asian alone 230,567 1.1% Two or more races 68,859 0.3% American Indian alone 19,958 0.10% Other race alone 10,757 0.05% Native Hawaiian and Other
12,070,642 40.2% Hispanic 11,683,430 38.9% White alone 3,508,706 11.7% Black alone 1,608,173 5.4% Asian alone 956,560 3.2% Two or more races 125,763 0.4% Other race alone 47,023 0.2% American Indian alone 29,275 0.10% Native Hawaiian and Other
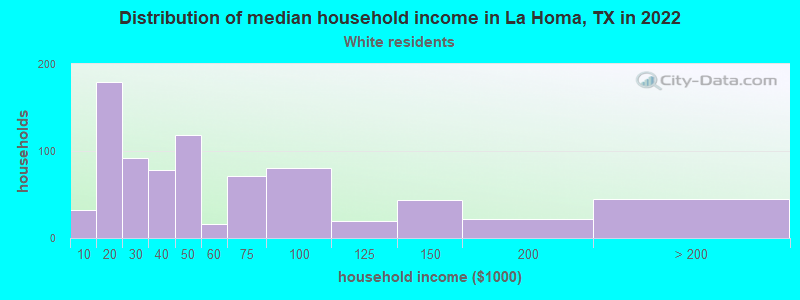
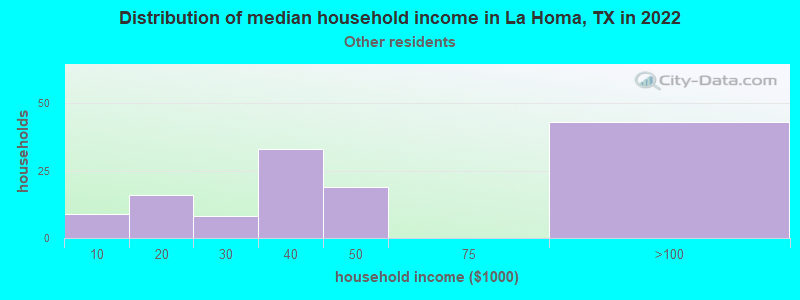
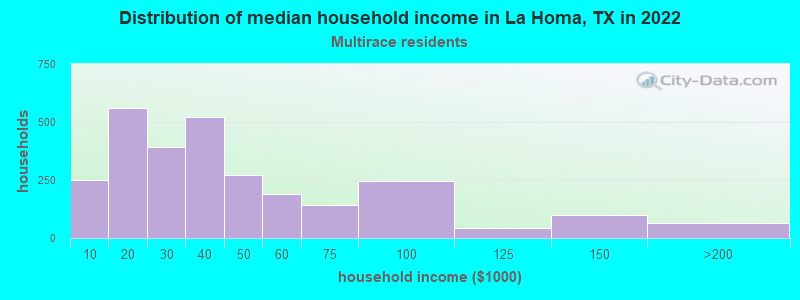
Income and house value in La Homa Median household income in 2022 $64,231 White non-Hispanic householders$44,247 Some other race householders$31,517 Two or more races householders$37,749 Hispanic or Latino race householdersMedian 2022 house value $460,677 White Non-Hispanic householders$147,416 Some other race householders$77,960 Two or more races householders$104,325 Hispanic or Latino householders
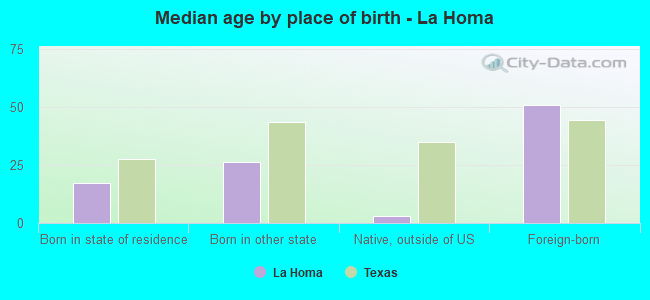
Median age by race in La Homa
31.8 Median age for White residents28.5 37.7 4.8 Median age for Black or African American residents4.7 -489,388,264.2 -560,747,663.0 Median age for American Indian / Alaska Native residents-575,645,755.9 -627,650,550.7 44.8 Median age for Asian residents-602,763,384.5 -710,659,897.8 -581,560,283.1 Median age for Native Hawaiian / Pacific Islander residents-612,729,233.5 -577,777,777.2 27.9 Median age for Other race residents29.1 22.0 26.4 Median age for Two or more races residents26.2 26.1 70.2 Median age for White alone residents72.8 71.3 28.0 Median age for Hispanic or Latino residents27.8 29.1
Owner/renter occupied households by race in La Homa
House owners and renters - White residents 570 84.6% Owner occupied104 15.4% Renter occupiedHouse owners and renters - Black or African American residents 33 100.0% Owner occupiedHouse owners and renters - Asian residents 4 100.0% Owner occupiedHouse owners and renters - Other race residents 118 93.0% Owner occupied9 7.0% Renter occupiedHouse owners and renters - Two or more races residents 2,224 80.8% Owner occupied528 19.2% Renter occupiedHouse owners and renters - White alone residents 87 100.0% Owner occupiedHouse owners and renters - Hispanic or Latino residents 2,439 82.6% Owner occupied515 17.4% Renter occupied
Language usage in La Homa
English speakers - Total 7.7% of residents of La Homa speak English at home.
91.4% of residents speak Spanish at home 5,288 58.9% Speak English very well3,688 41.1% Speak English less than very well0.7% of residents speak other language at home 72 100.0% Speak English less than very well
English speakers - Born in the United States 21.7% of residents of La Homa speak English at home.
74.1% of residents speak Spanish at home 392 76.4% Speak English very well121 23.6% Speak English less than very well
English speakers - Native, born elsewhere 42.9% of residents of La Homa speak English at home.
28.6% of residents speak Spanish at home 6 100.0% Speak English very well
English speakers - Foreign-born 5.3% of residents of La Homa speak English at home.
92.8% of residents speak Spanish at home 530 16.8% Speak English very well2,627 83.2% Speak English less than very well1.9% of residents speak other language at home 65 100.0% Speak English less than very well
White (Caucasian) - Speak only English Native:
18.7% (303)Foreign-born:
2.8% (16)
White (Caucasian) - Speak another language Native:
71.2% (1,153)Foreign-born:
86.1% (488)
Other race - Speak only English Native:
15.4% (52)Foreign-born:
14.2% (24)
Other race - Speak another language Native:
83.0% (278)Foreign-born:
87.1% (147)
Two or more races - Speak only English Native:
4.4% (239)Foreign-born:
6.6% (232)
Two or more races - Speak another language Native:
96.9% (5,221)Foreign-born:
93.9% (3,310)
Hispanic or Latino - Speak only English Native:
6.8% (427)Foreign-born:
5.6% (188)
Hispanic or Latino - Speak another language Native:
93.1% (5,811)Foreign-born:
94.6% (3,191)
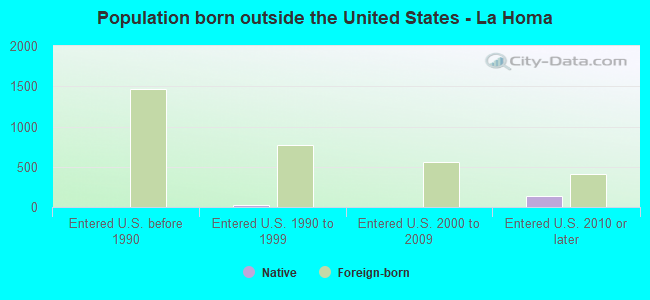
Foreign-born residents in La Homa 3,437 residents are foreign born (30.9% Latin America ).
This city:
31.7%Texas:
17.1%
Marital status for residents in La Homa Marital status - White (Caucasian) population 15 years and over
Males 34.6% Never married58.0% Now married0.0% Separated1.7% Widowed5.7% DivorcedFemales 23.8% Never married45.4% Now married8.2% Separated9.4% Widowed13.2% DivorcedWomen who gave birth in the past 12 months Now married:
47.1% (4)Unmarried:
52.9% (4)
Women who did not give birth in the past 12 months Now married:
57.4% (282)Unmarried:
42.6% (210)
Marital status - Black or African American population 15 years and over
Males 0.0% Never married0.0% Now married0.0% Separated0.0% Widowed100.0% DivorcedFemales 100.0% Never married0.0% Now married0.0% Separated0.0% Widowed0.0% DivorcedWomen who gave birth in the past 12 months Now married:
0.0% (0)Unmarried:
100.0% (3)
Women who did not give birth in the past 12 months Now married:
0.0% (0)Unmarried:
100.0% (26)
Marital status - Asian population 15 years and over
Males 100.0% Never married0.0% Now married0.0% Separated0.0% Widowed0.0% DivorcedFemales 100.0% Never married0.0% Now married0.0% Separated0.0% Widowed0.0% DivorcedWomen who did not give birth in the past 12 months Now married:
0.0% (0)Unmarried:
100.0% (4)
Marital status - Other race population 15 years and over
Males 54.5% Never married40.9% Now married4.5% Separated0.0% Widowed0.0% DivorcedFemales 47.5% Never married36.7% Now married15.8% Separated0.0% Widowed0.0% DivorcedWomen who did not give birth in the past 12 months Now married:
24.0% (32)Unmarried:
76.0% (101)
Marital status - Two or more races population 15 years and over
Males 32.5% Never married57.8% Now married0.0% Separated1.1% Widowed8.6% DivorcedFemales 28.9% Never married49.8% Now married10.3% Separated4.5% Widowed6.6% DivorcedWomen who gave birth in the past 12 months Now married:
48.7% (141)Unmarried:
51.3% (148)
Women who did not give birth in the past 12 months Now married:
53.7% (1,146)Unmarried:
46.3% (987)
Marital status - White alone, not Hispanic / Latino population 15 years and over
Males 1.5% Never married85.3% Now married0.0% Separated13.2% Widowed0.0% DivorcedFemales 19.6% Never married45.8% Now married0.0% Separated28.0% Widowed6.5% DivorcedWomen who did not give birth in the past 12 months Now married:
0.0% (0)Unmarried:
100.0% (22)
Marital status - Hispanic or Latino population 15 years and over
Males 35.5% Never married56.2% Now married0.3% Separated1.0% Widowed7.0% DivorcedFemales 28.5% Never married46.7% Now married9.9% Separated5.8% Widowed9.2% DivorcedWomen who gave birth in the past 12 months Now married:
48.6% (87)Unmarried:
51.4% (92)
Women who did not give birth in the past 12 months Now married:
53.5% (1,333)Unmarried:
46.5% (1,160)
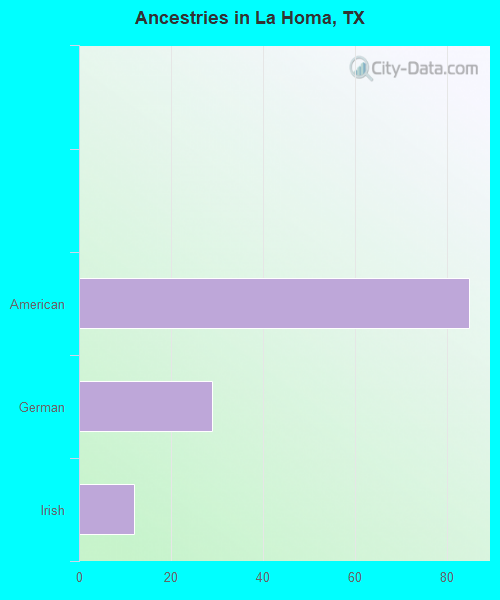
Ancestries in La Homa
85 0.9% American29 0.3% German12 0.1% Irish
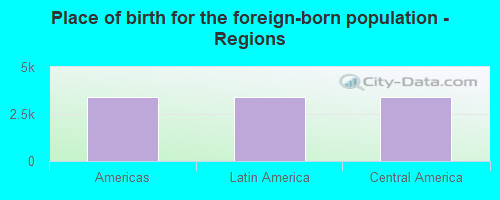
Children Nativity (place of birth) in La Homa
Children under 6 years - Living with two parents Both parents native 403 100.0% NativeBoth parents foreign-born 41 100.0% NativeOne native, one foreign-born parent 140 100.0% NativeChildren under 6 years - Living with one parent Native parent 579 100.0% NativeForeign-born parent 166 100.0% NativeChildren 6 to 17 years - Living with two parents Both parents native 366 100.0% NativeBoth parents foreign-born 478 100.0% NativeOne native, one foreign-born parent 592 100.0% NativeChildren 6 to 17 years - Living with one parent Native parent 350 100.0% NativeForeign-born parent 555 50.0% Native555 50.0% Foreign-born
Place of birth for residents in La Homa 3,413 Americas3,413 Latin America3,413 Central America23 Asia23 South Eastern Asia
Grandparents responsible for own grandchildren in La Homa
Grandparents (30 to 59 years) White / Caucasian 34 100.0% Not responsible for grandchildrenOther race 5 100.0% Not responsible for grandchildrenTwo or more races 51 20.7% Responsible for grandchildren197 79.3% Not responsible for grandchildrenHispanic or Latino 29 15.3% Responsible for grandchildren163 84.7% Not responsible for grandchildrenGrandparents (60 years and over) White / Caucasian 5 12.4% Responsible for grandchildren34 87.6% Not responsible for grandchildrenTwo or more races 37 12.9% Responsible for grandchildren249 87.1% Not responsible for grandchildrenHispanic or Latino 32 15.9% Responsible for grandchildren168 84.1% Not responsible for grandchildren