Races in La Presa, California (CA) Detailed Stats
Data:
Races - White alone (%)
Races - White alone (% change since 2000)
Races - Black alone (%)
Races - Black alone (% change since 2000)
Races - American Indian alone (%)
Races - American Indian alone (% change since 2000)
Races - Asian alone (%)
Races - Asian alone (% change since 2000)
Races - Hispanic (%)
Races - Hispanic (% change since 2000)
Races - Native Hawaiian and Other Pacific Islander alone (%)
Races - Native Hawaiian and Other Pacific Islander alone (% change since 2000)
Races - Two or more races(%)
Races - Two or more races(% change since 2000)
Races - Other race alone (%)
Races - Other race alone (% change since 2000)
Racial diversity
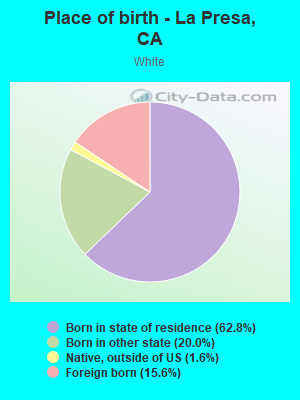
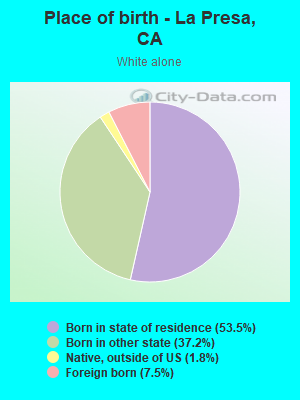
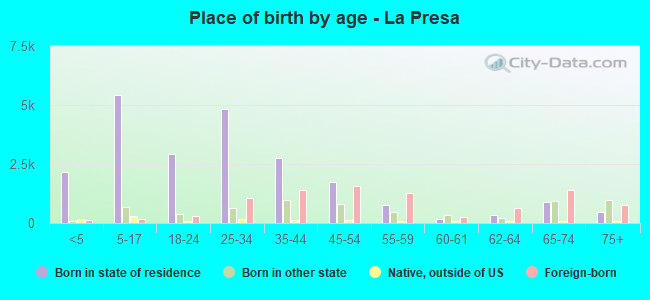
Place of birth - Born in state of residence (%)
Place of birth - Born in state of residence (%) - White
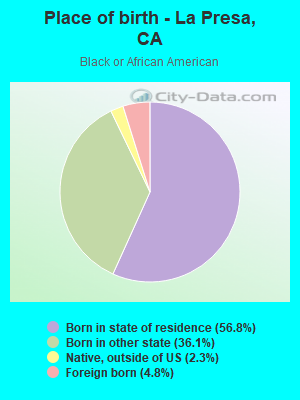
Place of birth - Born in state of residence (%) - Black or African American
Place of birth - Born in state of residence (%) - Asian
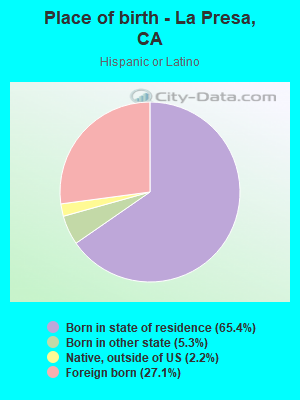
Place of birth - Born in state of residence (%) - Hispanic or Latino
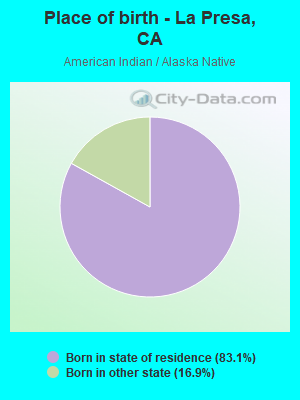
Place of birth - Born in state of residence (%) - American Indian and Alaska Native
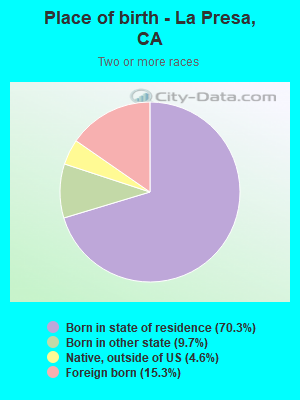
Place of birth - Born in state of residence (%) - Multirace
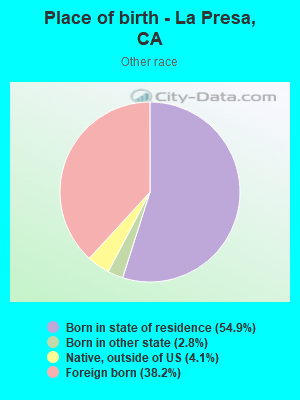
Place of birth - Born in state of residence (%) - Other Race
Place of birth - Born in other state (%)
Place of birth - Born in other state (%) - White
Place of birth - Born in other state (%) - Black or African American
Place of birth - Born in other state (%) - Asian
Place of birth - Born in other state (%) - Hispanic or Latino
Place of birth - Born in other state (%) - American Indian and Alaska Native
Place of birth - Born in other state (%) - Multirace
Place of birth - Born in other state (%) - Other Race
Place of birth - Native, outside of US (%)
Place of birth - Native, outside of US (%) - White
Place of birth - Native, outside of US (%) - Black or African American
Place of birth - Native, outside of US (%) - Asian
Place of birth - Native, outside of US (%) - Hispanic or Latino
Place of birth - Native, outside of US (%) - American Indian and Alaska Native
Place of birth - Native, outside of US (%) - Multirace
Place of birth - Native, outside of US (%) - Other Race
Place of birth - Foreign born (%)
Place of birth - Foreign born (%) - White
Place of birth - Foreign born (%) - Black or African American
Place of birth - Foreign born (%) - Asian
Place of birth - Foreign born (%) - Hispanic or Latino
Place of birth - Foreign born (%) - American Indian and Alaska Native
Place of birth - Foreign born (%) - Multirace
Place of birth - Foreign born (%) - Other Race
Residents speaking English at home (%)
Residents speaking English at home - Born in the United States (%)
Residents speaking English at home - Native, born elsewhere (%)
Residents speaking English at home - Foreign born (%)
Residents speaking Spanish at home (%)
Residents speaking Spanish at home - Born in the United States (%)
Residents speaking Spanish at home - Native, born elsewhere (%)
Residents speaking Spanish at home - Foreign born (%)
Residents speaking other language at home (%)
Residents speaking other language at home - Born in the United States (%)
Residents speaking other language at home - Native, born elsewhere (%)
Residents speaking other language at home - Foreign born (%)
Marital status - Never married (%)
Marital status - Now married (%)
Marital status - Separated (%)
Marital status - Widowed (%)
Marital status - Divorced (%)
Ancestries Reported - Arab (%)
Ancestries Reported - Czech (%)
Ancestries Reported - Danish (%)
Ancestries Reported - Dutch (%)
Ancestries Reported - English (%)
Ancestries Reported - French (%)
Ancestries Reported - French Canadian (%)
Ancestries Reported - German (%)
Ancestries Reported - Greek (%)
Ancestries Reported - Hungarian (%)
Ancestries Reported - Irish (%)
Ancestries Reported - Italian (%)
Ancestries Reported - Lithuanian (%)
Ancestries Reported - Norwegian (%)
Ancestries Reported - Polish (%)
Ancestries Reported - Portuguese (%)
Ancestries Reported - Russian (%)
Ancestries Reported - Scotch-Irish (%)
Ancestries Reported - Scottish (%)
Ancestries Reported - Slovak (%)
Ancestries Reported - Subsaharan African (%)
Ancestries Reported - Swedish (%)
Ancestries Reported - Swiss (%)
Ancestries Reported - Ukrainian (%)
Ancestries Reported - United States (%)
Ancestries Reported - Welsh (%)
Ancestries Reported - West Indian (%)
Ancestries Reported - Other (%)
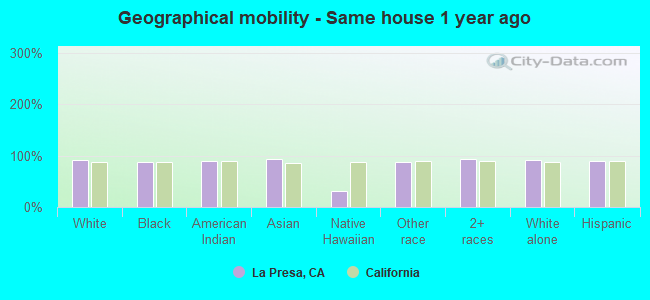
Geographical mobility - Same house 1 year ago (%)
Geographical mobility - Same house 1 year ago (%) - White
Geographical mobility - Same house 1 year ago (%) - Black or African American
Geographical mobility - Same house 1 year ago (%) - Asian
Geographical mobility - Same house 1 year ago (%) - Hispanic or Latino
Geographical mobility - Same house 1 year ago (%) - American Indian and Alaska Native
Geographical mobility - Same house 1 year ago (%) - Multirace
Geographical mobility - Same house 1 year ago (%) - Other Race
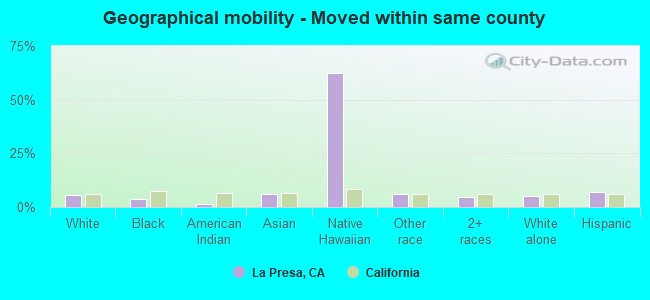
Geographical mobility - Moved within same county (%)
Geographical mobility - Moved within same county (%) - White
Geographical mobility - Moved within same county (%) - Black or African American
Geographical mobility - Moved within same county (%) - Asian
Geographical mobility - Moved within same county (%) - Hispanic or Latino
Geographical mobility - Moved within same county (%) - American Indian and Alaska Native
Geographical mobility - Moved within same county (%) - Multirace
Geographical mobility - Moved within same county (%) - Other Race
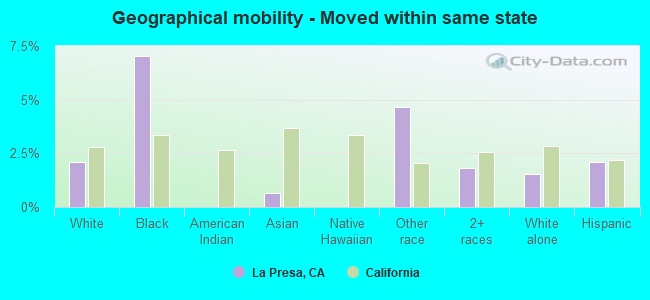
Geographical mobility - Moved from different county within same state (%)
Geographical mobility - Moved from different county within same state (%) - White
Geographical mobility - Moved from different county within same state (%) - Black or African American
Geographical mobility - Moved from different county within same state (%) - Asian
Geographical mobility - Moved from different county within same state (%) - Hispanic or Latino
Geographical mobility - Moved from different county within same state (%) - American Indian and Alaska Native
Geographical mobility - Moved from different county within same state (%) - Multirace
Geographical mobility - Moved from different county within same state (%) - Other Race
Geographical mobility - Moved from different state (%)
Geographical mobility - Moved from different state (%) - White
Geographical mobility - Moved from different state (%) - Black or African American
Geographical mobility - Moved from different state (%) - Asian
Geographical mobility - Moved from different state (%) - Hispanic or Latino
Geographical mobility - Moved from different state (%) - American Indian and Alaska Native
Geographical mobility - Moved from different state (%) - Multirace
Geographical mobility - Moved from different state (%) - Other Race
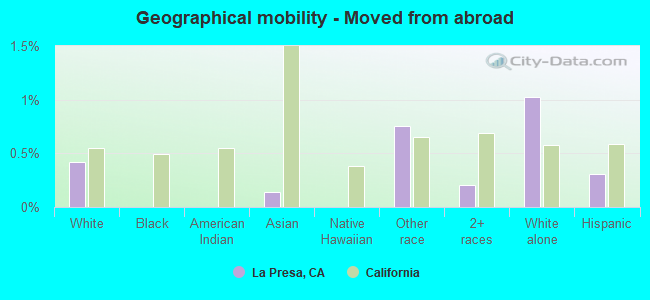
Geographical mobility - Moved from abroad (%)
Geographical mobility - Moved from abroad (%) - White
Geographical mobility - Moved from abroad (%) - Black or African American
Geographical mobility - Moved from abroad (%) - Asian
Geographical mobility - Moved from abroad (%) - Hispanic or Latino
Geographical mobility - Moved from abroad (%) - American Indian and Alaska Native
Geographical mobility - Moved from abroad (%) - Multirace
Geographical mobility - Moved from abroad (%) - Other Race
Place of birth for the foreign-born population - Ireland (%)
Place of birth for the foreign-born population - Denmark (%)
Place of birth for the foreign-born population - Norway (%)
Place of birth for the foreign-born population - Sweden (%)
Place of birth for the foreign-born population - United Kingdom (%)
Place of birth for the foreign-born population - England (%)
Place of birth for the foreign-born population - Scotland (%)
Place of birth for the foreign-born population - Other Northern Europe (%)
Place of birth for the foreign-born population - Austria (%)
Place of birth for the foreign-born population - Belgium (%)
Place of birth for the foreign-born population - France (%)
Place of birth for the foreign-born population - Germany (%)
Place of birth for the foreign-born population - Netherlands (%)
Place of birth for the foreign-born population - Switzerland (%)
Place of birth for the foreign-born population - Other Western Europe (%)
Place of birth for the foreign-born population - Greece (%)
Place of birth for the foreign-born population - Italy (%)
Place of birth for the foreign-born population - Portugal (%)
Place of birth for the foreign-born population - Spain (%)
Place of birth for the foreign-born population - Other Southern Europe (%)
Place of birth for the foreign-born population - Albania (%)
Place of birth for the foreign-born population - Belarus (%)
Place of birth for the foreign-born population - Bosnia and Herzegovina (%)
Place of birth for the foreign-born population - Bulgaria (%)
Place of birth for the foreign-born population - Croatia (%)
Place of birth for the foreign-born population - Czechoslovakia (%)
Place of birth for the foreign-born population - Hungary (%)
Place of birth for the foreign-born population - Latvia (%)
Place of birth for the foreign-born population - Lithuania (%)
Place of birth for the foreign-born population - North Macedonia (Macedonia) (%)
Place of birth for the foreign-born population - Moldova (%)
Place of birth for the foreign-born population - Poland (%)
Place of birth for the foreign-born population - Romania (%)
Place of birth for the foreign-born population - Russia (%)
Place of birth for the foreign-born population - Serbia (%)
Place of birth for the foreign-born population - Ukraine (%)
Place of birth for the foreign-born population - Other Eastern Europe (%)
Place of birth for the foreign-born population - China (%)
Place of birth for the foreign-born population - Hong Kong (%)
Place of birth for the foreign-born population - Taiwan (%)
Place of birth for the foreign-born population - Japan (%)
Place of birth for the foreign-born population - Korea (%)
Place of birth for the foreign-born population - Other Eastern Asia (%)
Place of birth for the foreign-born population - Afghanistan (%)
Place of birth for the foreign-born population - Bangladesh (%)
Place of birth for the foreign-born population - India (%)
Place of birth for the foreign-born population - Iran (%)
Place of birth for the foreign-born population - Kazakhstan (%)
Place of birth for the foreign-born population - Nepal (%)
Place of birth for the foreign-born population - Pakistan (%)
Place of birth for the foreign-born population - Sri Lanka (%)
Place of birth for the foreign-born population - Uzbekistan (%)
Place of birth for the foreign-born population - Other South Central Asia (%)
Place of birth for the foreign-born population - Burma (%)
Place of birth for the foreign-born population - Cambodia (%)
Place of birth for the foreign-born population - Indonesia (%)
Place of birth for the foreign-born population - Laos (%)
Place of birth for the foreign-born population - Malaysia (%)
Place of birth for the foreign-born population - Philippines (%)
Place of birth for the foreign-born population - Singapore (%)
Place of birth for the foreign-born population - Thailand (%)
Place of birth for the foreign-born population - Vietnam (%)
Place of birth for the foreign-born population - Other South Eastern Asia (%)
Place of birth for the foreign-born population - Armenia (%)
Place of birth for the foreign-born population - Iraq (%)
Place of birth for the foreign-born population - Israel (%)
Place of birth for the foreign-born population - Jordan (%)
Place of birth for the foreign-born population - Kuwait (%)
Place of birth for the foreign-born population - Lebanon (%)
Place of birth for the foreign-born population - Saudi Arabia (%)
Place of birth for the foreign-born population - Syria (%)
Place of birth for the foreign-born population - Turkey (%)
Place of birth for the foreign-born population - Yemen (%)
Place of birth for the foreign-born population - Other Western Asia (%)
Place of birth for the foreign-born population - Eritrea (%)
Place of birth for the foreign-born population - Ethiopia (%)
Place of birth for the foreign-born population - Kenya (%)
Place of birth for the foreign-born population - Somalia (%)
Place of birth for the foreign-born population - Uganda (%)
Place of birth for the foreign-born population - Zimbabwe (%)
Place of birth for the foreign-born population - Other Eastern Africa (%)
Place of birth for the foreign-born population - Cameroon (%)
Place of birth for the foreign-born population - Congo (%)
Place of birth for the foreign-born population - Democratic Republic of Congo (Zaire) (%)
Place of birth for the foreign-born population - Other Middle Africa (%)
Place of birth for the foreign-born population - Egypt (%)
Place of birth for the foreign-born population - Morocco (%)
Place of birth for the foreign-born population - Sudan (%)
Place of birth for the foreign-born population - Other Northern Africa (%)
Place of birth for the foreign-born population - South Africa (%)
Place of birth for the foreign-born population - Other Southern Africa (%)
Place of birth for the foreign-born population - Cabo Verde (%)
Place of birth for the foreign-born population - Ghana (%)
Place of birth for the foreign-born population - Liberia (%)
Place of birth for the foreign-born population - Nigeria (%)
Place of birth for the foreign-born population - Senegal (%)
Place of birth for the foreign-born population - Sierra Leone (%)
Place of birth for the foreign-born population - Other Western Africa (%)
Place of birth for the foreign-born population - Australia (%)
Place of birth for the foreign-born population - New Zealand (%)
Place of birth for the foreign-born population - Fiji (%)
Place of birth for the foreign-born population - Micronesia (%)
Place of birth for the foreign-born population - Bahamas (%)
Place of birth for the foreign-born population - Barbados (%)
Place of birth for the foreign-born population - Cuba (%)
Place of birth for the foreign-born population - Dominica (%)
Place of birth for the foreign-born population - Dominican Republic (%)
Place of birth for the foreign-born population - Grenada (%)
Place of birth for the foreign-born population - Haiti (%)
Place of birth for the foreign-born population - Jamaica (%)
Place of birth for the foreign-born population - St. Vincent and the Grenadines (%)
Place of birth for the foreign-born population - Trinidad and Tobago (%)
Place of birth for the foreign-born population - West Indies (%)
Place of birth for the foreign-born population - Other Caribbean (%)
Place of birth for the foreign-born population - Belize (%)
Place of birth for the foreign-born population - Costa Rica (%)
Place of birth for the foreign-born population - El Salvador (%)
Place of birth for the foreign-born population - Guatemala (%)
Place of birth for the foreign-born population - Honduras (%)
Place of birth for the foreign-born population - Mexico (%)
Place of birth for the foreign-born population - Nicaragua (%)
Place of birth for the foreign-born population - Panama (%)
Place of birth for the foreign-born population - Other Central America (%)
Place of birth for the foreign-born population - Argentina (%)
Place of birth for the foreign-born population - Bolivia (%)
Place of birth for the foreign-born population - Brazil (%)
Place of birth for the foreign-born population - Chile (%)
Place of birth for the foreign-born population - Colombia (%)
Place of birth for the foreign-born population - Ecuador (%)
Place of birth for the foreign-born population - Guyana (%)
Place of birth for the foreign-born population - Peru (%)
Place of birth for the foreign-born population - Uruguay (%)
Place of birth for the foreign-born population - Venezuela (%)
Place of birth for the foreign-born population - Other South America (%)
Place of birth for the foreign-born population - Canada (%)
Place of birth for the foreign-born population - Other Northern America (%)
Place of birth for the foreign-born population - Other (%)
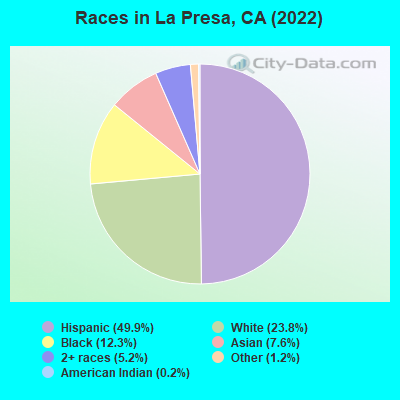
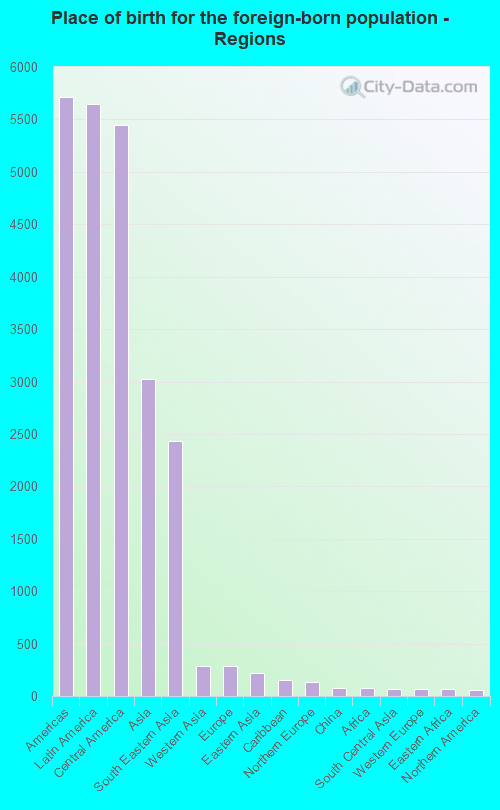
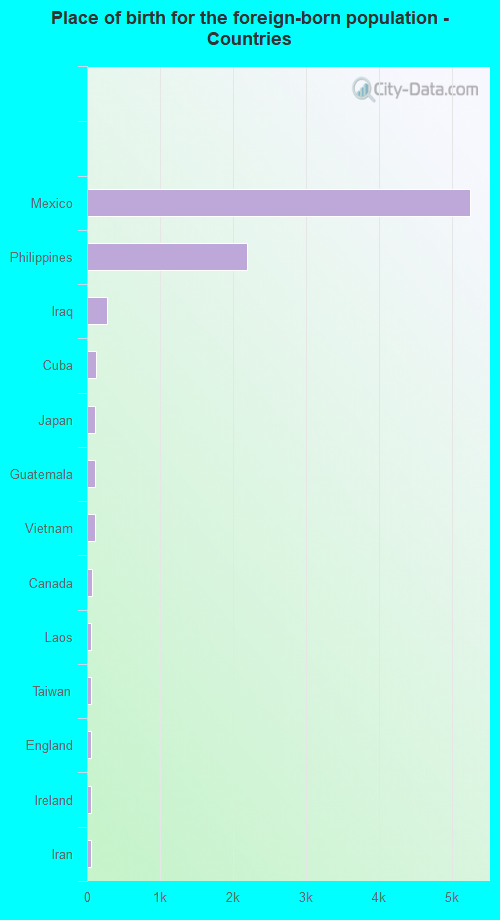
According to 2022 data, the most numerous races in La Presa, CA are Hispanic (19,866 residents), White alone (8,507 residents), and Asian alone (4,278 residents). 54.7% of La Presa residents speak English at home. 23.6% of La Presa, CA residents are foreign-born (14.6% born in Latin America, 7.8% born in Asia), which is 10.2% less than the foreign-born rate of 26.0% across the entire state of California.
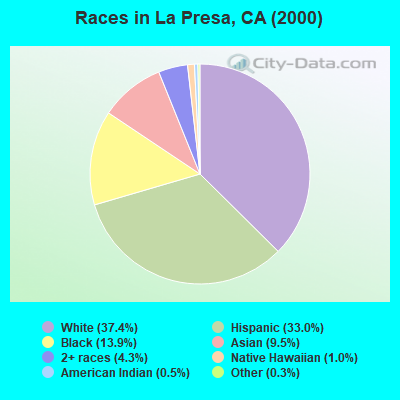
Race distribution in La Presa
2000 2022
12,238 37.4% White alone 10,813 33.0% Hispanic 4,563 13.9% Black alone 3,122 9.5% Asian alone 1,404 4.3% Two or more races 327 1.0% Native Hawaiian and Other 162 0.5% American Indian alone 92 0.3% Other race alone
19,866 51.5% Hispanic 8,507 22.1% White alone 4,278 11.1% Asian alone 4,151 10.8% Black alone 1,807 4.7% Two or more races 314 0.8% Native Hawaiian and Other 42 0.1% Other race alone 52 0.1% American Indian alone
2000 2022
15,816,790 46.7% White alone 10,966,556 32.4% Hispanic 3,648,860 10.8% Asian alone 2,181,926 6.4% Black alone 903,115 2.7% Two or more races 178,984 0.5% American Indian alone 103,736 0.3% Native Hawaiian and Other 71,681 0.2% Other race alone
15,732,184 40.3% Hispanic 13,160,426 33.7% White alone 5,957,867 15.3% Asian alone 2,025,218 5.2% Black alone 1,663,222 4.3% Two or more races 251,618 0.6% Other race alone 135,777 0.3% Native Hawaiian and Other 103,030 0.3% American Indian alone
Income and house value in La Presa Median household income in 2022 $84,917 White non-Hispanic householders$84,199 Black householders$155,217 American Indian and Alaska Native householders$118,019 Asian householders$124,164 Native Hawaiian and other Pacific Islander householders$73,502 Some other race householders$72,409 Two or more races householders$84,565 Hispanic or Latino race householdersMedian 2022 house value $552,851 White Non-Hispanic householders$602,162 Black or African American householders$438,754 American Indian or Alaska Native householders $572,288 Asian householders$526,936 Native Hawaiian and other Pacific Islander householders$552,491 Some other race householders$562,929 Two or more races householders$540,974 Hispanic or Latino householders
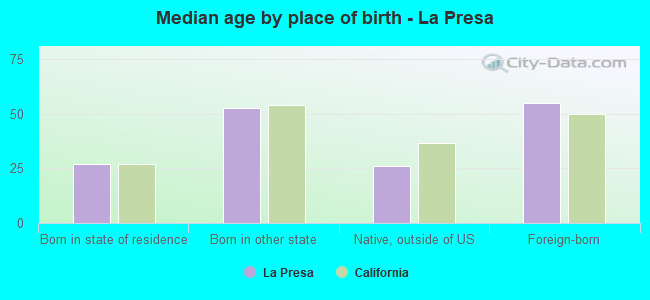
Median age by race in La Presa
36.2 Median age for White residents34.4 38.7 38.5 Median age for Black or African American residents39.0 37.0 40.1 Median age for American Indian / Alaska Native residents44.4 35.8 42.0 Median age for Asian residents36.1 50.2 15.4 Median age for Native Hawaiian / Pacific Islander residents12.8 18.2 36.8 Median age for Other race residents33.1 38.4 27.7 Median age for Two or more races residents25.6 28.8 50.1 Median age for White alone residents49.4 50.5 30.8 Median age for Hispanic or Latino residents29.2 32.2
Owner/renter occupied households by race in La Presa
House owners and renters - White residents 3,998 68.1% Owner occupied1,873 31.9% Renter occupiedHouse owners and renters - Black or African American residents 730 48.7% Owner occupied768 51.3% Renter occupiedHouse owners and renters - American Indian / Alaska Native residents 81 86.7% Owner occupied12 13.3% Renter occupiedHouse owners and renters - Asian residents 762 68.4% Owner occupied352 31.6% Renter occupiedHouse owners and renters - Native Hawaiian / Pacific Islander residents 58 58.2% Owner occupied42 41.8% Renter occupiedHouse owners and renters - Other race residents 586 50.4% Owner occupied577 49.6% Renter occupiedHouse owners and renters - Two or more races residents 780 62.0% Owner occupied478 38.0% Renter occupiedHouse owners and renters - White alone residents 2,517 75.0% Owner occupied839 25.0% Renter occupiedHouse owners and renters - Hispanic or Latino residents 2,845 57.3% Owner occupied2,121 42.7% Renter occupied
Language usage in La Presa
English speakers - Total 54.7% of residents of La Presa speak English at home.
34.8% of residents speak Spanish at home 8,973 72.0% Speak English very well3,486 28.0% Speak English less than very well10.5% of residents speak other language at home 2,675 70.9% Speak English very well1,099 29.1% Speak English less than very well
English speakers - Born in the United States 90.9% of residents of La Presa speak English at home.
7.1% of residents speak Spanish at home 438 95.8% Speak English very well19 4.2% Speak English less than very well1.8% of residents speak other language at home 108 92.3% Speak English very well9 7.7% Speak English less than very well
English speakers - Native, born elsewhere 50.6% of residents of La Presa speak English at home.
32.0% of residents speak Spanish at home 254 81.7% Speak English very well57 18.3% Speak English less than very well17.4% of residents speak other language at home 169 100.0% Speak English very well
English speakers - Foreign-born 8.2% of residents of La Presa speak English at home.
56.5% of residents speak Spanish at home 2,248 45.6% Speak English very well2,680 54.4% Speak English less than very well35.0% of residents speak other language at home 1,996 65.5% Speak English very well1,053 34.5% Speak English less than very well
White (Caucasian) - Speak only English Native:
70.9% (10,251)Foreign-born:
9.7% (277)
White (Caucasian) - Speak another language Native:
25.2% (3,642)Foreign-born:
87.0% (2,488)
Black or African American - Speak only English Native:
93.2% (3,375)Foreign-born:
32.2% (62)
Black or African American - Speak another language Native:
6.9% (248)Foreign-born:
63.9% (123)
Asian - Speak only English Native:
80.0% (1,351)Foreign-born:
6.8% (175)
Asian - Speak another language Native:
22.7% (384)Foreign-born:
92.1% (2,381)
Other race - Speak only English Native:
46.6% (1,280)Foreign-born:
11.4% (164)
Other race - Speak another language Native:
55.9% (1,534)Foreign-born:
90.1% (1,299)
Two or more races - Speak only English Native:
61.9% (3,121)Foreign-born:
21.6% (191)
Two or more races - Speak another language Native:
42.0% (2,118)Foreign-born:
69.7% (615)
White alone - Speak only English Native:
93.5% (7,146)Foreign-born:
25.7% (166)
White alone - Speak another language Native:
6.6% (508)Foreign-born:
74.3% (481)
Hispanic or Latino - Speak only English Native:
48.0% (6,529)Foreign-born:
7.7% (377)
Hispanic or Latino - Speak another language Native:
52.7% (7,165)Foreign-born:
92.5% (4,552)
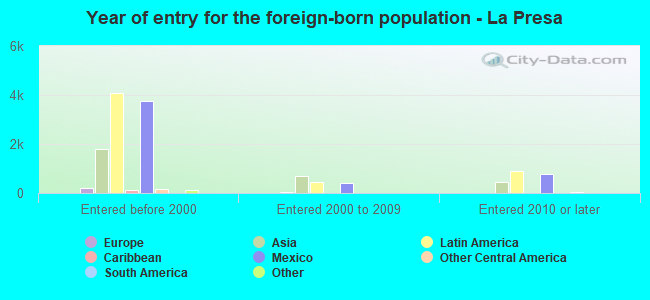
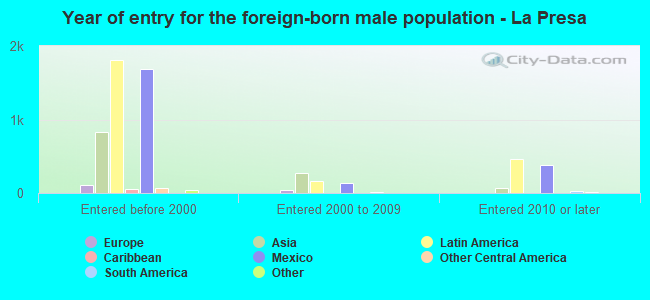
Foreign-born residents in La Presa 9,096 residents are foreign born (14.6% Latin America , 7.8% Asia ).
This city:
23.6%California:
100.0%
Marital status for residents in La Presa Marital status - White (Caucasian) population 15 years and over
Males 41.5% Never married46.3% Now married1.2% Separated3.4% Widowed7.6% DivorcedFemales 31.9% Never married43.0% Now married2.8% Separated9.5% Widowed12.7% DivorcedWomen who gave birth in the past 12 months Now married:
61.7% (95)Unmarried:
38.3% (59)
Women who did not give birth in the past 12 months Now married:
41.9% (1,719)Unmarried:
58.1% (2,380)
Marital status - Black or African American population 15 years and over
Males 32.7% Never married44.3% Now married3.0% Separated1.4% Widowed18.6% DivorcedFemales 49.0% Never married29.2% Now married3.9% Separated6.0% Widowed11.9% DivorcedWomen who gave birth in the past 12 months Now married:
0.0% (0)Unmarried:
100.0% (54)
Women who did not give birth in the past 12 months Now married:
30.5% (346)Unmarried:
69.5% (790)
Marital status - American Indian / Alaska Native population 15 years and over
Males 36.5% Never married21.2% Now married9.4% Separated0.0% Widowed32.9% DivorcedFemales 24.5% Never married43.9% Now married0.0% Separated26.5% Widowed5.1% DivorcedWomen who did not give birth in the past 12 months Now married:
64.2% (63)Unmarried:
35.8% (35)
Marital status - Asian population 15 years and over
Males 42.6% Never married47.7% Now married0.8% Separated3.3% Widowed5.7% DivorcedFemales 20.7% Never married52.0% Now married2.5% Separated12.5% Widowed12.2% DivorcedWomen who gave birth in the past 12 months Now married:
81.3% (40)Unmarried:
18.8% (9)
Women who did not give birth in the past 12 months Now married:
45.1% (394)Unmarried:
54.9% (481)
Marital status - Native Hawaiian / Pacific Islander population 15 years and over
Males 0.0% Never married58.5% Now married0.0% Separated0.0% Widowed41.5% DivorcedFemales 40.0% Never married20.8% Now married0.0% Separated0.0% Widowed39.2% DivorcedWomen who did not give birth in the past 12 months Now married:
12.3% (10)Unmarried:
87.7% (72)
Marital status - Other race population 15 years and over
Males 44.8% Never married47.2% Now married4.0% Separated2.2% Widowed1.8% DivorcedFemales 35.1% Never married43.7% Now married4.5% Separated3.9% Widowed12.9% DivorcedWomen who gave birth in the past 12 months Now married:
100.0% (42)Unmarried:
0.0% (0)
Women who did not give birth in the past 12 months Now married:
44.5% (484)Unmarried:
55.5% (603)
Marital status - Two or more races population 15 years and over
Males 45.0% Never married42.5% Now married3.1% Separated0.0% Widowed9.4% DivorcedFemales 46.8% Never married32.5% Now married1.9% Separated2.7% Widowed16.0% DivorcedWomen who gave birth in the past 12 months Now married:
68.1% (96)Unmarried:
31.9% (45)
Women who did not give birth in the past 12 months Now married:
23.4% (376)Unmarried:
76.6% (1,233)
Marital status - White alone, not Hispanic / Latino population 15 years and over
Males 34.4% Never married48.3% Now married1.2% Separated4.9% Widowed11.1% DivorcedFemales 27.7% Never married37.9% Now married2.1% Separated14.0% Widowed18.4% DivorcedWomen who gave birth in the past 12 months Now married:
70.9% (36)Unmarried:
29.1% (15)
Women who did not give birth in the past 12 months Now married:
33.8% (560)Unmarried:
66.2% (1,100)
Marital status - Hispanic or Latino population 15 years and over
Males 46.1% Never married45.2% Now married2.1% Separated2.2% Widowed4.4% DivorcedFemales 35.5% Never married45.2% Now married3.4% Separated5.6% Widowed10.3% DivorcedWomen who gave birth in the past 12 months Now married:
67.8% (127)Unmarried:
32.2% (60)
Women who did not give birth in the past 12 months Now married:
44.3% (2,181)Unmarried:
55.7% (2,738)
Ancestries in La Presa
745 3.4% American403 1.8% English336 1.5% European335 1.5% German219 1.0% Italian193 0.9% Irish134 0.6% Somali98 0.4% Iranian88 0.4% African82 0.4% Iraqi82 0.4% French76 0.3% Assyrian62 0.3% Hungarian62 0.3% Norwegian60 0.3% Polish52 0.2% British46 0.2% Scottish45 0.2% Scandinavian43 0.2% Swedish42 0.2% Canadian39 0.2% Scotch-Irish33 0.1% Dutch32 0.1% Danish29 0.1% Portuguese28 0.1% Croatian27 0.1% Welsh18 0.08% Ukrainian16 0.07% Barbadian15 0.07% Celtic13 0.06% Greek9 0.04% Jamaican9 0.04% West Indian8 0.04% Ethiopian7 0.03% Russian7 0.03% French Canadian6 0.03% Egyptian6 0.03% Arab5 0.02% Basque4 0.02% Swiss
Geographical mobility in La Presa Same house 1 year ago 17,001 92.2% White (Caucasian)3,575 88.4% Black or African American264 89.5% American Indian / Alaska Native4,174 93.5% Asian110 31.6% Native Hawaiian / Pacific Islander3,776 88.0% Other race5,753 93.0% Two or more races7,784 90.9% White alone, not Hispanic / Latino17,361 90.0% Hispanic or LatinoMoved within same county 1,020 5.5% White / Caucasian149 3.7% Black or African American4 1.5% American Indian / Alaska Native267 6.0% Asian217 62.5% Native Hawaiian / Pacific Islander250 5.8% Other race296 4.8% Two or more races437 5.1% White alone, not Hispanic / Latino1,366 7.1% Hispanic or LatinoMoved within same state 385 2.1% White / Caucasian284 7.0% Black or African American29 0.6% Asian199 4.6% Other race111 1.8% Two or more races130 1.5% White alone, not Hispanic / Latino405 2.1% Hispanic or LatinoMoved from different state 137 0.7% White / Caucasian147 3.6% Black or African American14 4.6% American Indian / Alaska Native61 1.4% Asian47 1.1% Other race95 1.5% Two or more races140 1.6% White alone, not Hispanic / Latino84 0.4% Hispanic or LatinoMoved from abroad 78 0.4% White6 0.1% Asian32 0.8% Other race12 0.2% Two or more races88 1.0% White alone, not Hispanic / Latino59 0.3% Hispanic or Latino
Children Nativity (place of birth) in La Presa
Children under 6 years - Living with two parents Both parents native 834 100.0% NativeBoth parents foreign-born 279 80.3% Native68 19.7% Foreign-bornOne native, one foreign-born parent 454 91.7% Native41 8.3% Foreign-bornChildren under 6 years - Living with one parent Native parent 675 100.0% NativeForeign-born parent 108 74.5% Native37 25.5% Foreign-bornChildren 6 to 17 years - Living with two parents Both parents native 1,641 99.9% Native1 0.1% Foreign-bornBoth parents foreign-born 644 92.3% Native54 7.7% Foreign-bornOne native, one foreign-born parent 802 96.9% Native26 3.1% Foreign-bornChildren 6 to 17 years - Living with one parent Native parent 1,889 100.0% NativeForeign-born parent 808 51.3% Native766 48.7% Foreign-born
Grandparents responsible for own grandchildren in La Presa
Grandparents (30 to 59 years) White / Caucasian 26 19.7% Responsible for grandchildren107 80.3% Not responsible for grandchildrenBlack or African American 36 62.5% Responsible for grandchildren22 37.5% Not responsible for grandchildrenAmerican Indian / Alaska Native 3 100.0% Responsible for grandchildrenAsian 20 15.9% Responsible for grandchildren106 84.1% Not responsible for grandchildrenOther race 72 24.3% Responsible for grandchildren225 75.7% Not responsible for grandchildrenTwo or more races 13 100.0% Responsible for grandchildrenWhite alone, not Hispanic / Latino 63 100.0% Not responsible for grandchildrenHispanic or Latino 118 29.0% Responsible for grandchildren288 71.0% Not responsible for grandchildrenGrandparents (60 years and over) White / Caucasian 125 30.4% Responsible for grandchildren287 69.6% Not responsible for grandchildrenBlack or African American 52 100.0% Not responsible for grandchildrenAsian 10 7.8% Responsible for grandchildren121 92.2% Not responsible for grandchildrenOther race 7 6.4% Responsible for grandchildren96 93.6% Not responsible for grandchildrenTwo or more races 66 100.0% Not responsible for grandchildrenWhite alone, not Hispanic / Latino 76 44.6% Responsible for grandchildren94 55.4% Not responsible for grandchildrenHispanic or Latino 86 17.6% Responsible for grandchildren401 82.4% Not responsible for grandchildren