Races in Laconia, New Hampshire (NH) Detailed Stats
Data:
Races - White alone (%)
Races - White alone (% change since 2000)
Races - Black alone (%)
Races - Black alone (% change since 2000)
Races - American Indian alone (%)
Races - American Indian alone (% change since 2000)
Races - Asian alone (%)
Races - Asian alone (% change since 2000)
Races - Hispanic (%)
Races - Hispanic (% change since 2000)
Races - Native Hawaiian and Other Pacific Islander alone (%)
Races - Native Hawaiian and Other Pacific Islander alone (% change since 2000)
Races - Two or more races(%)
Races - Two or more races(% change since 2000)
Races - Other race alone (%)
Races - Other race alone (% change since 2000)
Racial diversity
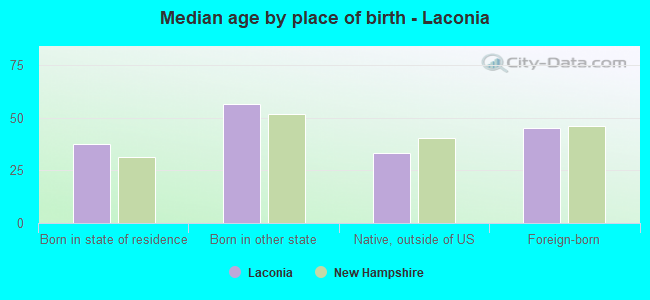
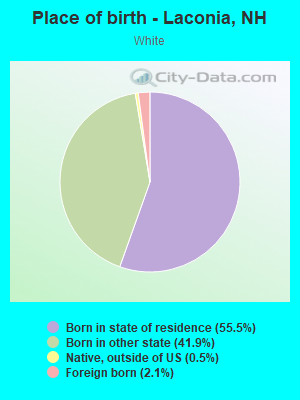
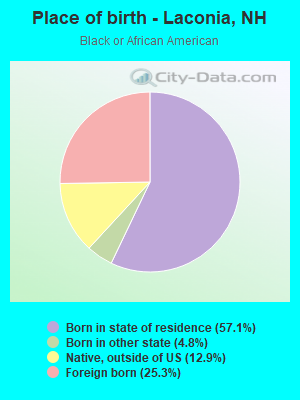
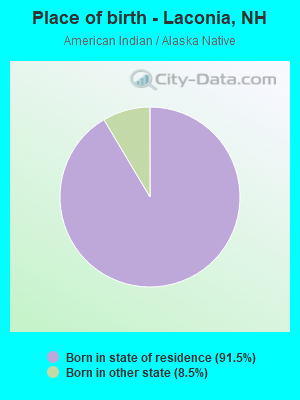
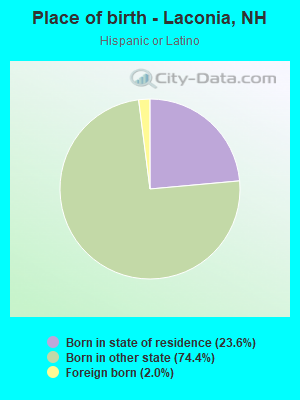
Place of birth - Born in state of residence (%)
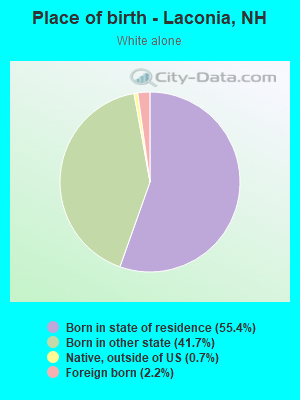
Place of birth - Born in state of residence (%) - White
Place of birth - Born in state of residence (%) - Black or African American
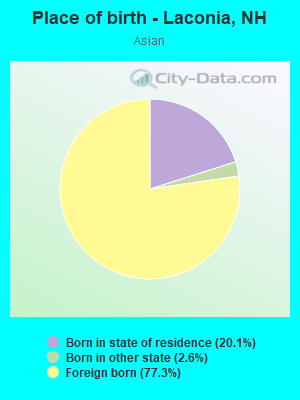
Place of birth - Born in state of residence (%) - Asian
Place of birth - Born in state of residence (%) - Hispanic or Latino
Place of birth - Born in state of residence (%) - American Indian and Alaska Native
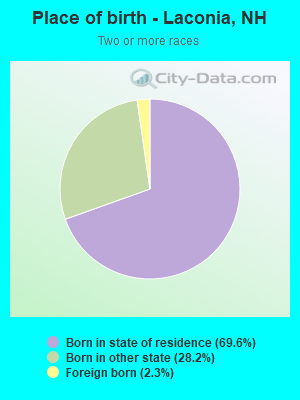
Place of birth - Born in state of residence (%) - Multirace
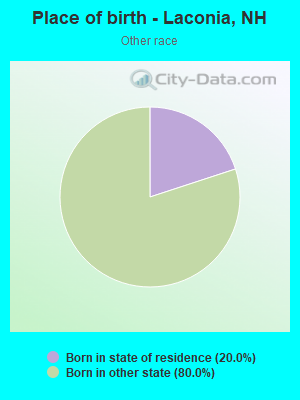
Place of birth - Born in state of residence (%) - Other Race
Place of birth - Born in other state (%)
Place of birth - Born in other state (%) - White
Place of birth - Born in other state (%) - Black or African American
Place of birth - Born in other state (%) - Asian
Place of birth - Born in other state (%) - Hispanic or Latino
Place of birth - Born in other state (%) - American Indian and Alaska Native
Place of birth - Born in other state (%) - Multirace
Place of birth - Born in other state (%) - Other Race
Place of birth - Native, outside of US (%)
Place of birth - Native, outside of US (%) - White
Place of birth - Native, outside of US (%) - Black or African American
Place of birth - Native, outside of US (%) - Asian
Place of birth - Native, outside of US (%) - Hispanic or Latino
Place of birth - Native, outside of US (%) - American Indian and Alaska Native
Place of birth - Native, outside of US (%) - Multirace
Place of birth - Native, outside of US (%) - Other Race
Place of birth - Foreign born (%)
Place of birth - Foreign born (%) - White
Place of birth - Foreign born (%) - Black or African American
Place of birth - Foreign born (%) - Asian
Place of birth - Foreign born (%) - Hispanic or Latino
Place of birth - Foreign born (%) - American Indian and Alaska Native
Place of birth - Foreign born (%) - Multirace
Place of birth - Foreign born (%) - Other Race
Residents speaking English at home (%)
Residents speaking English at home - Born in the United States (%)
Residents speaking English at home - Native, born elsewhere (%)
Residents speaking English at home - Foreign born (%)
Residents speaking Spanish at home (%)
Residents speaking Spanish at home - Born in the United States (%)
Residents speaking Spanish at home - Native, born elsewhere (%)
Residents speaking Spanish at home - Foreign born (%)
Residents speaking other language at home (%)
Residents speaking other language at home - Born in the United States (%)
Residents speaking other language at home - Native, born elsewhere (%)
Residents speaking other language at home - Foreign born (%)
Marital status - Never married (%)
Marital status - Now married (%)
Marital status - Separated (%)
Marital status - Widowed (%)
Marital status - Divorced (%)
Ancestries Reported - Arab (%)
Ancestries Reported - Czech (%)
Ancestries Reported - Danish (%)
Ancestries Reported - Dutch (%)
Ancestries Reported - English (%)
Ancestries Reported - French (%)
Ancestries Reported - French Canadian (%)
Ancestries Reported - German (%)
Ancestries Reported - Greek (%)
Ancestries Reported - Hungarian (%)
Ancestries Reported - Irish (%)
Ancestries Reported - Italian (%)
Ancestries Reported - Lithuanian (%)
Ancestries Reported - Norwegian (%)
Ancestries Reported - Polish (%)
Ancestries Reported - Portuguese (%)
Ancestries Reported - Russian (%)
Ancestries Reported - Scotch-Irish (%)
Ancestries Reported - Scottish (%)
Ancestries Reported - Slovak (%)
Ancestries Reported - Subsaharan African (%)
Ancestries Reported - Swedish (%)
Ancestries Reported - Swiss (%)
Ancestries Reported - Ukrainian (%)
Ancestries Reported - United States (%)
Ancestries Reported - Welsh (%)
Ancestries Reported - West Indian (%)
Ancestries Reported - Other (%)
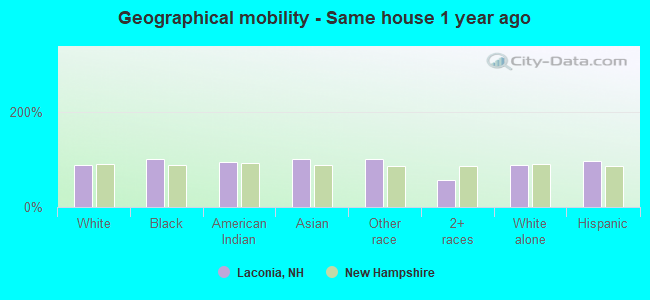
Geographical mobility - Same house 1 year ago (%)
Geographical mobility - Same house 1 year ago (%) - White
Geographical mobility - Same house 1 year ago (%) - Black or African American
Geographical mobility - Same house 1 year ago (%) - Asian
Geographical mobility - Same house 1 year ago (%) - Hispanic or Latino
Geographical mobility - Same house 1 year ago (%) - American Indian and Alaska Native
Geographical mobility - Same house 1 year ago (%) - Multirace
Geographical mobility - Same house 1 year ago (%) - Other Race
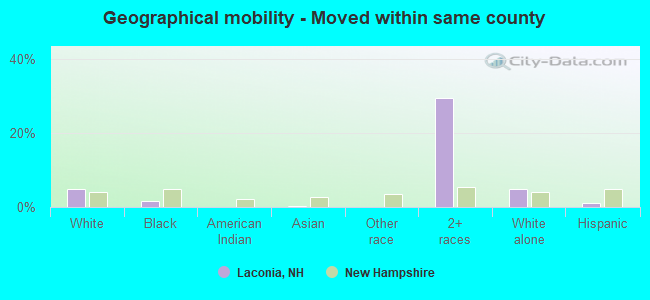
Geographical mobility - Moved within same county (%)
Geographical mobility - Moved within same county (%) - White
Geographical mobility - Moved within same county (%) - Black or African American
Geographical mobility - Moved within same county (%) - Asian
Geographical mobility - Moved within same county (%) - Hispanic or Latino
Geographical mobility - Moved within same county (%) - American Indian and Alaska Native
Geographical mobility - Moved within same county (%) - Multirace
Geographical mobility - Moved within same county (%) - Other Race
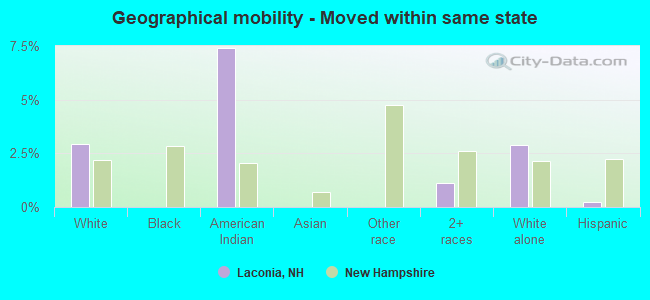
Geographical mobility - Moved from different county within same state (%)
Geographical mobility - Moved from different county within same state (%) - White
Geographical mobility - Moved from different county within same state (%) - Black or African American
Geographical mobility - Moved from different county within same state (%) - Asian
Geographical mobility - Moved from different county within same state (%) - Hispanic or Latino
Geographical mobility - Moved from different county within same state (%) - American Indian and Alaska Native
Geographical mobility - Moved from different county within same state (%) - Multirace
Geographical mobility - Moved from different county within same state (%) - Other Race
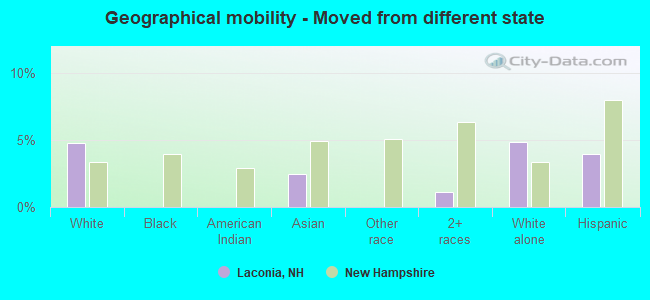
Geographical mobility - Moved from different state (%)
Geographical mobility - Moved from different state (%) - White
Geographical mobility - Moved from different state (%) - Black or African American
Geographical mobility - Moved from different state (%) - Asian
Geographical mobility - Moved from different state (%) - Hispanic or Latino
Geographical mobility - Moved from different state (%) - American Indian and Alaska Native
Geographical mobility - Moved from different state (%) - Multirace
Geographical mobility - Moved from different state (%) - Other Race
Geographical mobility - Moved from abroad (%)
Geographical mobility - Moved from abroad (%) - White
Geographical mobility - Moved from abroad (%) - Black or African American
Geographical mobility - Moved from abroad (%) - Asian
Geographical mobility - Moved from abroad (%) - Hispanic or Latino
Geographical mobility - Moved from abroad (%) - American Indian and Alaska Native
Geographical mobility - Moved from abroad (%) - Multirace
Geographical mobility - Moved from abroad (%) - Other Race
Place of birth for the foreign-born population - Ireland (%)
Place of birth for the foreign-born population - Denmark (%)
Place of birth for the foreign-born population - Norway (%)
Place of birth for the foreign-born population - Sweden (%)
Place of birth for the foreign-born population - United Kingdom (%)
Place of birth for the foreign-born population - England (%)
Place of birth for the foreign-born population - Scotland (%)
Place of birth for the foreign-born population - Other Northern Europe (%)
Place of birth for the foreign-born population - Austria (%)
Place of birth for the foreign-born population - Belgium (%)
Place of birth for the foreign-born population - France (%)
Place of birth for the foreign-born population - Germany (%)
Place of birth for the foreign-born population - Netherlands (%)
Place of birth for the foreign-born population - Switzerland (%)
Place of birth for the foreign-born population - Other Western Europe (%)
Place of birth for the foreign-born population - Greece (%)
Place of birth for the foreign-born population - Italy (%)
Place of birth for the foreign-born population - Portugal (%)
Place of birth for the foreign-born population - Spain (%)
Place of birth for the foreign-born population - Other Southern Europe (%)
Place of birth for the foreign-born population - Albania (%)
Place of birth for the foreign-born population - Belarus (%)
Place of birth for the foreign-born population - Bosnia and Herzegovina (%)
Place of birth for the foreign-born population - Bulgaria (%)
Place of birth for the foreign-born population - Croatia (%)
Place of birth for the foreign-born population - Czechoslovakia (%)
Place of birth for the foreign-born population - Hungary (%)
Place of birth for the foreign-born population - Latvia (%)
Place of birth for the foreign-born population - Lithuania (%)
Place of birth for the foreign-born population - North Macedonia (Macedonia) (%)
Place of birth for the foreign-born population - Moldova (%)
Place of birth for the foreign-born population - Poland (%)
Place of birth for the foreign-born population - Romania (%)
Place of birth for the foreign-born population - Russia (%)
Place of birth for the foreign-born population - Serbia (%)
Place of birth for the foreign-born population - Ukraine (%)
Place of birth for the foreign-born population - Other Eastern Europe (%)
Place of birth for the foreign-born population - China (%)
Place of birth for the foreign-born population - Hong Kong (%)
Place of birth for the foreign-born population - Taiwan (%)
Place of birth for the foreign-born population - Japan (%)
Place of birth for the foreign-born population - Korea (%)
Place of birth for the foreign-born population - Other Eastern Asia (%)
Place of birth for the foreign-born population - Afghanistan (%)
Place of birth for the foreign-born population - Bangladesh (%)
Place of birth for the foreign-born population - India (%)
Place of birth for the foreign-born population - Iran (%)
Place of birth for the foreign-born population - Kazakhstan (%)
Place of birth for the foreign-born population - Nepal (%)
Place of birth for the foreign-born population - Pakistan (%)
Place of birth for the foreign-born population - Sri Lanka (%)
Place of birth for the foreign-born population - Uzbekistan (%)
Place of birth for the foreign-born population - Other South Central Asia (%)
Place of birth for the foreign-born population - Burma (%)
Place of birth for the foreign-born population - Cambodia (%)
Place of birth for the foreign-born population - Indonesia (%)
Place of birth for the foreign-born population - Laos (%)
Place of birth for the foreign-born population - Malaysia (%)
Place of birth for the foreign-born population - Philippines (%)
Place of birth for the foreign-born population - Singapore (%)
Place of birth for the foreign-born population - Thailand (%)
Place of birth for the foreign-born population - Vietnam (%)
Place of birth for the foreign-born population - Other South Eastern Asia (%)
Place of birth for the foreign-born population - Armenia (%)
Place of birth for the foreign-born population - Iraq (%)
Place of birth for the foreign-born population - Israel (%)
Place of birth for the foreign-born population - Jordan (%)
Place of birth for the foreign-born population - Kuwait (%)
Place of birth for the foreign-born population - Lebanon (%)
Place of birth for the foreign-born population - Saudi Arabia (%)
Place of birth for the foreign-born population - Syria (%)
Place of birth for the foreign-born population - Turkey (%)
Place of birth for the foreign-born population - Yemen (%)
Place of birth for the foreign-born population - Other Western Asia (%)
Place of birth for the foreign-born population - Eritrea (%)
Place of birth for the foreign-born population - Ethiopia (%)
Place of birth for the foreign-born population - Kenya (%)
Place of birth for the foreign-born population - Somalia (%)
Place of birth for the foreign-born population - Uganda (%)
Place of birth for the foreign-born population - Zimbabwe (%)
Place of birth for the foreign-born population - Other Eastern Africa (%)
Place of birth for the foreign-born population - Cameroon (%)
Place of birth for the foreign-born population - Congo (%)
Place of birth for the foreign-born population - Democratic Republic of Congo (Zaire) (%)
Place of birth for the foreign-born population - Other Middle Africa (%)
Place of birth for the foreign-born population - Egypt (%)
Place of birth for the foreign-born population - Morocco (%)
Place of birth for the foreign-born population - Sudan (%)
Place of birth for the foreign-born population - Other Northern Africa (%)
Place of birth for the foreign-born population - South Africa (%)
Place of birth for the foreign-born population - Other Southern Africa (%)
Place of birth for the foreign-born population - Cabo Verde (%)
Place of birth for the foreign-born population - Ghana (%)
Place of birth for the foreign-born population - Liberia (%)
Place of birth for the foreign-born population - Nigeria (%)
Place of birth for the foreign-born population - Senegal (%)
Place of birth for the foreign-born population - Sierra Leone (%)
Place of birth for the foreign-born population - Other Western Africa (%)
Place of birth for the foreign-born population - Australia (%)
Place of birth for the foreign-born population - New Zealand (%)
Place of birth for the foreign-born population - Fiji (%)
Place of birth for the foreign-born population - Micronesia (%)
Place of birth for the foreign-born population - Bahamas (%)
Place of birth for the foreign-born population - Barbados (%)
Place of birth for the foreign-born population - Cuba (%)
Place of birth for the foreign-born population - Dominica (%)
Place of birth for the foreign-born population - Dominican Republic (%)
Place of birth for the foreign-born population - Grenada (%)
Place of birth for the foreign-born population - Haiti (%)
Place of birth for the foreign-born population - Jamaica (%)
Place of birth for the foreign-born population - St. Vincent and the Grenadines (%)
Place of birth for the foreign-born population - Trinidad and Tobago (%)
Place of birth for the foreign-born population - West Indies (%)
Place of birth for the foreign-born population - Other Caribbean (%)
Place of birth for the foreign-born population - Belize (%)
Place of birth for the foreign-born population - Costa Rica (%)
Place of birth for the foreign-born population - El Salvador (%)
Place of birth for the foreign-born population - Guatemala (%)
Place of birth for the foreign-born population - Honduras (%)
Place of birth for the foreign-born population - Mexico (%)
Place of birth for the foreign-born population - Nicaragua (%)
Place of birth for the foreign-born population - Panama (%)
Place of birth for the foreign-born population - Other Central America (%)
Place of birth for the foreign-born population - Argentina (%)
Place of birth for the foreign-born population - Bolivia (%)
Place of birth for the foreign-born population - Brazil (%)
Place of birth for the foreign-born population - Chile (%)
Place of birth for the foreign-born population - Colombia (%)
Place of birth for the foreign-born population - Ecuador (%)
Place of birth for the foreign-born population - Guyana (%)
Place of birth for the foreign-born population - Peru (%)
Place of birth for the foreign-born population - Uruguay (%)
Place of birth for the foreign-born population - Venezuela (%)
Place of birth for the foreign-born population - Other South America (%)
Place of birth for the foreign-born population - Canada (%)
Place of birth for the foreign-born population - Other Northern America (%)
Place of birth for the foreign-born population - Other (%)
Latest news about races in Laconia, NH collected exclusively by city-data.com from local newspapers, TV, and radio stations
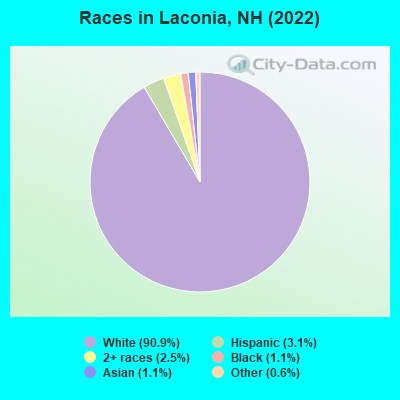
According to 2022 data, the most numerous races in Laconia, NH are White alone (15,528 residents), Hispanic (522 residents), and Two or more races (424 residents). 95.7% of Laconia residents speak English at home. 3.5% of Laconia, NH residents are foreign-born (1.6% born in Europe, 1.0% born in Asia, 0.5% born in North America, 0.4% born in Latin America), which is 43.6% less than the foreign-born rate of 5.0% across the entire state of New Hampshire.
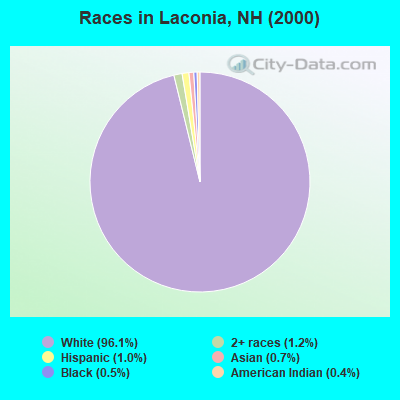
Race distribution in Laconia
2000 2022
1,175,252 95.1% White alone 20,489 1.7% Hispanic 15,803 1.3% Asian alone 11,606 0.9% Two or more races 8,354 0.7% Black alone 2,698 0.2% American Indian alone 1,254 0.1% Other race alone 330 0.03% Native Hawaiian and Other
1,208,101 86.6% White alone 63,479 4.5% Hispanic 60,724 4.4% Two or more races 36,519 2.6% Asian alone 17,931 1.3% Black alone 6,615 0.5% Other race alone 1,014 0.07% American Indian alone 848 0.06% Native Hawaiian and Other
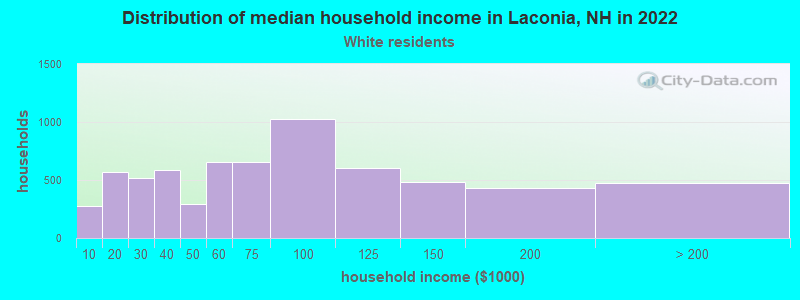
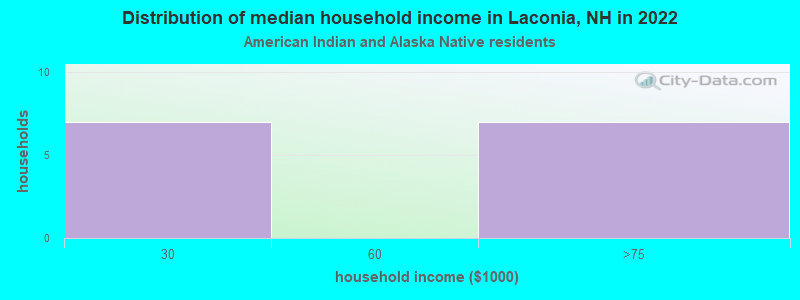
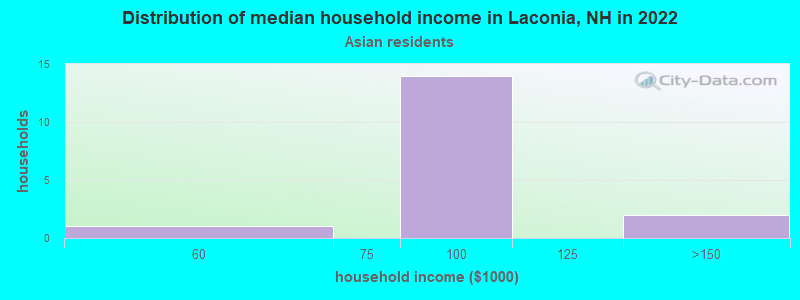
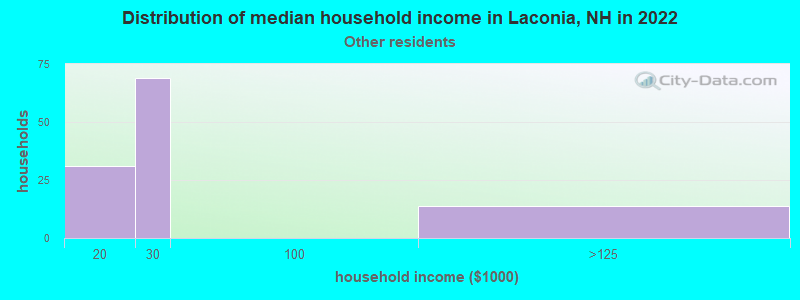
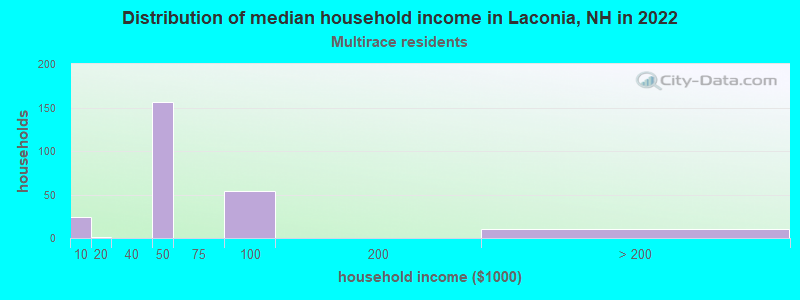
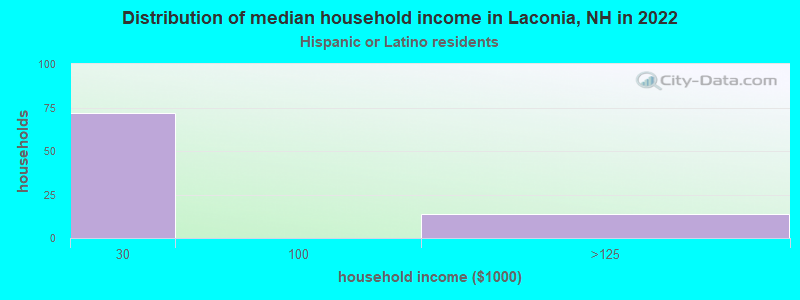
Income and house value in Laconia Median household income in 2022 $68,898 White non-Hispanic householders$98,874 Asian householders$27,035 Some other race householders$44,288 Two or more races householdersMedian 2022 house value $292,392 White Non-Hispanic householders$359,960 American Indian or Alaska Native householders $340,871 Asian householders$259,062 Two or more races householders$287,847 Hispanic or Latino householders
Median age by race in Laconia
45.5 Median age for White residents44.0 48.2 11.8 Median age for Black or African American residents44.4 12.9 72.4 Median age for American Indian / Alaska Native residents-772,357,722.8 82.3 50.4 Median age for Asian residents62.1 36.8 -633,846,153.2 Median age for Native Hawaiian / Pacific Islander residents-594,900,849.3 -621,399,176.3 19.1 Median age for Other race residents19.7 17.7 63.1 Median age for Two or more races residents38.0 63.0 45.7 Median age for White alone residents44.0 48.1 20.1 Median age for Hispanic or Latino residents21.5 18.6
Owner/renter occupied households by race in Laconia
House owners and renters - White residents 4,056 61.7% Owner occupied2,521 38.3% Renter occupiedHouse owners and renters - Black or African American residents 59 100.0% Renter occupiedHouse owners and renters - American Indian / Alaska Native residents 6 86.7% Owner occupied1 13.3% Renter occupiedHouse owners and renters - Asian residents 21 100.0% Owner occupiedHouse owners and renters - Other race residents 211 100.0% Renter occupiedHouse owners and renters - Two or more races residents 37 14.8% Owner occupied213 85.2% Renter occupiedHouse owners and renters - White alone residents 4,064 61.3% Owner occupied2,569 38.7% Renter occupiedHouse owners and renters - Hispanic or Latino residents 98 100.0% Renter occupied
Language usage in Laconia
English speakers - Total 95.7% of residents of Laconia speak English at home.
0.8% of residents speak Spanish at home 119 86.2% Speak English very well19 13.8% Speak English less than very well3.4% of residents speak other language at home 404 73.2% Speak English very well148 26.8% Speak English less than very well
English speakers - Born in the United States 98.6% of residents of Laconia speak English at home.
1.4% of residents speak Spanish at home 74 78.7% Speak English very well20 21.3% Speak English less than very well0.3% of residents speak other language at home 19 90.5% Speak English very well2 9.5% Speak English less than very well
All residents speak only English at home
English speakers - Foreign-born 51.7% of residents of Laconia speak English at home.
1.3% of residents speak Spanish at home 7 87.5% Speak English very well1 12.5% Speak English less than very well42.0% of residents speak other language at home 131 51.6% Speak English very well123 48.4% Speak English less than very well
White (Caucasian) - Speak only English Native:
98.0% (14,324)Foreign-born:
57.8% (187)
White (Caucasian) - Speak another language Native:
2.0% (294)Foreign-born:
43.2% (140)
Black or African American - Speak only English Native:
100.0% (91)Foreign-born:
100.0% (46)
Asian - Speak only English Native:
60.3% (24)Foreign-born:
31.7% (47)
Asian - Speak another language Native:
39.3% (16)Foreign-born:
69.6% (104)
White alone - Speak only English Native:
98.1% (14,346)Foreign-born:
56.6% (191)
White alone - Speak another language Native:
1.9% (275)Foreign-born:
43.7% (147)
Hispanic or Latino - Speak another language Native:
23.8% (92)Foreign-born:
100.0% (10)
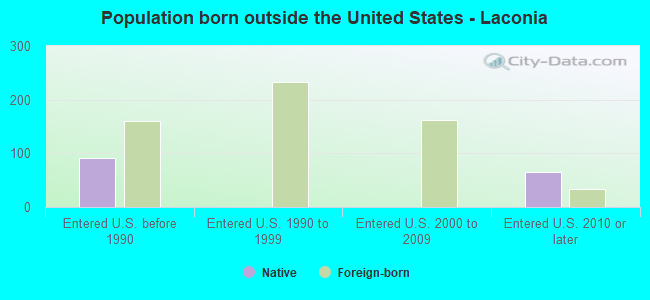
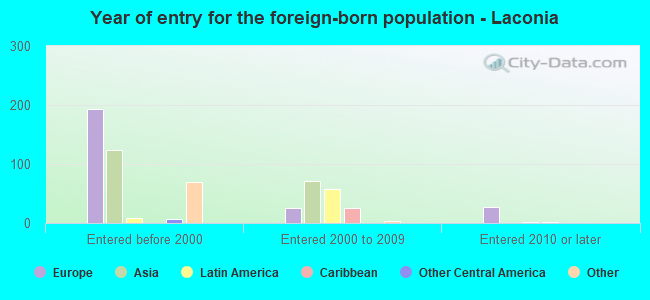
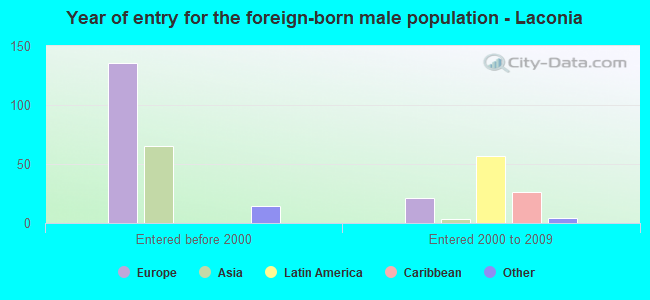
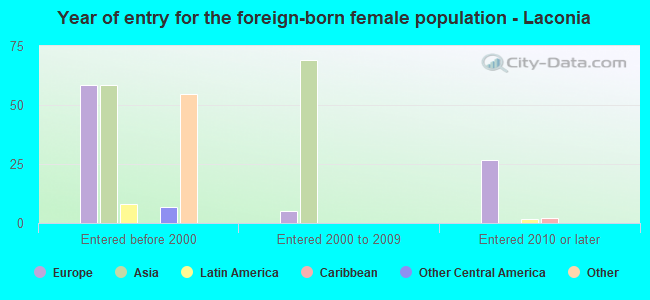
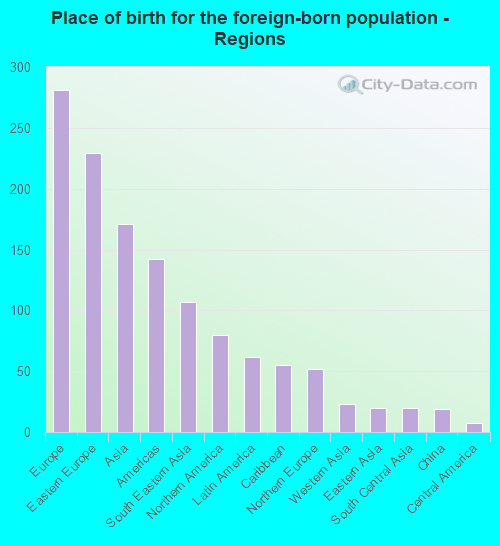
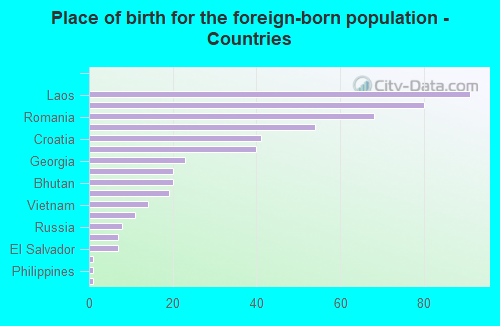
Foreign-born residents in Laconia 595 residents are foreign born (1.6% Europe , 1.0% Asia , 0.5% North America , 0.4% Latin America ).
This city:
3.5%New Hampshire:
6.0%
Marital status for residents in Laconia Marital status - White (Caucasian) population 15 years and over
Males 34.2% Never married45.3% Now married4.3% Separated4.4% Widowed11.8% DivorcedFemales 27.0% Never married43.7% Now married1.1% Separated12.1% Widowed16.1% DivorcedWomen who gave birth in the past 12 months Now married:
80.0% (212)Unmarried:
20.0% (53)
Women who did not give birth in the past 12 months Now married:
31.3% (899)Unmarried:
68.7% (1,973)
Marital status - Black or African American population 15 years and over
Males 1.9% Never married98.1% Now married0.0% Separated0.0% Widowed0.0% DivorcedFemales 100.0% Never married0.0% Now married0.0% Separated0.0% Widowed0.0% DivorcedWomen who did not give birth in the past 12 months Now married:
0.0% (0)Unmarried:
100.0% (5)
Marital status - Asian population 15 years and over
Males 16.4% Never married0.0% Now married0.0% Separated0.0% Widowed83.6% DivorcedFemales 27.5% Never married39.2% Now married0.0% Separated0.0% Widowed33.3% DivorcedWomen who did not give birth in the past 12 months Now married:
44.3% (48)Unmarried:
55.7% (60)
Marital status - Other race population 15 years and over
Males 86.4% Never married13.6% Now married0.0% Separated0.0% Widowed0.0% DivorcedFemales 87.1% Never married0.0% Now married0.0% Separated12.9% Widowed0.0% DivorcedWomen who did not give birth in the past 12 months Now married:
0.0% (0)Unmarried:
100.0% (311)
Marital status - Two or more races population 15 years and over
Males 25.6% Never married54.9% Now married0.0% Separated0.0% Widowed19.5% DivorcedFemales 15.7% Never married12.6% Now married1.0% Separated6.6% Widowed64.1% DivorcedWomen who did not give birth in the past 12 months Now married:
44.6% (37)Unmarried:
55.4% (46)
Marital status - White alone, not Hispanic / Latino population 15 years and over
Males 34.5% Never married45.8% Now married4.4% Separated4.4% Widowed10.9% DivorcedFemales 26.9% Never married43.8% Now married1.1% Separated12.1% Widowed16.1% DivorcedWomen who gave birth in the past 12 months Now married:
80.0% (214)Unmarried:
20.0% (54)
Women who did not give birth in the past 12 months Now married:
31.4% (908)Unmarried:
68.6% (1,980)
Marital status - Hispanic or Latino population 15 years and over
Males 54.7% Never married7.9% Now married0.0% Separated0.0% Widowed37.4% DivorcedFemales 96.4% Never married0.0% Now married0.0% Separated3.6% Widowed0.0% DivorcedWomen who did not give birth in the past 12 months Now married:
0.0% (0)Unmarried:
100.0% (204)
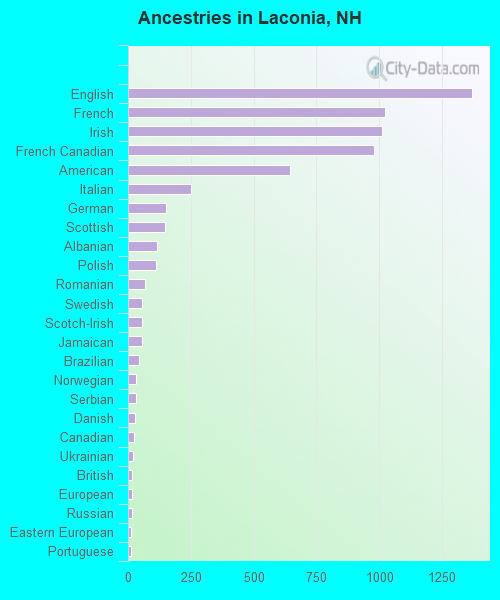
Ancestries in Laconia
1,369 18.9% English1,023 14.1% French1,010 13.9% Irish981 13.5% French Canadian644 8.9% American251 3.5% Italian151 2.1% German147 2.0% Scottish117 1.6% Albanian111 1.5% Polish68 0.9% Romanian55 0.8% Swedish54 0.7% Scotch-Irish54 0.7% Jamaican42 0.6% Brazilian30 0.4% Norwegian30 0.4% Serbian28 0.4% Danish22 0.3% Canadian21 0.3% Ukrainian17 0.2% British17 0.2% European15 0.2% Russian13 0.2% Eastern European13 0.2% Portuguese10 0.1% Greek9 0.1% Croatian6 0.08% Czech
Children Nativity (place of birth) in Laconia
Children under 6 years - Living with two parents Both parents native 314 100.0% NativeBoth parents foreign-born 50 100.0% NativeChildren under 6 years - Living with one parent Native parent 308 100.0% NativeForeign-born parent 47 100.0% NativeChildren 6 to 17 years - Living with two parents Both parents native 1,041 100.0% NativeBoth parents foreign-born 83 100.0% NativeChildren 6 to 17 years - Living with one parent Native parent 900 100.0% NativeForeign-born parent 63 48.8% Native66 51.2% Foreign-born
Grandparents responsible for own grandchildren in Laconia
Grandparents (30 to 59 years) White / Caucasian 20 16.0% Responsible for grandchildren107 84.0% Not responsible for grandchildrenWhite alone, not Hispanic / Latino 20 16.0% Responsible for grandchildren107 84.0% Not responsible for grandchildrenGrandparents (60 years and over) White / Caucasian 61 26.3% Responsible for grandchildren172 73.7% Not responsible for grandchildrenWhite alone, not Hispanic / Latino 61 26.2% Responsible for grandchildren173 73.8% Not responsible for grandchildren