Races in Lake Villa, Illinois (IL) Detailed Stats
Data:
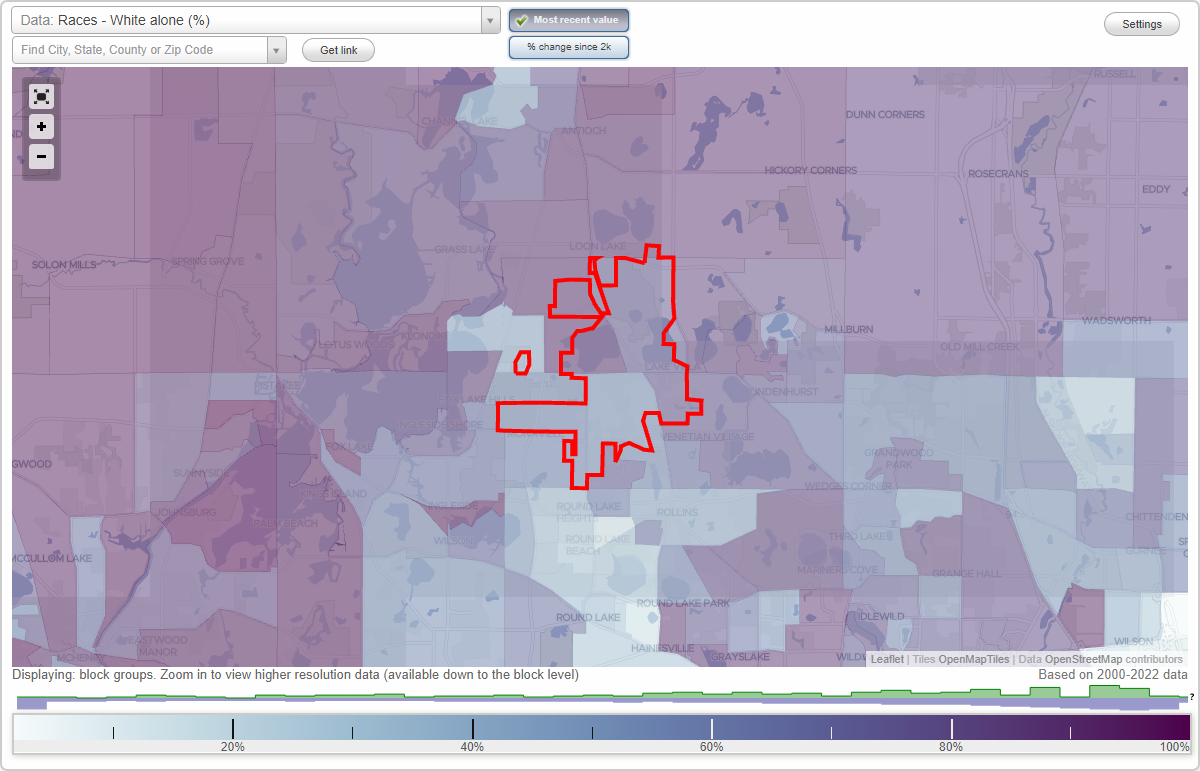
Races - White alone (%)
Races - White alone (% change since 2000)
Races - Black alone (%)
Races - Black alone (% change since 2000)
Races - American Indian alone (%)
Races - American Indian alone (% change since 2000)
Races - Asian alone (%)
Races - Asian alone (% change since 2000)
Races - Hispanic (%)
Races - Hispanic (% change since 2000)
Races - Native Hawaiian and Other Pacific Islander alone (%)
Races - Native Hawaiian and Other Pacific Islander alone (% change since 2000)
Races - Two or more races(%)
Races - Two or more races(% change since 2000)
Races - Other race alone (%)
Races - Other race alone (% change since 2000)
Racial diversity
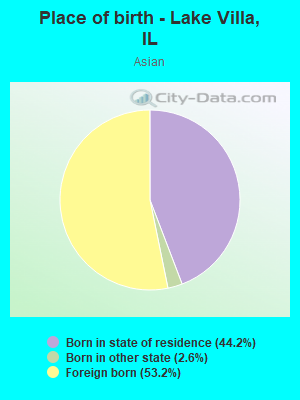
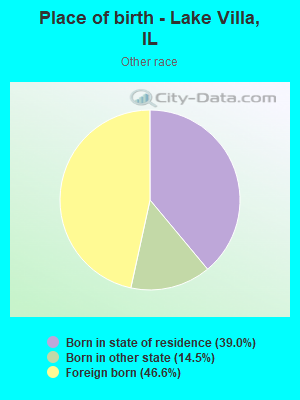
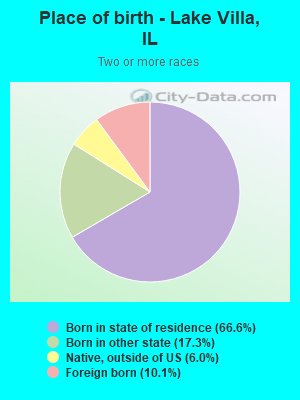
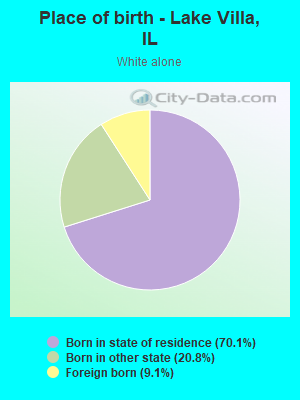
Place of birth - Born in state of residence (%)
Place of birth - Born in state of residence (%) - White
Place of birth - Born in state of residence (%) - Black or African American
Place of birth - Born in state of residence (%) - Asian
Place of birth - Born in state of residence (%) - Hispanic or Latino
Place of birth - Born in state of residence (%) - American Indian and Alaska Native
Place of birth - Born in state of residence (%) - Multirace
Place of birth - Born in state of residence (%) - Other Race
Place of birth - Born in other state (%)
Place of birth - Born in other state (%) - White
Place of birth - Born in other state (%) - Black or African American
Place of birth - Born in other state (%) - Asian
Place of birth - Born in other state (%) - Hispanic or Latino
Place of birth - Born in other state (%) - American Indian and Alaska Native
Place of birth - Born in other state (%) - Multirace
Place of birth - Born in other state (%) - Other Race
Place of birth - Native, outside of US (%)
Place of birth - Native, outside of US (%) - White
Place of birth - Native, outside of US (%) - Black or African American
Place of birth - Native, outside of US (%) - Asian
Place of birth - Native, outside of US (%) - Hispanic or Latino
Place of birth - Native, outside of US (%) - American Indian and Alaska Native
Place of birth - Native, outside of US (%) - Multirace
Place of birth - Native, outside of US (%) - Other Race
Place of birth - Foreign born (%)
Place of birth - Foreign born (%) - White
Place of birth - Foreign born (%) - Black or African American
Place of birth - Foreign born (%) - Asian
Place of birth - Foreign born (%) - Hispanic or Latino
Place of birth - Foreign born (%) - American Indian and Alaska Native
Place of birth - Foreign born (%) - Multirace
Place of birth - Foreign born (%) - Other Race
Residents speaking English at home (%)
Residents speaking English at home - Born in the United States (%)
Residents speaking English at home - Native, born elsewhere (%)
Residents speaking English at home - Foreign born (%)
Residents speaking Spanish at home (%)
Residents speaking Spanish at home - Born in the United States (%)
Residents speaking Spanish at home - Native, born elsewhere (%)
Residents speaking Spanish at home - Foreign born (%)
Residents speaking other language at home (%)
Residents speaking other language at home - Born in the United States (%)
Residents speaking other language at home - Native, born elsewhere (%)
Residents speaking other language at home - Foreign born (%)
Marital status - Never married (%)
Marital status - Now married (%)
Marital status - Separated (%)
Marital status - Widowed (%)
Marital status - Divorced (%)
Ancestries Reported - Arab (%)
Ancestries Reported - Czech (%)
Ancestries Reported - Danish (%)
Ancestries Reported - Dutch (%)
Ancestries Reported - English (%)
Ancestries Reported - French (%)
Ancestries Reported - French Canadian (%)
Ancestries Reported - German (%)
Ancestries Reported - Greek (%)
Ancestries Reported - Hungarian (%)
Ancestries Reported - Irish (%)
Ancestries Reported - Italian (%)
Ancestries Reported - Lithuanian (%)
Ancestries Reported - Norwegian (%)
Ancestries Reported - Polish (%)
Ancestries Reported - Portuguese (%)
Ancestries Reported - Russian (%)
Ancestries Reported - Scotch-Irish (%)
Ancestries Reported - Scottish (%)
Ancestries Reported - Slovak (%)
Ancestries Reported - Subsaharan African (%)
Ancestries Reported - Swedish (%)
Ancestries Reported - Swiss (%)
Ancestries Reported - Ukrainian (%)
Ancestries Reported - United States (%)
Ancestries Reported - Welsh (%)
Ancestries Reported - West Indian (%)
Ancestries Reported - Other (%)
Geographical mobility - Same house 1 year ago (%)
Geographical mobility - Same house 1 year ago (%) - White
Geographical mobility - Same house 1 year ago (%) - Black or African American
Geographical mobility - Same house 1 year ago (%) - Asian
Geographical mobility - Same house 1 year ago (%) - Hispanic or Latino
Geographical mobility - Same house 1 year ago (%) - American Indian and Alaska Native
Geographical mobility - Same house 1 year ago (%) - Multirace
Geographical mobility - Same house 1 year ago (%) - Other Race
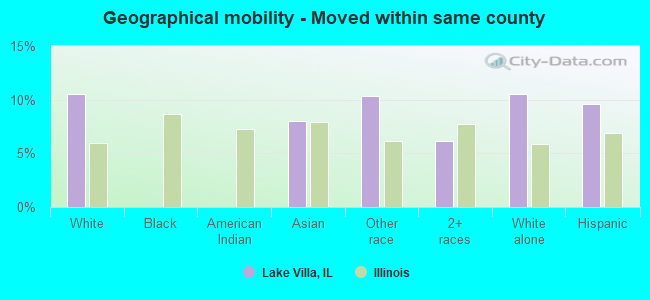
Geographical mobility - Moved within same county (%)
Geographical mobility - Moved within same county (%) - White
Geographical mobility - Moved within same county (%) - Black or African American
Geographical mobility - Moved within same county (%) - Asian
Geographical mobility - Moved within same county (%) - Hispanic or Latino
Geographical mobility - Moved within same county (%) - American Indian and Alaska Native
Geographical mobility - Moved within same county (%) - Multirace
Geographical mobility - Moved within same county (%) - Other Race
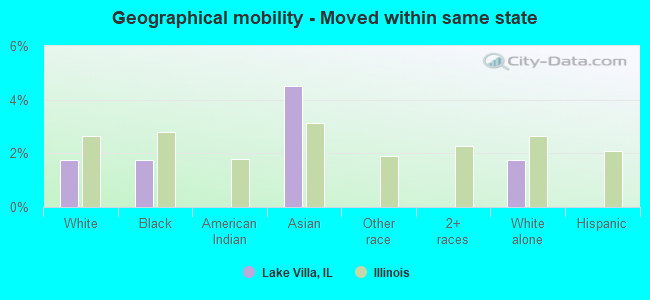
Geographical mobility - Moved from different county within same state (%)
Geographical mobility - Moved from different county within same state (%) - White
Geographical mobility - Moved from different county within same state (%) - Black or African American
Geographical mobility - Moved from different county within same state (%) - Asian
Geographical mobility - Moved from different county within same state (%) - Hispanic or Latino
Geographical mobility - Moved from different county within same state (%) - American Indian and Alaska Native
Geographical mobility - Moved from different county within same state (%) - Multirace
Geographical mobility - Moved from different county within same state (%) - Other Race
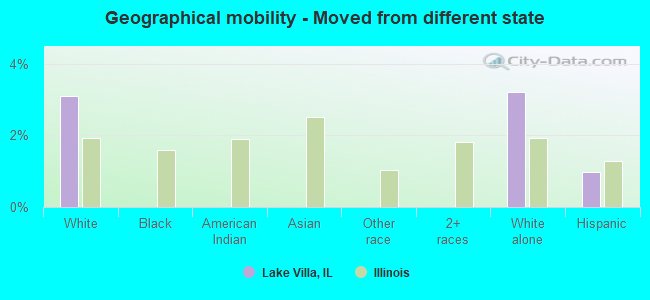
Geographical mobility - Moved from different state (%)
Geographical mobility - Moved from different state (%) - White
Geographical mobility - Moved from different state (%) - Black or African American
Geographical mobility - Moved from different state (%) - Asian
Geographical mobility - Moved from different state (%) - Hispanic or Latino
Geographical mobility - Moved from different state (%) - American Indian and Alaska Native
Geographical mobility - Moved from different state (%) - Multirace
Geographical mobility - Moved from different state (%) - Other Race
Geographical mobility - Moved from abroad (%)
Geographical mobility - Moved from abroad (%) - White
Geographical mobility - Moved from abroad (%) - Black or African American
Geographical mobility - Moved from abroad (%) - Asian
Geographical mobility - Moved from abroad (%) - Hispanic or Latino
Geographical mobility - Moved from abroad (%) - American Indian and Alaska Native
Geographical mobility - Moved from abroad (%) - Multirace
Geographical mobility - Moved from abroad (%) - Other Race
Place of birth for the foreign-born population - Ireland (%)
Place of birth for the foreign-born population - Denmark (%)
Place of birth for the foreign-born population - Norway (%)
Place of birth for the foreign-born population - Sweden (%)
Place of birth for the foreign-born population - United Kingdom (%)
Place of birth for the foreign-born population - England (%)
Place of birth for the foreign-born population - Scotland (%)
Place of birth for the foreign-born population - Other Northern Europe (%)
Place of birth for the foreign-born population - Austria (%)
Place of birth for the foreign-born population - Belgium (%)
Place of birth for the foreign-born population - France (%)
Place of birth for the foreign-born population - Germany (%)
Place of birth for the foreign-born population - Netherlands (%)
Place of birth for the foreign-born population - Switzerland (%)
Place of birth for the foreign-born population - Other Western Europe (%)
Place of birth for the foreign-born population - Greece (%)
Place of birth for the foreign-born population - Italy (%)
Place of birth for the foreign-born population - Portugal (%)
Place of birth for the foreign-born population - Spain (%)
Place of birth for the foreign-born population - Other Southern Europe (%)
Place of birth for the foreign-born population - Albania (%)
Place of birth for the foreign-born population - Belarus (%)
Place of birth for the foreign-born population - Bosnia and Herzegovina (%)
Place of birth for the foreign-born population - Bulgaria (%)
Place of birth for the foreign-born population - Croatia (%)
Place of birth for the foreign-born population - Czechoslovakia (%)
Place of birth for the foreign-born population - Hungary (%)
Place of birth for the foreign-born population - Latvia (%)
Place of birth for the foreign-born population - Lithuania (%)
Place of birth for the foreign-born population - North Macedonia (Macedonia) (%)
Place of birth for the foreign-born population - Moldova (%)
Place of birth for the foreign-born population - Poland (%)
Place of birth for the foreign-born population - Romania (%)
Place of birth for the foreign-born population - Russia (%)
Place of birth for the foreign-born population - Serbia (%)
Place of birth for the foreign-born population - Ukraine (%)
Place of birth for the foreign-born population - Other Eastern Europe (%)
Place of birth for the foreign-born population - China (%)
Place of birth for the foreign-born population - Hong Kong (%)
Place of birth for the foreign-born population - Taiwan (%)
Place of birth for the foreign-born population - Japan (%)
Place of birth for the foreign-born population - Korea (%)
Place of birth for the foreign-born population - Other Eastern Asia (%)
Place of birth for the foreign-born population - Afghanistan (%)
Place of birth for the foreign-born population - Bangladesh (%)
Place of birth for the foreign-born population - India (%)
Place of birth for the foreign-born population - Iran (%)
Place of birth for the foreign-born population - Kazakhstan (%)
Place of birth for the foreign-born population - Nepal (%)
Place of birth for the foreign-born population - Pakistan (%)
Place of birth for the foreign-born population - Sri Lanka (%)
Place of birth for the foreign-born population - Uzbekistan (%)
Place of birth for the foreign-born population - Other South Central Asia (%)
Place of birth for the foreign-born population - Burma (%)
Place of birth for the foreign-born population - Cambodia (%)
Place of birth for the foreign-born population - Indonesia (%)
Place of birth for the foreign-born population - Laos (%)
Place of birth for the foreign-born population - Malaysia (%)
Place of birth for the foreign-born population - Philippines (%)
Place of birth for the foreign-born population - Singapore (%)
Place of birth for the foreign-born population - Thailand (%)
Place of birth for the foreign-born population - Vietnam (%)
Place of birth for the foreign-born population - Other South Eastern Asia (%)
Place of birth for the foreign-born population - Armenia (%)
Place of birth for the foreign-born population - Iraq (%)
Place of birth for the foreign-born population - Israel (%)
Place of birth for the foreign-born population - Jordan (%)
Place of birth for the foreign-born population - Kuwait (%)
Place of birth for the foreign-born population - Lebanon (%)
Place of birth for the foreign-born population - Saudi Arabia (%)
Place of birth for the foreign-born population - Syria (%)
Place of birth for the foreign-born population - Turkey (%)
Place of birth for the foreign-born population - Yemen (%)
Place of birth for the foreign-born population - Other Western Asia (%)
Place of birth for the foreign-born population - Eritrea (%)
Place of birth for the foreign-born population - Ethiopia (%)
Place of birth for the foreign-born population - Kenya (%)
Place of birth for the foreign-born population - Somalia (%)
Place of birth for the foreign-born population - Uganda (%)
Place of birth for the foreign-born population - Zimbabwe (%)
Place of birth for the foreign-born population - Other Eastern Africa (%)
Place of birth for the foreign-born population - Cameroon (%)
Place of birth for the foreign-born population - Congo (%)
Place of birth for the foreign-born population - Democratic Republic of Congo (Zaire) (%)
Place of birth for the foreign-born population - Other Middle Africa (%)
Place of birth for the foreign-born population - Egypt (%)
Place of birth for the foreign-born population - Morocco (%)
Place of birth for the foreign-born population - Sudan (%)
Place of birth for the foreign-born population - Other Northern Africa (%)
Place of birth for the foreign-born population - South Africa (%)
Place of birth for the foreign-born population - Other Southern Africa (%)
Place of birth for the foreign-born population - Cabo Verde (%)
Place of birth for the foreign-born population - Ghana (%)
Place of birth for the foreign-born population - Liberia (%)
Place of birth for the foreign-born population - Nigeria (%)
Place of birth for the foreign-born population - Senegal (%)
Place of birth for the foreign-born population - Sierra Leone (%)
Place of birth for the foreign-born population - Other Western Africa (%)
Place of birth for the foreign-born population - Australia (%)
Place of birth for the foreign-born population - New Zealand (%)
Place of birth for the foreign-born population - Fiji (%)
Place of birth for the foreign-born population - Micronesia (%)
Place of birth for the foreign-born population - Bahamas (%)
Place of birth for the foreign-born population - Barbados (%)
Place of birth for the foreign-born population - Cuba (%)
Place of birth for the foreign-born population - Dominica (%)
Place of birth for the foreign-born population - Dominican Republic (%)
Place of birth for the foreign-born population - Grenada (%)
Place of birth for the foreign-born population - Haiti (%)
Place of birth for the foreign-born population - Jamaica (%)
Place of birth for the foreign-born population - St. Vincent and the Grenadines (%)
Place of birth for the foreign-born population - Trinidad and Tobago (%)
Place of birth for the foreign-born population - West Indies (%)
Place of birth for the foreign-born population - Other Caribbean (%)
Place of birth for the foreign-born population - Belize (%)
Place of birth for the foreign-born population - Costa Rica (%)
Place of birth for the foreign-born population - El Salvador (%)
Place of birth for the foreign-born population - Guatemala (%)
Place of birth for the foreign-born population - Honduras (%)
Place of birth for the foreign-born population - Mexico (%)
Place of birth for the foreign-born population - Nicaragua (%)
Place of birth for the foreign-born population - Panama (%)
Place of birth for the foreign-born population - Other Central America (%)
Place of birth for the foreign-born population - Argentina (%)
Place of birth for the foreign-born population - Bolivia (%)
Place of birth for the foreign-born population - Brazil (%)
Place of birth for the foreign-born population - Chile (%)
Place of birth for the foreign-born population - Colombia (%)
Place of birth for the foreign-born population - Ecuador (%)
Place of birth for the foreign-born population - Guyana (%)
Place of birth for the foreign-born population - Peru (%)
Place of birth for the foreign-born population - Uruguay (%)
Place of birth for the foreign-born population - Venezuela (%)
Place of birth for the foreign-born population - Other South America (%)
Place of birth for the foreign-born population - Canada (%)
Place of birth for the foreign-born population - Other Northern America (%)
Place of birth for the foreign-born population - Other (%)
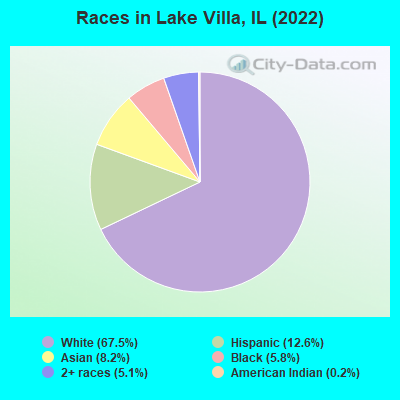
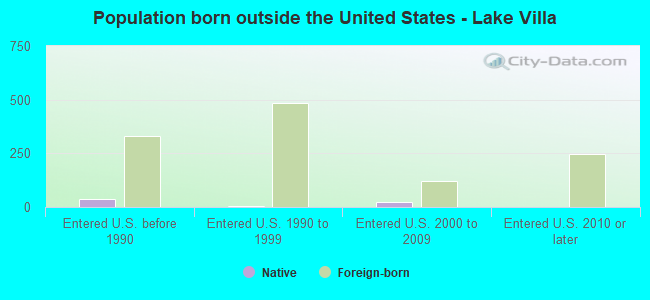
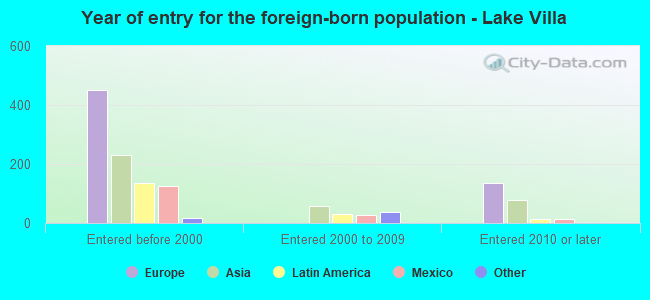
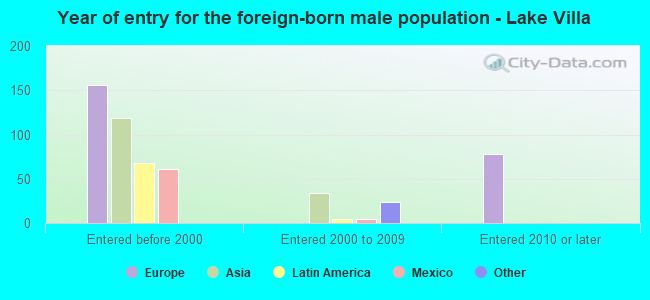
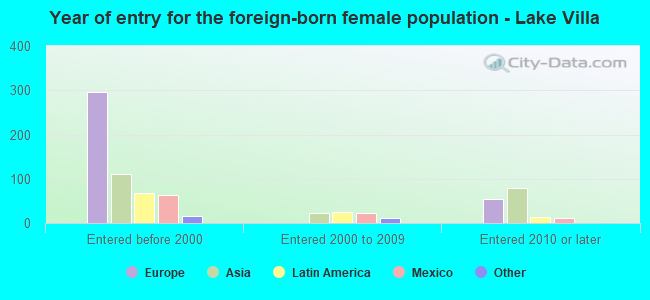
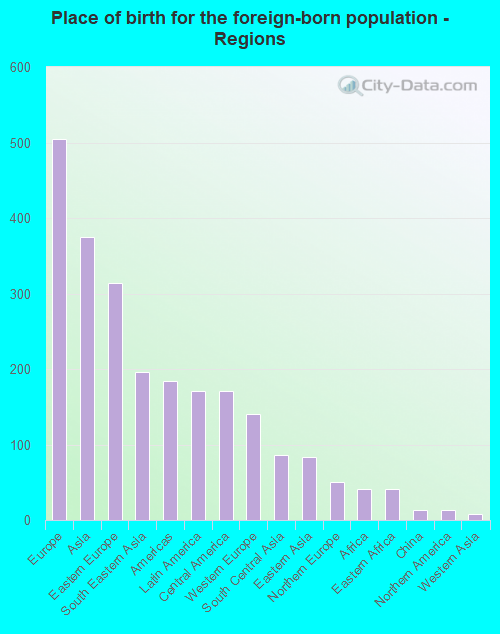
According to 2022 data, the most numerous races in Lake Villa, IL are White alone (5,840 residents), Hispanic (1,088 residents), and Black alone (498 residents). 80.9% of Lake Villa residents speak English at home. 12.8% of Lake Villa, IL residents are foreign-born (5.8% born in Europe, 4.3% born in Asia, 2.0% born in Latin America), which is 9.5% less than the foreign-born rate of 14.0% across the entire state of Illinois.
Race distribution in Lake Villa
2000 2022
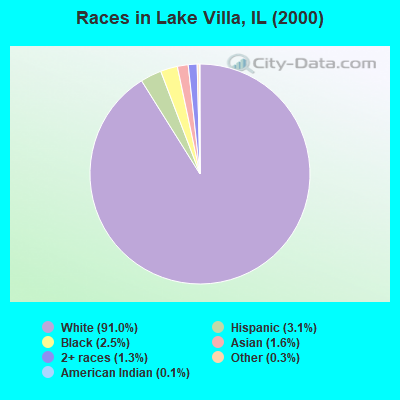
8,424,140 67.8% White alone 1,856,152 14.9% Black alone 1,530,262 12.3% Hispanic 419,916 3.4% Asian alone 153,996 1.2% Two or more races 13,479 0.1% Other race alone 18,232 0.1% American Indian alone 3,116 0.03% Native Hawaiian and Other
7,356,301 58.5% White alone 2,299,726 18.3% Hispanic 1,660,423 13.2% Black alone 747,296 5.9% Asian alone 458,599 3.6% Two or more races 45,386 0.4% Other race alone 10,405 0.08% American Indian alone 3,896 0.03% Native Hawaiian and Other
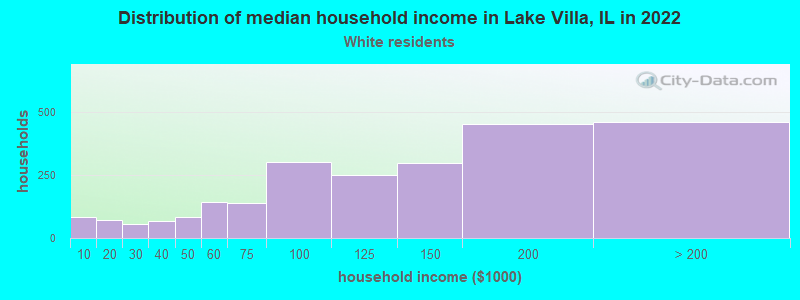
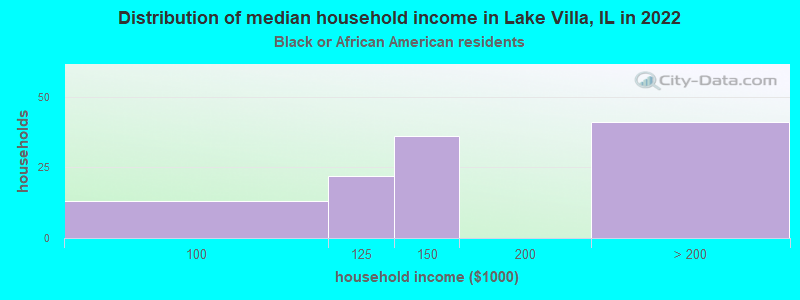
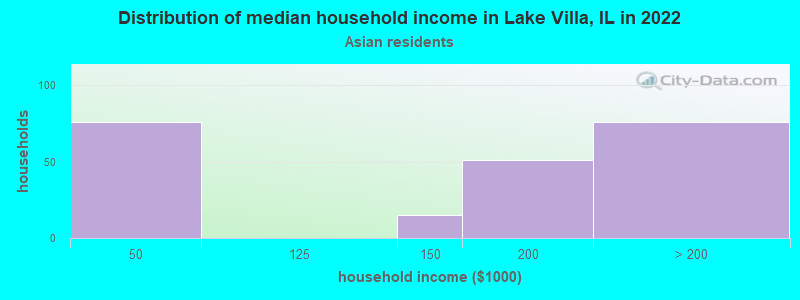
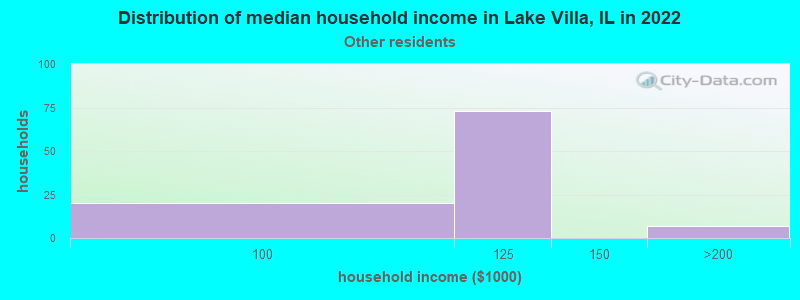
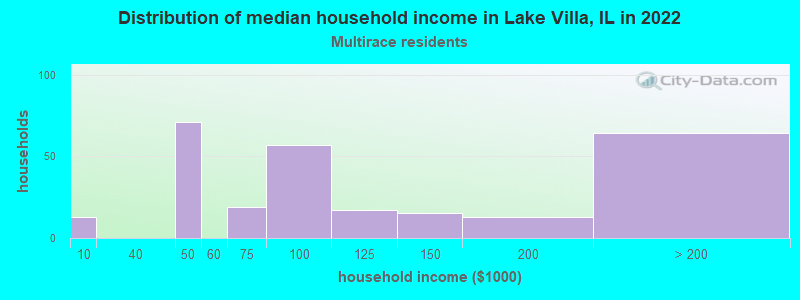
Income and house value in Lake Villa Median household income in 2022 $124,688 White non-Hispanic householders$149,197 Black householders$179,901 Asian householders$108,842 Some other race householders$88,361 Two or more races householders$97,904 Hispanic or Latino race householdersMedian 2022 house value $319,572 White Non-Hispanic householders$375,116 Black or African American householders $350,067 Asian householders$272,274 Some other race householders$461,933 Two or more races householders$269,785 Hispanic or Latino householders
Median age by race in Lake Villa
49.8 Median age for White residents49.8 49.8 19.2 Median age for Black or African American residents25.2 15.8 -657,243,815.6 Median age for American Indian / Alaska Native residents-671,532,846.0 -638,251,365.5 37.2 Median age for Asian residents23.5 46.4 -593,236,714.4 Median age for Native Hawaiian / Pacific Islander residents-658,536,584.7 -576,015,108.0 40.8 Median age for Other race residents40.4 45.5 19.2 Median age for Two or more races residents18.1 21.4 49.6 Median age for White alone residents49.0 50.3 26.9 Median age for Hispanic or Latino residents27.3 23.4
Owner/renter occupied households by race in Lake Villa
House owners and renters - White residents 1,775 74.0% Owner occupied625 26.0% Renter occupiedHouse owners and renters - Black or African American residents 73 61.3% Owner occupied46 38.7% Renter occupiedHouse owners and renters - American Indian / Alaska Native residents 32 100.0% Renter occupiedHouse owners and renters - Asian residents 182 89.4% Owner occupied22 10.6% Renter occupiedHouse owners and renters - Other race residents 47 57.8% Owner occupied35 42.2% Renter occupiedHouse owners and renters - Two or more races residents 133 49.8% Owner occupied133 50.2% Renter occupiedHouse owners and renters - White alone residents 1,791 74.9% Owner occupied601 25.1% Renter occupiedHouse owners and renters - Hispanic or Latino residents 147 46.1% Owner occupied172 53.9% Renter occupied
Language usage in Lake Villa
English speakers - Total 80.9% of residents of Lake Villa speak English at home.
5.8% of residents speak Spanish at home 342 70.4% Speak English very well144 29.6% Speak English less than very well12.8% of residents speak other language at home 788 73.6% Speak English very well282 26.4% Speak English less than very well
English speakers - Born in the United States 90.4% of residents of Lake Villa speak English at home.
2.7% of residents speak Spanish at home 28 70.0% Speak English very well12 30.0% Speak English less than very well6.3% of residents speak other language at home 93 100.0% Speak English very well
English speakers - Native, born elsewhere 50.7% of residents of Lake Villa speak English at home.
43.8% of residents speak Spanish at home 15 46.9% Speak English very well17 53.1% Speak English less than very well
English speakers - Foreign-born 22.2% of residents of Lake Villa speak English at home.
14.9% of residents speak Spanish at home 68 39.5% Speak English very well104 60.5% Speak English less than very well63.1% of residents speak other language at home 453 62.2% Speak English very well275 37.8% Speak English less than very well
White (Caucasian) - Speak only English Native:
98.2% (5,085)Foreign-born:
38.7% (152)
White (Caucasian) - Speak another language Native:
3.3% (172)Foreign-born:
65.2% (256)
Black or African American - Speak another language Native:
16.6% (77)Foreign-born:
100.0% (42)
Asian - Speak only English Native:
59.0% (175)Foreign-born:
19.9% (76)
Asian - Speak another language Native:
29.3% (87)Foreign-born:
78.7% (302)
Other race - Speak another language Native:
61.7% (76)Foreign-born:
94.8% (99)
Two or more races - Speak another language Native:
22.6% (245)Foreign-born:
100.0% (133)
White alone - Speak only English Native:
95.9% (4,922)Foreign-born:
29.2% (155)
White alone - Speak another language Native:
4.0% (206)Foreign-born:
70.8% (377)
Hispanic or Latino - Speak another language Native:
33.1% (271)Foreign-born:
97.3% (176)
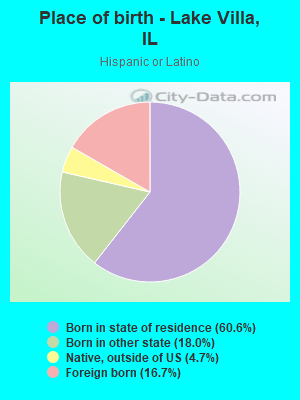
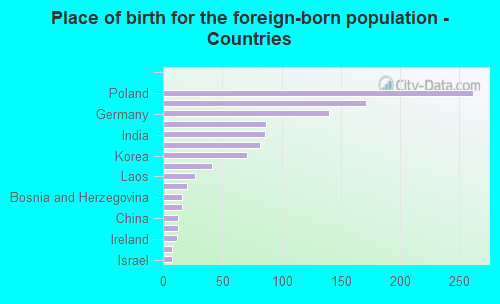
Foreign-born residents in Lake Villa 1,106 residents are foreign born (5.8% Europe , 4.3% Asia , 2.0% Latin America ).
This city:
12.8%Illinois:
14.1%
Marital status for residents in Lake Villa Marital status - White (Caucasian) population 15 years and over
Males 30.0% Never married62.6% Now married0.0% Separated1.0% Widowed6.4% DivorcedFemales 21.5% Never married59.6% Now married0.0% Separated7.8% Widowed11.0% DivorcedWomen who gave birth in the past 12 months Now married:
82.6% (50)Unmarried:
17.4% (11)
Women who did not give birth in the past 12 months Now married:
51.2% (640)Unmarried:
48.8% (610)
Marital status - Black or African American population 15 years and over
Males 50.9% Never married49.1% Now married0.0% Separated0.0% Widowed0.0% DivorcedFemales 35.6% Never married37.8% Now married0.0% Separated19.3% Widowed7.4% DivorcedWomen who did not give birth in the past 12 months Now married:
46.8% (46)Unmarried:
53.2% (53)
Marital status - Asian population 15 years and over
Males 20.8% Never married79.2% Now married0.0% Separated0.0% Widowed0.0% DivorcedFemales 13.6% Never married67.6% Now married0.0% Separated6.8% Widowed12.0% DivorcedWomen who did not give birth in the past 12 months Now married:
74.7% (173)Unmarried:
25.3% (59)
Marital status - Other race population 15 years and over
Males 27.5% Never married62.7% Now married0.0% Separated0.0% Widowed9.8% DivorcedFemales 29.2% Never married70.8% Now married0.0% Separated0.0% Widowed0.0% DivorcedWomen who did not give birth in the past 12 months Now married:
64.1% (25)Unmarried:
35.9% (14)
Marital status - Two or more races population 15 years and over
Males 62.3% Never married32.9% Now married4.8% Separated0.0% Widowed0.0% DivorcedFemales 57.9% Never married27.5% Now married0.0% Separated0.0% Widowed14.6% DivorcedWomen who gave birth in the past 12 months Now married:
100.0% (13)Unmarried:
0.0% (0)
Women who did not give birth in the past 12 months Now married:
20.7% (75)Unmarried:
79.3% (286)
Marital status - White alone, not Hispanic / Latino population 15 years and over
Males 29.9% Never married62.4% Now married0.0% Separated1.0% Widowed6.6% DivorcedFemales 20.0% Never married61.5% Now married0.0% Separated8.2% Widowed10.3% DivorcedWomen who gave birth in the past 12 months Now married:
82.6% (54)Unmarried:
17.4% (11)
Women who did not give birth in the past 12 months Now married:
53.3% (655)Unmarried:
46.7% (575)
Marital status - Hispanic or Latino population 15 years and over
Males 40.8% Never married52.4% Now married3.9% Separated0.0% Widowed2.8% DivorcedFemales 50.5% Never married36.6% Now married0.0% Separated0.0% Widowed12.9% DivorcedWomen who gave birth in the past 12 months Now married:
100.0% (9)Unmarried:
0.0% (0)
Women who did not give birth in the past 12 months Now married:
30.0% (96)Unmarried:
70.0% (223)
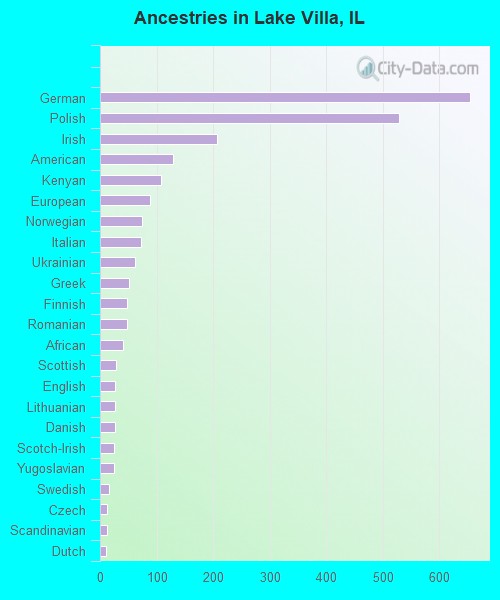
Ancestries in Lake Villa
655 17.6% German528 14.2% Polish207 5.6% Irish129 3.5% American107 2.9% Kenyan89 2.4% European74 2.0% Norwegian72 1.9% Italian61 1.6% Ukrainian51 1.4% Greek48 1.3% Finnish48 1.3% Romanian41 1.1% African28 0.8% Scottish27 0.7% English27 0.7% Lithuanian26 0.7% Danish24 0.6% Scotch-Irish24 0.6% Yugoslavian16 0.4% Swedish13 0.3% Czech13 0.3% Scandinavian10 0.3% Dutch3 0.08% British
Children Nativity (place of birth) in Lake Villa
Children under 6 years - Living with two parents Both parents native 239 100.0% NativeBoth parents foreign-born 24 100.0% NativeOne native, one foreign-born parent 64 100.0% NativeChildren under 6 years - Living with one parent Native parent 43 100.0% NativeChildren 6 to 17 years - Living with two parents Both parents native 835 100.0% NativeBoth parents foreign-born 303 100.0% NativeOne native, one foreign-born parent 254 100.0% NativeChildren 6 to 17 years - Living with one parent Native parent 264 91.4% Native25 8.6% Foreign-bornForeign-born parent 29 79.0% Native8 21.0% Foreign-born
Grandparents responsible for own grandchildren in Lake Villa
Grandparents (30 to 59 years) White / Caucasian 10 44.7% Responsible for grandchildren13 55.3% Not responsible for grandchildrenTwo or more races 41 100.0% Not responsible for grandchildrenWhite alone, not Hispanic / Latino 13 49.6% Responsible for grandchildren13 50.4% Not responsible for grandchildrenHispanic or Latino 27 100.0% Not responsible for grandchildren
Grandparents (60 years and over) White / Caucasian 49 100.0% Not responsible for grandchildrenTwo or more races 13 100.0% Not responsible for grandchildrenWhite alone, not Hispanic / Latino 69 100.0% Not responsible for grandchildrenHispanic or Latino 23 100.0% Not responsible for grandchildren