Races in Lakeland, Tennessee (TN) Detailed Stats
Data:
Races - White alone (%)
Races - White alone (% change since 2000)
Races - Black alone (%)
Races - Black alone (% change since 2000)
Races - American Indian alone (%)
Races - American Indian alone (% change since 2000)
Races - Asian alone (%)
Races - Asian alone (% change since 2000)
Races - Hispanic (%)
Races - Hispanic (% change since 2000)
Races - Native Hawaiian and Other Pacific Islander alone (%)
Races - Native Hawaiian and Other Pacific Islander alone (% change since 2000)
Races - Two or more races(%)
Races - Two or more races(% change since 2000)
Races - Other race alone (%)
Races - Other race alone (% change since 2000)
Racial diversity
Place of birth - Born in state of residence (%)
Place of birth - Born in state of residence (%) - White
Place of birth - Born in state of residence (%) - Black or African American
Place of birth - Born in state of residence (%) - Asian
Place of birth - Born in state of residence (%) - Hispanic or Latino
Place of birth - Born in state of residence (%) - American Indian and Alaska Native
Place of birth - Born in state of residence (%) - Multirace
Place of birth - Born in state of residence (%) - Other Race
Place of birth - Born in other state (%)
Place of birth - Born in other state (%) - White
Place of birth - Born in other state (%) - Black or African American
Place of birth - Born in other state (%) - Asian
Place of birth - Born in other state (%) - Hispanic or Latino
Place of birth - Born in other state (%) - American Indian and Alaska Native
Place of birth - Born in other state (%) - Multirace
Place of birth - Born in other state (%) - Other Race
Place of birth - Native, outside of US (%)
Place of birth - Native, outside of US (%) - White
Place of birth - Native, outside of US (%) - Black or African American
Place of birth - Native, outside of US (%) - Asian
Place of birth - Native, outside of US (%) - Hispanic or Latino
Place of birth - Native, outside of US (%) - American Indian and Alaska Native
Place of birth - Native, outside of US (%) - Multirace
Place of birth - Native, outside of US (%) - Other Race
Place of birth - Foreign born (%)
Place of birth - Foreign born (%) - White
Place of birth - Foreign born (%) - Black or African American
Place of birth - Foreign born (%) - Asian
Place of birth - Foreign born (%) - Hispanic or Latino
Place of birth - Foreign born (%) - American Indian and Alaska Native
Place of birth - Foreign born (%) - Multirace
Place of birth - Foreign born (%) - Other Race
Residents speaking English at home (%)
Residents speaking English at home - Born in the United States (%)
Residents speaking English at home - Native, born elsewhere (%)
Residents speaking English at home - Foreign born (%)
Residents speaking Spanish at home (%)
Residents speaking Spanish at home - Born in the United States (%)
Residents speaking Spanish at home - Native, born elsewhere (%)
Residents speaking Spanish at home - Foreign born (%)
Residents speaking other language at home (%)
Residents speaking other language at home - Born in the United States (%)
Residents speaking other language at home - Native, born elsewhere (%)
Residents speaking other language at home - Foreign born (%)
Marital status - Never married (%)
Marital status - Now married (%)
Marital status - Separated (%)
Marital status - Widowed (%)
Marital status - Divorced (%)
Ancestries Reported - Arab (%)
Ancestries Reported - Czech (%)
Ancestries Reported - Danish (%)
Ancestries Reported - Dutch (%)
Ancestries Reported - English (%)
Ancestries Reported - French (%)
Ancestries Reported - French Canadian (%)
Ancestries Reported - German (%)
Ancestries Reported - Greek (%)
Ancestries Reported - Hungarian (%)
Ancestries Reported - Irish (%)
Ancestries Reported - Italian (%)
Ancestries Reported - Lithuanian (%)
Ancestries Reported - Norwegian (%)
Ancestries Reported - Polish (%)
Ancestries Reported - Portuguese (%)
Ancestries Reported - Russian (%)
Ancestries Reported - Scotch-Irish (%)
Ancestries Reported - Scottish (%)
Ancestries Reported - Slovak (%)
Ancestries Reported - Subsaharan African (%)
Ancestries Reported - Swedish (%)
Ancestries Reported - Swiss (%)
Ancestries Reported - Ukrainian (%)
Ancestries Reported - United States (%)
Ancestries Reported - Welsh (%)
Ancestries Reported - West Indian (%)
Ancestries Reported - Other (%)
Geographical mobility - Same house 1 year ago (%)
Geographical mobility - Same house 1 year ago (%) - White
Geographical mobility - Same house 1 year ago (%) - Black or African American
Geographical mobility - Same house 1 year ago (%) - Asian
Geographical mobility - Same house 1 year ago (%) - Hispanic or Latino
Geographical mobility - Same house 1 year ago (%) - American Indian and Alaska Native
Geographical mobility - Same house 1 year ago (%) - Multirace
Geographical mobility - Same house 1 year ago (%) - Other Race
Geographical mobility - Moved within same county (%)
Geographical mobility - Moved within same county (%) - White
Geographical mobility - Moved within same county (%) - Black or African American
Geographical mobility - Moved within same county (%) - Asian
Geographical mobility - Moved within same county (%) - Hispanic or Latino
Geographical mobility - Moved within same county (%) - American Indian and Alaska Native
Geographical mobility - Moved within same county (%) - Multirace
Geographical mobility - Moved within same county (%) - Other Race
Geographical mobility - Moved from different county within same state (%)
Geographical mobility - Moved from different county within same state (%) - White
Geographical mobility - Moved from different county within same state (%) - Black or African American
Geographical mobility - Moved from different county within same state (%) - Asian
Geographical mobility - Moved from different county within same state (%) - Hispanic or Latino
Geographical mobility - Moved from different county within same state (%) - American Indian and Alaska Native
Geographical mobility - Moved from different county within same state (%) - Multirace
Geographical mobility - Moved from different county within same state (%) - Other Race
Geographical mobility - Moved from different state (%)
Geographical mobility - Moved from different state (%) - White
Geographical mobility - Moved from different state (%) - Black or African American
Geographical mobility - Moved from different state (%) - Asian
Geographical mobility - Moved from different state (%) - Hispanic or Latino
Geographical mobility - Moved from different state (%) - American Indian and Alaska Native
Geographical mobility - Moved from different state (%) - Multirace
Geographical mobility - Moved from different state (%) - Other Race
Geographical mobility - Moved from abroad (%)
Geographical mobility - Moved from abroad (%) - White
Geographical mobility - Moved from abroad (%) - Black or African American
Geographical mobility - Moved from abroad (%) - Asian
Geographical mobility - Moved from abroad (%) - Hispanic or Latino
Geographical mobility - Moved from abroad (%) - American Indian and Alaska Native
Geographical mobility - Moved from abroad (%) - Multirace
Geographical mobility - Moved from abroad (%) - Other Race
Place of birth for the foreign-born population - Ireland (%)
Place of birth for the foreign-born population - Denmark (%)
Place of birth for the foreign-born population - Norway (%)
Place of birth for the foreign-born population - Sweden (%)
Place of birth for the foreign-born population - United Kingdom (%)
Place of birth for the foreign-born population - England (%)
Place of birth for the foreign-born population - Scotland (%)
Place of birth for the foreign-born population - Other Northern Europe (%)
Place of birth for the foreign-born population - Austria (%)
Place of birth for the foreign-born population - Belgium (%)
Place of birth for the foreign-born population - France (%)
Place of birth for the foreign-born population - Germany (%)
Place of birth for the foreign-born population - Netherlands (%)
Place of birth for the foreign-born population - Switzerland (%)
Place of birth for the foreign-born population - Other Western Europe (%)
Place of birth for the foreign-born population - Greece (%)
Place of birth for the foreign-born population - Italy (%)
Place of birth for the foreign-born population - Portugal (%)
Place of birth for the foreign-born population - Spain (%)
Place of birth for the foreign-born population - Other Southern Europe (%)
Place of birth for the foreign-born population - Albania (%)
Place of birth for the foreign-born population - Belarus (%)
Place of birth for the foreign-born population - Bosnia and Herzegovina (%)
Place of birth for the foreign-born population - Bulgaria (%)
Place of birth for the foreign-born population - Croatia (%)
Place of birth for the foreign-born population - Czechoslovakia (%)
Place of birth for the foreign-born population - Hungary (%)
Place of birth for the foreign-born population - Latvia (%)
Place of birth for the foreign-born population - Lithuania (%)
Place of birth for the foreign-born population - North Macedonia (Macedonia) (%)
Place of birth for the foreign-born population - Moldova (%)
Place of birth for the foreign-born population - Poland (%)
Place of birth for the foreign-born population - Romania (%)
Place of birth for the foreign-born population - Russia (%)
Place of birth for the foreign-born population - Serbia (%)
Place of birth for the foreign-born population - Ukraine (%)
Place of birth for the foreign-born population - Other Eastern Europe (%)
Place of birth for the foreign-born population - China (%)
Place of birth for the foreign-born population - Hong Kong (%)
Place of birth for the foreign-born population - Taiwan (%)
Place of birth for the foreign-born population - Japan (%)
Place of birth for the foreign-born population - Korea (%)
Place of birth for the foreign-born population - Other Eastern Asia (%)
Place of birth for the foreign-born population - Afghanistan (%)
Place of birth for the foreign-born population - Bangladesh (%)
Place of birth for the foreign-born population - India (%)
Place of birth for the foreign-born population - Iran (%)
Place of birth for the foreign-born population - Kazakhstan (%)
Place of birth for the foreign-born population - Nepal (%)
Place of birth for the foreign-born population - Pakistan (%)
Place of birth for the foreign-born population - Sri Lanka (%)
Place of birth for the foreign-born population - Uzbekistan (%)
Place of birth for the foreign-born population - Other South Central Asia (%)
Place of birth for the foreign-born population - Burma (%)
Place of birth for the foreign-born population - Cambodia (%)
Place of birth for the foreign-born population - Indonesia (%)
Place of birth for the foreign-born population - Laos (%)
Place of birth for the foreign-born population - Malaysia (%)
Place of birth for the foreign-born population - Philippines (%)
Place of birth for the foreign-born population - Singapore (%)
Place of birth for the foreign-born population - Thailand (%)
Place of birth for the foreign-born population - Vietnam (%)
Place of birth for the foreign-born population - Other South Eastern Asia (%)
Place of birth for the foreign-born population - Armenia (%)
Place of birth for the foreign-born population - Iraq (%)
Place of birth for the foreign-born population - Israel (%)
Place of birth for the foreign-born population - Jordan (%)
Place of birth for the foreign-born population - Kuwait (%)
Place of birth for the foreign-born population - Lebanon (%)
Place of birth for the foreign-born population - Saudi Arabia (%)
Place of birth for the foreign-born population - Syria (%)
Place of birth for the foreign-born population - Turkey (%)
Place of birth for the foreign-born population - Yemen (%)
Place of birth for the foreign-born population - Other Western Asia (%)
Place of birth for the foreign-born population - Eritrea (%)
Place of birth for the foreign-born population - Ethiopia (%)
Place of birth for the foreign-born population - Kenya (%)
Place of birth for the foreign-born population - Somalia (%)
Place of birth for the foreign-born population - Uganda (%)
Place of birth for the foreign-born population - Zimbabwe (%)
Place of birth for the foreign-born population - Other Eastern Africa (%)
Place of birth for the foreign-born population - Cameroon (%)
Place of birth for the foreign-born population - Congo (%)
Place of birth for the foreign-born population - Democratic Republic of Congo (Zaire) (%)
Place of birth for the foreign-born population - Other Middle Africa (%)
Place of birth for the foreign-born population - Egypt (%)
Place of birth for the foreign-born population - Morocco (%)
Place of birth for the foreign-born population - Sudan (%)
Place of birth for the foreign-born population - Other Northern Africa (%)
Place of birth for the foreign-born population - South Africa (%)
Place of birth for the foreign-born population - Other Southern Africa (%)
Place of birth for the foreign-born population - Cabo Verde (%)
Place of birth for the foreign-born population - Ghana (%)
Place of birth for the foreign-born population - Liberia (%)
Place of birth for the foreign-born population - Nigeria (%)
Place of birth for the foreign-born population - Senegal (%)
Place of birth for the foreign-born population - Sierra Leone (%)
Place of birth for the foreign-born population - Other Western Africa (%)
Place of birth for the foreign-born population - Australia (%)
Place of birth for the foreign-born population - New Zealand (%)
Place of birth for the foreign-born population - Fiji (%)
Place of birth for the foreign-born population - Micronesia (%)
Place of birth for the foreign-born population - Bahamas (%)
Place of birth for the foreign-born population - Barbados (%)
Place of birth for the foreign-born population - Cuba (%)
Place of birth for the foreign-born population - Dominica (%)
Place of birth for the foreign-born population - Dominican Republic (%)
Place of birth for the foreign-born population - Grenada (%)
Place of birth for the foreign-born population - Haiti (%)
Place of birth for the foreign-born population - Jamaica (%)
Place of birth for the foreign-born population - St. Vincent and the Grenadines (%)
Place of birth for the foreign-born population - Trinidad and Tobago (%)
Place of birth for the foreign-born population - West Indies (%)
Place of birth for the foreign-born population - Other Caribbean (%)
Place of birth for the foreign-born population - Belize (%)
Place of birth for the foreign-born population - Costa Rica (%)
Place of birth for the foreign-born population - El Salvador (%)
Place of birth for the foreign-born population - Guatemala (%)
Place of birth for the foreign-born population - Honduras (%)
Place of birth for the foreign-born population - Mexico (%)
Place of birth for the foreign-born population - Nicaragua (%)
Place of birth for the foreign-born population - Panama (%)
Place of birth for the foreign-born population - Other Central America (%)
Place of birth for the foreign-born population - Argentina (%)
Place of birth for the foreign-born population - Bolivia (%)
Place of birth for the foreign-born population - Brazil (%)
Place of birth for the foreign-born population - Chile (%)
Place of birth for the foreign-born population - Colombia (%)
Place of birth for the foreign-born population - Ecuador (%)
Place of birth for the foreign-born population - Guyana (%)
Place of birth for the foreign-born population - Peru (%)
Place of birth for the foreign-born population - Uruguay (%)
Place of birth for the foreign-born population - Venezuela (%)
Place of birth for the foreign-born population - Other South America (%)
Place of birth for the foreign-born population - Canada (%)
Place of birth for the foreign-born population - Other Northern America (%)
Place of birth for the foreign-born population - Other (%)
Latest news about races in Lakeland, TN collected exclusively by city-data.com from local newspapers, TV, and radio stations
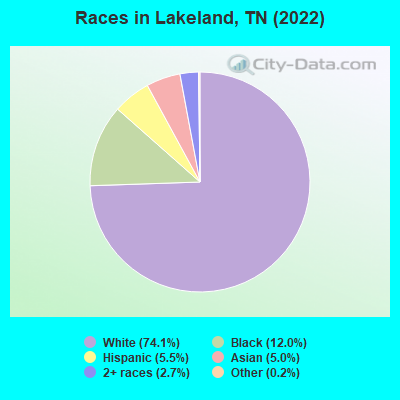
According to 2022 data, the most numerous races in Lakeland, TN are White alone (10,122 residents), Black alone (1,636 residents), and Hispanic (746 residents). 87.8% of Lakeland residents speak English at home. 9.4% of Lakeland, TN residents are foreign-born (2.6% born in Europe, 2.3% born in Africa, 1.9% born in Asia, 1.5% born in Latin America), which is 46.6% greater than the foreign-born rate of 5.0% across the entire state of Tennessee.
Race distribution in Lakeland
2000 2022
4,505,930 79.2% White alone 928,204 16.3% Black alone 123,838 2.2% Hispanic 54,824 1.0% Two or more races 56,077 1.0% Asian alone 13,820 0.2% American Indian alone 4,780 0.08% Other race alone 1,810 0.03% Native Hawaiian and Other
5,070,026 71.9% White alone 1,089,738 15.5% Black alone 442,629 6.3% Hispanic 279,381 4.0% Two or more races 131,817 1.9% Asian alone 26,972 0.4% Other race alone 6,387 0.09% American Indian alone 4,389 0.06% Native Hawaiian and Other
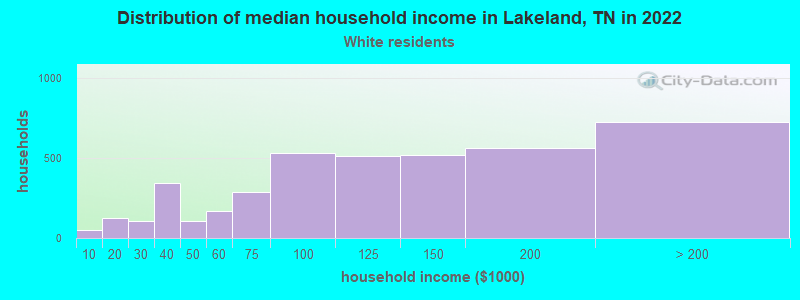
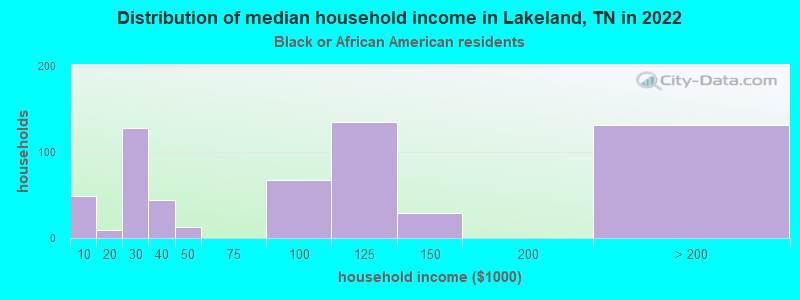
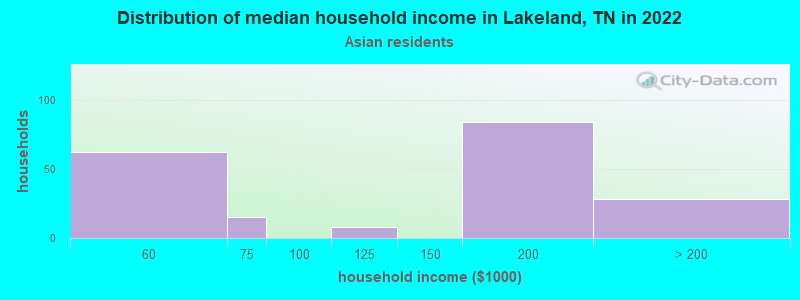
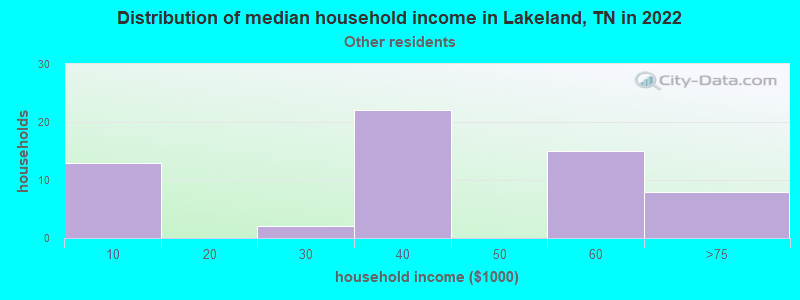
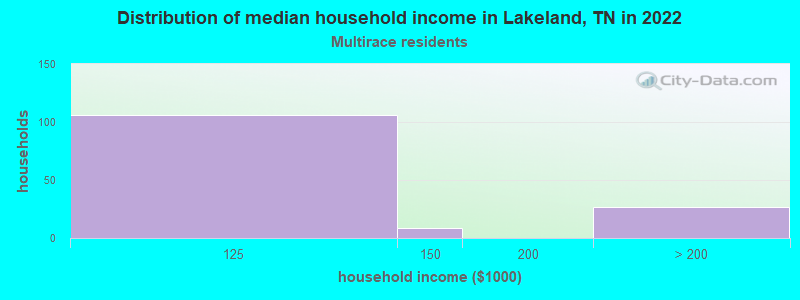
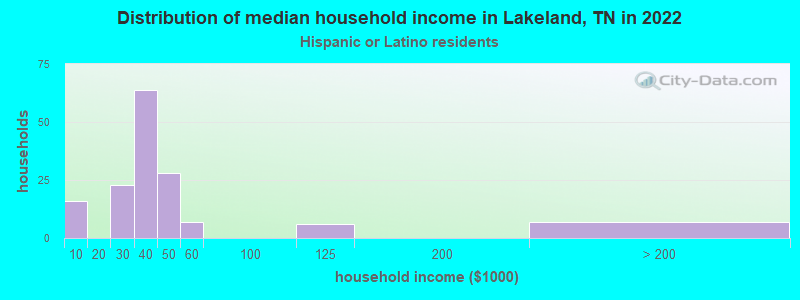
Income and house value in Lakeland Median household income in 2022 $109,886 White non-Hispanic householders$93,298 Black householders$154,437 Asian householders$134,558 Two or more races householders$44,271 Hispanic or Latino race householdersMedian 2022 house value $435,736 White Non-Hispanic householders$381,416 Black or African American householders$132,846 American Indian or Alaska Native householders $382,893 Asian householders
Median age by race in Lakeland
43.8 Median age for White residents41.4 47.9 38.1 Median age for Black or African American residents39.9 37.4 -1,525,641,024.1 Median age for American Indian / Alaska Native residents-1,325,757,574.4 -801,477,376.9 44.3 Median age for Asian residents49.2 43.2 -480,757,844.4 Median age for Native Hawaiian / Pacific Islander residents-951,707,890.7 -671,105,192.4 24.4 Median age for Other race residents18.8 29.7 25.3 Median age for Two or more races residents31.1 24.6 43.8 Median age for White alone residents41.8 46.5 18.6 Median age for Hispanic or Latino residents16.1 45.4
Owner/renter occupied households by race in Lakeland
House owners and renters - White residents 3,378 84.5% Owner occupied618 15.5% Renter occupiedHouse owners and renters - Black or African American residents 383 55.2% Owner occupied310 44.8% Renter occupiedHouse owners and renters - Asian residents 227 100.0% Owner occupiedHouse owners and renters - Other race residents 24 37.1% Owner occupied40 62.9% Renter occupiedHouse owners and renters - Two or more races residents 119 90.1% Owner occupied13 9.9% Renter occupiedHouse owners and renters - White alone residents 3,382 84.8% Owner occupied607 15.2% Renter occupiedHouse owners and renters - Hispanic or Latino residents 66 46.6% Owner occupied75 53.4% Renter occupied
Language usage in Lakeland
English speakers - Total 87.8% of residents of Lakeland speak English at home.
4.1% of residents speak Spanish at home 345 65.6% Speak English very well181 34.4% Speak English less than very well8.0% of residents speak other language at home 844 82.4% Speak English very well180 17.6% Speak English less than very well
English speakers - Born in the United States 97.7% of residents of Lakeland speak English at home.
0.7% of residents speak Spanish at home 27 77.1% Speak English very well8 22.9% Speak English less than very well1.4% of residents speak other language at home 66 100.0% Speak English very well
English speakers - Native, born elsewhere 60.1% of residents of Lakeland speak English at home.
50.8% of residents speak Spanish at home 98 100.0% Speak English very well
English speakers - Foreign-born 22.4% of residents of Lakeland speak English at home.
16.3% of residents speak Spanish at home 64 30.8% Speak English very well144 69.2% Speak English less than very well58.7% of residents speak other language at home 584 77.9% Speak English very well166 22.1% Speak English less than very well
White (Caucasian) - Speak only English Native:
96.3% (9,039)Foreign-born:
22.5% (79)
White (Caucasian) - Speak another language Native:
3.4% (319)Foreign-born:
77.8% (274)
Black or African American - Speak only English Native:
99.9% (1,100)Foreign-born:
42.7% (116)
Asian - Speak only English Native:
84.0% (278)Foreign-born:
16.5% (59)
Asian - Speak another language Native:
22.1% (73)Foreign-born:
83.1% (295)
Other race - Speak another language Native:
47.2% (36)Foreign-born:
100.0% (81)
Two or more races - Speak another language Native:
8.0% (32)Foreign-born:
92.7% (19)
White alone - Speak only English Native:
97.0% (8,993)Foreign-born:
23.0% (70)
White alone - Speak another language Native:
3.1% (284)Foreign-born:
82.1% (251)
Hispanic or Latino - Speak only English Native:
39.6% (153)Foreign-born:
5.6% (13)
Hispanic or Latino - Speak another language Native:
60.4% (233)Foreign-born:
94.1% (214)
Foreign-born residents in Lakeland 1,278 residents are foreign born (2.6% Europe , 2.3% Africa , 1.9% Asia , 1.5% Latin America ).
This city:
9.4%Tennessee:
5.4%
Marital status for residents in Lakeland Marital status - White (Caucasian) population 15 years and over
Males 23.5% Never married66.1% Now married0.3% Separated1.4% Widowed8.6% DivorcedFemales 18.3% Never married61.0% Now married0.9% Separated6.8% Widowed13.0% DivorcedWomen who gave birth in the past 12 months Now married:
100.0% (81)Unmarried:
0.0% (0)
Women who did not give birth in the past 12 months Now married:
56.8% (1,120)Unmarried:
43.2% (853)
Marital status - Black or African American population 15 years and over
Males 24.9% Never married34.1% Now married3.1% Separated21.1% Widowed16.8% DivorcedFemales 23.3% Never married76.7% Now married0.0% Separated0.0% Widowed0.0% DivorcedWomen who did not give birth in the past 12 months Now married:
67.1% (146)Unmarried:
32.9% (72)
Marital status - Asian population 15 years and over
Males 27.4% Never married66.5% Now married0.0% Separated6.1% Widowed0.0% DivorcedFemales 11.7% Never married44.9% Now married0.0% Separated13.0% Widowed30.4% DivorcedWomen who gave birth in the past 12 months Now married:
100.0% (23)Unmarried:
0.0% (0)
Women who did not give birth in the past 12 months Now married:
33.9% (39)Unmarried:
66.1% (76)
Marital status - Other race population 15 years and over
Males 43.9% Never married24.6% Now married0.0% Separated0.0% Widowed31.6% DivorcedFemales 45.6% Never married28.1% Now married0.0% Separated19.3% Widowed7.0% DivorcedWomen who did not give birth in the past 12 months Now married:
28.1% (22)Unmarried:
71.9% (57)
Marital status - Two or more races population 15 years and over
Males 25.7% Never married74.3% Now married0.0% Separated0.0% Widowed0.0% DivorcedFemales 16.3% Never married79.7% Now married0.0% Separated3.9% Widowed0.0% DivorcedWomen who did not give birth in the past 12 months Now married:
77.1% (101)Unmarried:
22.9% (30)
Marital status - White alone, not Hispanic / Latino population 15 years and over
Males 21.4% Never married68.1% Now married0.0% Separated1.5% Widowed9.0% DivorcedFemales 18.4% Never married60.6% Now married0.9% Separated7.0% Widowed13.1% DivorcedWomen who gave birth in the past 12 months Now married:
100.0% (85)Unmarried:
0.0% (0)
Women who did not give birth in the past 12 months Now married:
55.8% (1,080)Unmarried:
44.2% (856)
Marital status - Hispanic or Latino population 15 years and over
Males 64.7% Never married22.0% Now married5.8% Separated0.0% Widowed7.5% DivorcedFemales 29.8% Never married53.0% Now married0.0% Separated8.6% Widowed8.6% DivorcedWomen who did not give birth in the past 12 months Now married:
50.6% (95)Unmarried:
49.4% (93)
Ancestries in Lakeland
1,509 17.8% American1,119 13.2% English587 6.9% German505 6.0% Irish471 5.6% European305 3.6% Italian255 3.0% Scottish142 1.7% Scotch-Irish130 1.5% Polish85 1.0% Kenyan65 0.8% Yugoslavian63 0.7% French53 0.6% Dutch40 0.5% Ukrainian38 0.4% Ghanaian34 0.4% African29 0.3% French Canadian27 0.3% Welsh20 0.2% Swedish19 0.2% Greek12 0.1% Eastern European11 0.1% Slovak10 0.1% Austrian10 0.1% Hungarian10 0.1% Russian9 0.1% Czech
Children Nativity (place of birth) in Lakeland
Children under 6 years - Living with two parents Both parents native 493 100.0% NativeBoth parents foreign-born 126 100.0% NativeOne native, one foreign-born parent 28 100.0% NativeChildren under 6 years - Living with one parent Native parent 306 100.0% NativeForeign-born parent 27 100.0% NativeChildren 6 to 17 years - Living with two parents Both parents native 1,207 100.0% NativeBoth parents foreign-born 517 100.0% NativeOne native, one foreign-born parent 176 100.0% NativeChildren 6 to 17 years - Living with one parent Native parent 470 100.0% NativeForeign-born parent 194 48.3% Native208 51.7% Foreign-born
Grandparents responsible for own grandchildren in Lakeland
Grandparents (30 to 59 years) White / Caucasian 11 100.0% Not responsible for grandchildrenWhite alone, not Hispanic / Latino 9 100.0% Not responsible for grandchildren
Grandparents (60 years and over) White / Caucasian 27 100.0% Not responsible for grandchildrenWhite alone, not Hispanic / Latino 27 100.0% Not responsible for grandchildren