Races in Lanham-Seabrook, Maryland (MD) Detailed Stats
Ancestries, Foreign-born residents, place of birth

Recent posts about races in Lanham-Seabrook, Maryland on our local forum with over 2,400,000 registered users:

17.3% of Lanham-Seabrook, MD residents are foreign-born (6.6% born in Latin America, 5.6% born in Africa, 3.8% born in Asia), which is 7.6% greater than the foreign-born rate of 16.0% across the entire state of Maryland.
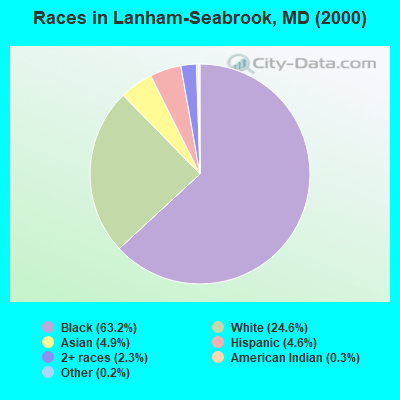
Race distribution in Lanham-Seabrook

- 11,49163.2%Black alone
- 4,47824.6%White alone
- 8904.9%Asian alone
- 8414.6%Hispanic
- 4152.3%Two or more races
- 470.3%American Indian alone
- 280.2%Other race alone
2000
2022
-
- 3,286,54762.1%White alone
- 1,464,73527.7%Black alone
- 227,9164.3%Hispanic
- 209,7384.0%Asian alone
- 82,9461.6%Two or more races
- 13,3120.3%American Indian alone
- 9,3790.2%Other race alone
- 1,9130.04%Native Hawaiian and Other
Pacific Islander alone

-
- 2,906,49247.1%White alone
- 1,800,91429.2%Black alone
- 705,84211.4%Hispanic
- 401,8186.5%Asian alone
- 291,3174.7%Two or more races
- 46,9300.8%Other race alone
- 8,9300.1%American Indian alone
- 2,4170.04%Native Hawaiian and Other
Pacific Islander alone

Income and house value in Lanham-Seabrook
- Median household income in 2022
- $111,600White non-Hispanic householders
- $114,847Black householders
- $99,126American Indian and Alaska Native householders
- $161,122Asian householders
- $88,013Some other race householders
- $67,257Two or more races householders
- $89,482Hispanic or Latino race householders
- Median 2022 house value
- $400,794White Non-Hispanic householders
- $427,666Black or African American householders
- $409,370American Indian or Alaska Native householders
- $470,261Asian householders
- $321,607Native Hawaiian and other Pacific Islander householders
- $404,510Some other race householders
- $328,754Two or more races householders
- $403,081Hispanic or Latino householders
Household income for White non-Hispanic householders

Household income for Black householders

Household income for American Indian and Alaska Native householders

Household income for Asian householders

Household income for Native Hawaiian and other Pacific Islander householders

Household income for Two or more races householders

Household income for Hispanic or Latino race householders

Foreign-born residents in Lanham-Seabrook
3,150 residents are foreign born (6.6% Latin America, 5.6% Africa, 3.8% Asia).
| This city: | 17.3% |
| Maryland: | 9.8% |
Ancestries in Lanham-Seabrook

- 10,79059.8%Other
- 1,6058.9%Subsaharan African
- 9675.4%Irish
- 9315.2%German
- 7013.9%West Indian
- 6033.3%English
- 5643.1%Italian
- 5182.9%United States
- 2091.2%Polish
- 2061.1%French
- 1230.7%Russian
- 1170.6%Hungarian
- 1010.6%Scottish
- 1000.6%Scotch-Irish
- 810.4%French Canadian
- 620.3%Dutch
- 580.3%Greek
- 530.3%Czech
- 490.3%Ukrainian
- 380.2%Slovak
- 360.2%Norwegian
- 360.2%Welsh
- 310.2%Swedish
- 260.1%Arab
- 190.1%Portuguese
- 140.08%Danish
- 120.07%Swiss
- 80.04%Lithuanian

Zip codes: 20706.