Races in Lansing, Michigan (MI) Detailed Stats
Data:
Races - White alone (%)
Races - White alone (% change since 2000)
Races - Black alone (%)
Races - Black alone (% change since 2000)
Races - American Indian alone (%)
Races - American Indian alone (% change since 2000)
Races - Asian alone (%)
Races - Asian alone (% change since 2000)
Races - Hispanic (%)
Races - Hispanic (% change since 2000)
Races - Native Hawaiian and Other Pacific Islander alone (%)
Races - Native Hawaiian and Other Pacific Islander alone (% change since 2000)
Races - Two or more races(%)
Races - Two or more races(% change since 2000)
Races - Other race alone (%)
Races - Other race alone (% change since 2000)
Racial diversity
Place of birth - Born in state of residence (%)
Place of birth - Born in state of residence (%) - White
Place of birth - Born in state of residence (%) - Black or African American
Place of birth - Born in state of residence (%) - Asian
Place of birth - Born in state of residence (%) - Hispanic or Latino
Place of birth - Born in state of residence (%) - American Indian and Alaska Native
Place of birth - Born in state of residence (%) - Multirace
Place of birth - Born in state of residence (%) - Other Race
Place of birth - Born in other state (%)
Place of birth - Born in other state (%) - White
Place of birth - Born in other state (%) - Black or African American
Place of birth - Born in other state (%) - Asian
Place of birth - Born in other state (%) - Hispanic or Latino
Place of birth - Born in other state (%) - American Indian and Alaska Native
Place of birth - Born in other state (%) - Multirace
Place of birth - Born in other state (%) - Other Race
Place of birth - Native, outside of US (%)
Place of birth - Native, outside of US (%) - White
Place of birth - Native, outside of US (%) - Black or African American
Place of birth - Native, outside of US (%) - Asian
Place of birth - Native, outside of US (%) - Hispanic or Latino
Place of birth - Native, outside of US (%) - American Indian and Alaska Native
Place of birth - Native, outside of US (%) - Multirace
Place of birth - Native, outside of US (%) - Other Race
Place of birth - Foreign born (%)
Place of birth - Foreign born (%) - White
Place of birth - Foreign born (%) - Black or African American
Place of birth - Foreign born (%) - Asian
Place of birth - Foreign born (%) - Hispanic or Latino
Place of birth - Foreign born (%) - American Indian and Alaska Native
Place of birth - Foreign born (%) - Multirace
Place of birth - Foreign born (%) - Other Race
Residents speaking English at home (%)
Residents speaking English at home - Born in the United States (%)
Residents speaking English at home - Native, born elsewhere (%)
Residents speaking English at home - Foreign born (%)
Residents speaking Spanish at home (%)
Residents speaking Spanish at home - Born in the United States (%)
Residents speaking Spanish at home - Native, born elsewhere (%)
Residents speaking Spanish at home - Foreign born (%)
Residents speaking other language at home (%)
Residents speaking other language at home - Born in the United States (%)
Residents speaking other language at home - Native, born elsewhere (%)
Residents speaking other language at home - Foreign born (%)
Marital status - Never married (%)
Marital status - Now married (%)
Marital status - Separated (%)
Marital status - Widowed (%)
Marital status - Divorced (%)
Ancestries Reported - Arab (%)
Ancestries Reported - Czech (%)
Ancestries Reported - Danish (%)
Ancestries Reported - Dutch (%)
Ancestries Reported - English (%)
Ancestries Reported - French (%)
Ancestries Reported - French Canadian (%)
Ancestries Reported - German (%)
Ancestries Reported - Greek (%)
Ancestries Reported - Hungarian (%)
Ancestries Reported - Irish (%)
Ancestries Reported - Italian (%)
Ancestries Reported - Lithuanian (%)
Ancestries Reported - Norwegian (%)
Ancestries Reported - Polish (%)
Ancestries Reported - Portuguese (%)
Ancestries Reported - Russian (%)
Ancestries Reported - Scotch-Irish (%)
Ancestries Reported - Scottish (%)
Ancestries Reported - Slovak (%)
Ancestries Reported - Subsaharan African (%)
Ancestries Reported - Swedish (%)
Ancestries Reported - Swiss (%)
Ancestries Reported - Ukrainian (%)
Ancestries Reported - United States (%)
Ancestries Reported - Welsh (%)
Ancestries Reported - West Indian (%)
Ancestries Reported - Other (%)
Geographical mobility - Same house 1 year ago (%)
Geographical mobility - Same house 1 year ago (%) - White
Geographical mobility - Same house 1 year ago (%) - Black or African American
Geographical mobility - Same house 1 year ago (%) - Asian
Geographical mobility - Same house 1 year ago (%) - Hispanic or Latino
Geographical mobility - Same house 1 year ago (%) - American Indian and Alaska Native
Geographical mobility - Same house 1 year ago (%) - Multirace
Geographical mobility - Same house 1 year ago (%) - Other Race
Geographical mobility - Moved within same county (%)
Geographical mobility - Moved within same county (%) - White
Geographical mobility - Moved within same county (%) - Black or African American
Geographical mobility - Moved within same county (%) - Asian
Geographical mobility - Moved within same county (%) - Hispanic or Latino
Geographical mobility - Moved within same county (%) - American Indian and Alaska Native
Geographical mobility - Moved within same county (%) - Multirace
Geographical mobility - Moved within same county (%) - Other Race
Geographical mobility - Moved from different county within same state (%)
Geographical mobility - Moved from different county within same state (%) - White
Geographical mobility - Moved from different county within same state (%) - Black or African American
Geographical mobility - Moved from different county within same state (%) - Asian
Geographical mobility - Moved from different county within same state (%) - Hispanic or Latino
Geographical mobility - Moved from different county within same state (%) - American Indian and Alaska Native
Geographical mobility - Moved from different county within same state (%) - Multirace
Geographical mobility - Moved from different county within same state (%) - Other Race
Geographical mobility - Moved from different state (%)
Geographical mobility - Moved from different state (%) - White
Geographical mobility - Moved from different state (%) - Black or African American
Geographical mobility - Moved from different state (%) - Asian
Geographical mobility - Moved from different state (%) - Hispanic or Latino
Geographical mobility - Moved from different state (%) - American Indian and Alaska Native
Geographical mobility - Moved from different state (%) - Multirace
Geographical mobility - Moved from different state (%) - Other Race
Geographical mobility - Moved from abroad (%)
Geographical mobility - Moved from abroad (%) - White
Geographical mobility - Moved from abroad (%) - Black or African American
Geographical mobility - Moved from abroad (%) - Asian
Geographical mobility - Moved from abroad (%) - Hispanic or Latino
Geographical mobility - Moved from abroad (%) - American Indian and Alaska Native
Geographical mobility - Moved from abroad (%) - Multirace
Geographical mobility - Moved from abroad (%) - Other Race
Place of birth for the foreign-born population - Ireland (%)
Place of birth for the foreign-born population - Denmark (%)
Place of birth for the foreign-born population - Norway (%)
Place of birth for the foreign-born population - Sweden (%)
Place of birth for the foreign-born population - United Kingdom (%)
Place of birth for the foreign-born population - England (%)
Place of birth for the foreign-born population - Scotland (%)
Place of birth for the foreign-born population - Other Northern Europe (%)
Place of birth for the foreign-born population - Austria (%)
Place of birth for the foreign-born population - Belgium (%)
Place of birth for the foreign-born population - France (%)
Place of birth for the foreign-born population - Germany (%)
Place of birth for the foreign-born population - Netherlands (%)
Place of birth for the foreign-born population - Switzerland (%)
Place of birth for the foreign-born population - Other Western Europe (%)
Place of birth for the foreign-born population - Greece (%)
Place of birth for the foreign-born population - Italy (%)
Place of birth for the foreign-born population - Portugal (%)
Place of birth for the foreign-born population - Spain (%)
Place of birth for the foreign-born population - Other Southern Europe (%)
Place of birth for the foreign-born population - Albania (%)
Place of birth for the foreign-born population - Belarus (%)
Place of birth for the foreign-born population - Bosnia and Herzegovina (%)
Place of birth for the foreign-born population - Bulgaria (%)
Place of birth for the foreign-born population - Croatia (%)
Place of birth for the foreign-born population - Czechoslovakia (%)
Place of birth for the foreign-born population - Hungary (%)
Place of birth for the foreign-born population - Latvia (%)
Place of birth for the foreign-born population - Lithuania (%)
Place of birth for the foreign-born population - North Macedonia (Macedonia) (%)
Place of birth for the foreign-born population - Moldova (%)
Place of birth for the foreign-born population - Poland (%)
Place of birth for the foreign-born population - Romania (%)
Place of birth for the foreign-born population - Russia (%)
Place of birth for the foreign-born population - Serbia (%)
Place of birth for the foreign-born population - Ukraine (%)
Place of birth for the foreign-born population - Other Eastern Europe (%)
Place of birth for the foreign-born population - China (%)
Place of birth for the foreign-born population - Hong Kong (%)
Place of birth for the foreign-born population - Taiwan (%)
Place of birth for the foreign-born population - Japan (%)
Place of birth for the foreign-born population - Korea (%)
Place of birth for the foreign-born population - Other Eastern Asia (%)
Place of birth for the foreign-born population - Afghanistan (%)
Place of birth for the foreign-born population - Bangladesh (%)
Place of birth for the foreign-born population - India (%)
Place of birth for the foreign-born population - Iran (%)
Place of birth for the foreign-born population - Kazakhstan (%)
Place of birth for the foreign-born population - Nepal (%)
Place of birth for the foreign-born population - Pakistan (%)
Place of birth for the foreign-born population - Sri Lanka (%)
Place of birth for the foreign-born population - Uzbekistan (%)
Place of birth for the foreign-born population - Other South Central Asia (%)
Place of birth for the foreign-born population - Burma (%)
Place of birth for the foreign-born population - Cambodia (%)
Place of birth for the foreign-born population - Indonesia (%)
Place of birth for the foreign-born population - Laos (%)
Place of birth for the foreign-born population - Malaysia (%)
Place of birth for the foreign-born population - Philippines (%)
Place of birth for the foreign-born population - Singapore (%)
Place of birth for the foreign-born population - Thailand (%)
Place of birth for the foreign-born population - Vietnam (%)
Place of birth for the foreign-born population - Other South Eastern Asia (%)
Place of birth for the foreign-born population - Armenia (%)
Place of birth for the foreign-born population - Iraq (%)
Place of birth for the foreign-born population - Israel (%)
Place of birth for the foreign-born population - Jordan (%)
Place of birth for the foreign-born population - Kuwait (%)
Place of birth for the foreign-born population - Lebanon (%)
Place of birth for the foreign-born population - Saudi Arabia (%)
Place of birth for the foreign-born population - Syria (%)
Place of birth for the foreign-born population - Turkey (%)
Place of birth for the foreign-born population - Yemen (%)
Place of birth for the foreign-born population - Other Western Asia (%)
Place of birth for the foreign-born population - Eritrea (%)
Place of birth for the foreign-born population - Ethiopia (%)
Place of birth for the foreign-born population - Kenya (%)
Place of birth for the foreign-born population - Somalia (%)
Place of birth for the foreign-born population - Uganda (%)
Place of birth for the foreign-born population - Zimbabwe (%)
Place of birth for the foreign-born population - Other Eastern Africa (%)
Place of birth for the foreign-born population - Cameroon (%)
Place of birth for the foreign-born population - Congo (%)
Place of birth for the foreign-born population - Democratic Republic of Congo (Zaire) (%)
Place of birth for the foreign-born population - Other Middle Africa (%)
Place of birth for the foreign-born population - Egypt (%)
Place of birth for the foreign-born population - Morocco (%)
Place of birth for the foreign-born population - Sudan (%)
Place of birth for the foreign-born population - Other Northern Africa (%)
Place of birth for the foreign-born population - South Africa (%)
Place of birth for the foreign-born population - Other Southern Africa (%)
Place of birth for the foreign-born population - Cabo Verde (%)
Place of birth for the foreign-born population - Ghana (%)
Place of birth for the foreign-born population - Liberia (%)
Place of birth for the foreign-born population - Nigeria (%)
Place of birth for the foreign-born population - Senegal (%)
Place of birth for the foreign-born population - Sierra Leone (%)
Place of birth for the foreign-born population - Other Western Africa (%)
Place of birth for the foreign-born population - Australia (%)
Place of birth for the foreign-born population - New Zealand (%)
Place of birth for the foreign-born population - Fiji (%)
Place of birth for the foreign-born population - Micronesia (%)
Place of birth for the foreign-born population - Bahamas (%)
Place of birth for the foreign-born population - Barbados (%)
Place of birth for the foreign-born population - Cuba (%)
Place of birth for the foreign-born population - Dominica (%)
Place of birth for the foreign-born population - Dominican Republic (%)
Place of birth for the foreign-born population - Grenada (%)
Place of birth for the foreign-born population - Haiti (%)
Place of birth for the foreign-born population - Jamaica (%)
Place of birth for the foreign-born population - St. Vincent and the Grenadines (%)
Place of birth for the foreign-born population - Trinidad and Tobago (%)
Place of birth for the foreign-born population - West Indies (%)
Place of birth for the foreign-born population - Other Caribbean (%)
Place of birth for the foreign-born population - Belize (%)
Place of birth for the foreign-born population - Costa Rica (%)
Place of birth for the foreign-born population - El Salvador (%)
Place of birth for the foreign-born population - Guatemala (%)
Place of birth for the foreign-born population - Honduras (%)
Place of birth for the foreign-born population - Mexico (%)
Place of birth for the foreign-born population - Nicaragua (%)
Place of birth for the foreign-born population - Panama (%)
Place of birth for the foreign-born population - Other Central America (%)
Place of birth for the foreign-born population - Argentina (%)
Place of birth for the foreign-born population - Bolivia (%)
Place of birth for the foreign-born population - Brazil (%)
Place of birth for the foreign-born population - Chile (%)
Place of birth for the foreign-born population - Colombia (%)
Place of birth for the foreign-born population - Ecuador (%)
Place of birth for the foreign-born population - Guyana (%)
Place of birth for the foreign-born population - Peru (%)
Place of birth for the foreign-born population - Uruguay (%)
Place of birth for the foreign-born population - Venezuela (%)
Place of birth for the foreign-born population - Other South America (%)
Place of birth for the foreign-born population - Canada (%)
Place of birth for the foreign-born population - Other Northern America (%)
Place of birth for the foreign-born population - Other (%)
Latest news about races in Lansing, MI collected exclusively by city-data.com from local newspapers, TV, and radio stations
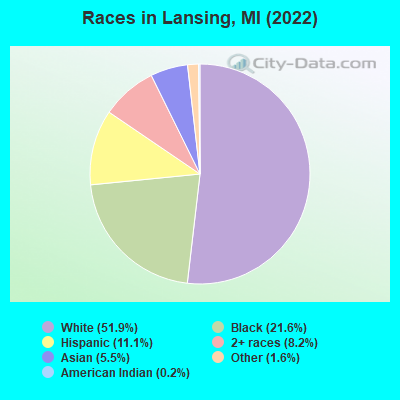
According to 2022 data, the most numerous races in Lansing, MI are White alone (58,609 residents), Black alone (24,372 residents), and Hispanic (12,529 residents). 86.7% of Lansing residents speak English at home. 9.8% of Lansing, MI residents are foreign-born (4.1% born in Asia, 2.6% born in Latin America, 2.3% born in Africa), which is 38.7% greater than the foreign-born rate of 6.0% across the entire state of Michigan.
Race distribution in Lansing
2000 2022
73,105 61.4% White alone 25,498 21.4% Black alone 11,886 10.0% Hispanic 4,177 3.5% Two or more races 3,317 2.8% Asian alone 831 0.7% American Indian alone 270 0.2% Other race alone 44 0.04% Native Hawaiian and Other
58,609 51.9% White alone 24,372 21.6% Black alone 12,529 11.1% Hispanic 9,228 8.2% Two or more races 6,261 5.5% Asian alone 1,785 1.6% Other race alone 179 0.2% American Indian alone
2000 2022
7,806,691 78.6% White alone 1,402,047 14.1% Black alone 323,877 3.3% Hispanic 175,311 1.8% Asian alone 163,487 1.6% Two or more races 53,421 0.5% American Indian alone 11,465 0.1% Other race alone 2,145 0.02% Native Hawaiian and Other
7,289,051 72.6% White alone 1,310,464 13.1% Black alone 572,405 5.7% Hispanic 450,031 4.5% Two or more races 335,732 3.3% Asian alone 45,217 0.5% Other race alone 29,011 0.3% American Indian alone 2,207 0.02% Native Hawaiian and Other
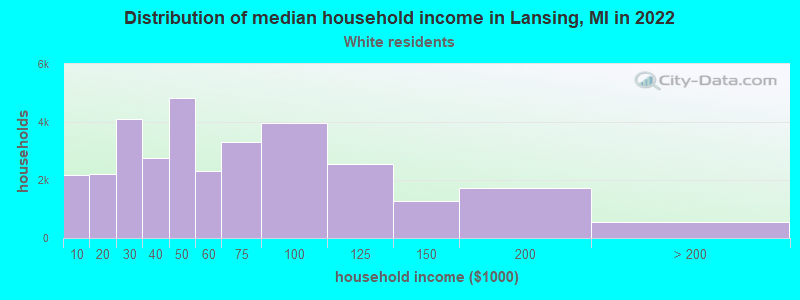
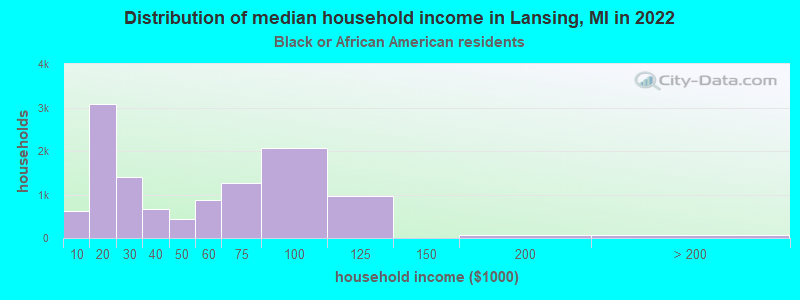
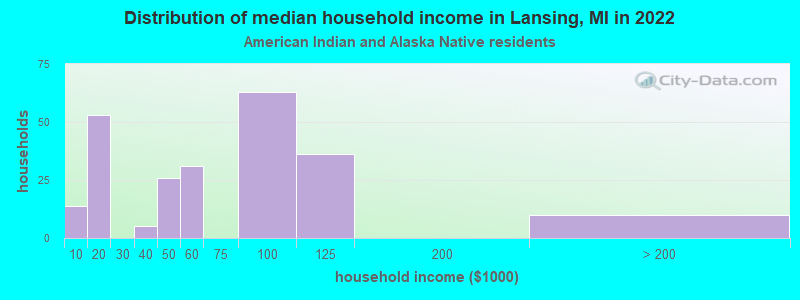
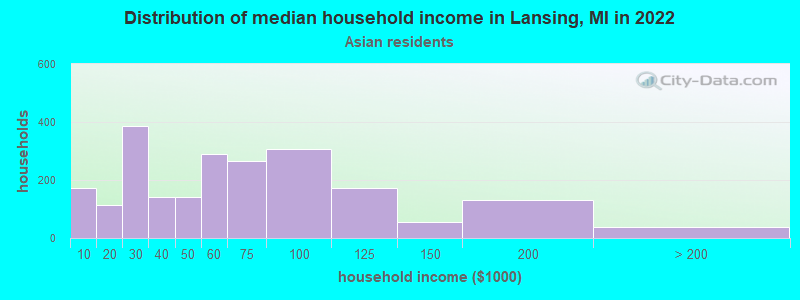
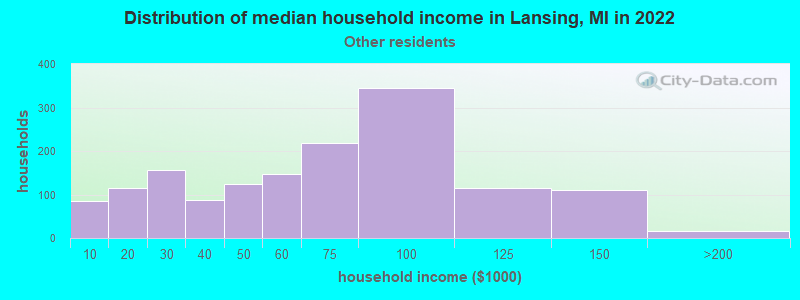
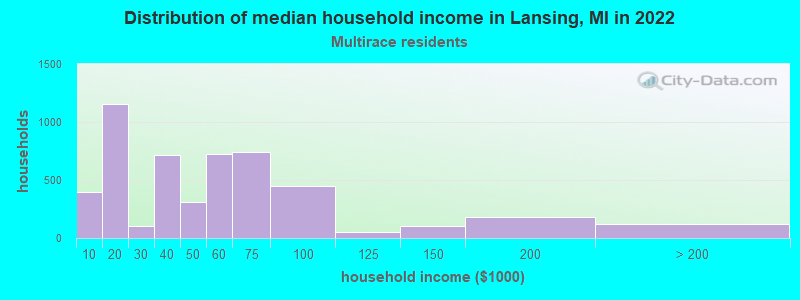
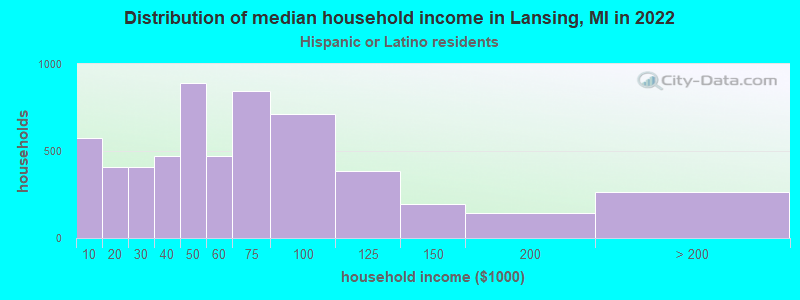
Income and house value in Lansing Median household income in 2022 $50,267 White non-Hispanic householders$39,990 Black householders$52,397 Asian householders$51,001 Some other race householders$45,784 Two or more races householders$51,037 Hispanic or Latino race householdersMedian 2022 house value $122,903 White Non-Hispanic householders$130,280 Black or African American householders$125,585 American Indian or Alaska Native householders $157,443 Asian householders$230,547 Native Hawaiian and other Pacific Islander householders$111,836 Some other race householders$114,184 Two or more races householders$109,656 Hispanic or Latino householders
Median age by race in Lansing
36.2 Median age for White residents35.5 36.7 37.2 Median age for Black or African American residents32.9 44.2 -666,666,666.0 Median age for American Indian / Alaska Native residents-666,666,666.0 -666,666,666.0 27.2 Median age for Asian residents27.7 26.4 -666,666,666.0 Median age for Native Hawaiian / Pacific Islander residents-666,666,666.0 -666,666,666.0 31.1 Median age for Other race residents32.2 30.7 24.0 Median age for Two or more races residents25.5 22.2 36.6 Median age for White alone residents36.6 36.6 30.9 Median age for Hispanic or Latino residents30.8 30.9
Owner/renter occupied households by race in Lansing
House owners and renters - White residents 19,704 62.1% Owner occupied12,008 37.9% Renter occupiedHouse owners and renters - Black or African American residents 4,752 41.1% Owner occupied6,819 58.9% Renter occupiedHouse owners and renters - American Indian / Alaska Native residents 129 50.9% Owner occupied124 49.1% Renter occupiedHouse owners and renters - Asian residents 1,290 55.3% Owner occupied1,042 44.7% Renter occupiedHouse owners and renters - Other race residents 1,167 49.9% Owner occupied1,172 50.1% Renter occupiedHouse owners and renters - Two or more races residents 3,036 60.6% Owner occupied1,978 39.4% Renter occupiedHouse owners and renters - White alone residents 19,188 63.3% Owner occupied11,123 36.7% Renter occupiedHouse owners and renters - Hispanic or Latino residents 3,122 54.2% Owner occupied2,642 45.8% Renter occupied
Language usage in Lansing
English speakers - Total 86.7% of residents of Lansing speak English at home.
5.0% of residents speak Spanish at home 4,105 78.2% Speak English very well1,143 21.8% Speak English less than very well8.3% of residents speak other language at home 5,337 61.5% Speak English very well3,336 38.5% Speak English less than very well
English speakers - Born in the United States 87.1% of residents of Lansing speak English at home.
11.0% of residents speak Spanish at home 1,780 78.0% Speak English very well503 22.0% Speak English less than very well1.8% of residents speak other language at home 383 100.0% Speak English very well
English speakers - Native, born elsewhere 40.7% of residents of Lansing speak English at home.
28.5% of residents speak Spanish at home 265 100.0% Speak English very well30.8% of residents speak other language at home 287 100.0% Speak English very well
English speakers - Foreign-born 15.5% of residents of Lansing speak English at home.
15.7% of residents speak Spanish at home 896 66.6% Speak English very well449 33.4% Speak English less than very well68.8% of residents speak other language at home 2,968 50.5% Speak English very well2,913 49.5% Speak English less than very well
White (Caucasian) - Speak only English Native:
98.2% (54,941)Foreign-born:
50.9% (575)
White (Caucasian) - Speak another language Native:
1.8% (1,000)Foreign-born:
49.1% (554)
Black or African American - Speak another language Native:
7.3% (1,670)Foreign-born:
100.0% (970)
American Indian / Alaska Native - Speak only English Native:
79.2% (349)Foreign-born:
91.6% (4)
Asian - Speak only English Native:
67.2% (536)Foreign-born:
2.5% (108)
Asian - Speak another language Native:
32.8% (262)Foreign-born:
97.5% (4,222)
Other race - Speak only English Native:
65.1% (2,789)Foreign-born:
20.8% (151)
Other race - Speak another language Native:
34.9% (1,497)Foreign-born:
78.0% (566)
Two or more races - Speak only English Native:
85.7% (10,425)Foreign-born:
27.4% (401)
Two or more races - Speak another language Native:
14.3% (1,745)Foreign-born:
72.6% (1,062)
White alone - Speak only English Native:
98.6% (53,234)Foreign-born:
48.9% (531)
White alone - Speak another language Native:
1.4% (746)Foreign-born:
51.1% (554)
Hispanic or Latino - Speak only English Native:
69.3% (6,859)Foreign-born:
29.7% (569)
Hispanic or Latino - Speak another language Native:
30.7% (3,039)Foreign-born:
70.3% (1,345)
Foreign-born residents in Lansing 11,122 residents are foreign born (4.1% Asia , 2.6% Latin America , 2.3% Africa ).
This city:
9.8%Michigan:
6.9%
Marital status for residents in Lansing Marital status - White (Caucasian) population 15 years and over
Males 42.8% Never married39.9% Now married1.1% Separated1.1% Widowed15.1% DivorcedFemales 38.6% Never married36.1% Now married2.4% Separated6.1% Widowed16.8% DivorcedWomen who gave birth in the past 12 months Now married:
68.6% (448)Unmarried:
31.4% (205)
Women who did not give birth in the past 12 months Now married:
31.7% (4,653)Unmarried:
68.3% (10,007)
Marital status - Black or African American population 15 years and over
Males 67.4% Never married16.4% Now married0.9% Separated2.5% Widowed12.7% DivorcedFemales 54.0% Never married18.3% Now married5.0% Separated9.7% Widowed13.0% DivorcedWomen who gave birth in the past 12 months Now married:
22.4% (47)Unmarried:
77.6% (164)
Women who did not give birth in the past 12 months Now married:
20.1% (1,207)Unmarried:
79.9% (4,796)
Marital status - American Indian / Alaska Native population 15 years and over
Males 28.6% Never married28.6% Now married0.0% Separated5.6% Widowed37.2% DivorcedFemales 23.4% Never married9.1% Now married16.2% Separated6.5% Widowed44.8% DivorcedWomen who did not give birth in the past 12 months Now married:
6.7% (4)Unmarried:
93.3% (58)
Marital status - Asian population 15 years and over
Males 51.5% Never married46.4% Now married0.0% Separated0.0% Widowed2.1% DivorcedFemales 41.7% Never married51.4% Now married1.9% Separated2.3% Widowed2.7% DivorcedWomen who gave birth in the past 12 months Now married:
100.0% (427)Unmarried:
0.0% (0)
Women who did not give birth in the past 12 months Now married:
47.2% (566)Unmarried:
52.8% (632)
Marital status - Other race population 15 years and over
Males 42.3% Never married33.0% Now married0.0% Separated0.0% Widowed24.7% DivorcedFemales 33.3% Never married27.1% Now married0.0% Separated12.0% Widowed27.6% DivorcedWomen who gave birth in the past 12 months Now married:
65.5% (45)Unmarried:
34.5% (24)
Women who did not give birth in the past 12 months Now married:
41.5% (305)Unmarried:
58.5% (430)
Marital status - Two or more races population 15 years and over
Males 58.6% Never married22.0% Now married2.8% Separated1.2% Widowed15.4% DivorcedFemales 54.5% Never married33.9% Now married0.0% Separated2.7% Widowed9.0% DivorcedWomen who gave birth in the past 12 months Now married:
23.8% (34)Unmarried:
76.2% (109)
Women who did not give birth in the past 12 months Now married:
32.2% (1,493)Unmarried:
67.8% (3,137)
Marital status - White alone, not Hispanic / Latino population 15 years and over
Males 40.8% Never married41.3% Now married1.2% Separated1.2% Widowed15.6% DivorcedFemales 38.4% Never married36.1% Now married2.5% Separated6.2% Widowed16.8% DivorcedWomen who gave birth in the past 12 months Now married:
66.3% (404)Unmarried:
33.7% (205)
Women who did not give birth in the past 12 months Now married:
32.5% (4,653)Unmarried:
67.5% (9,655)
Marital status - Hispanic or Latino population 15 years and over
Males 55.9% Never married27.0% Now married2.5% Separated0.0% Widowed14.6% DivorcedFemales 31.7% Never married43.0% Now married0.0% Separated7.5% Widowed17.8% DivorcedWomen who gave birth in the past 12 months Now married:
42.9% (100)Unmarried:
57.1% (133)
Women who did not give birth in the past 12 months Now married:
37.0% (1,310)Unmarried:
63.0% (2,227)
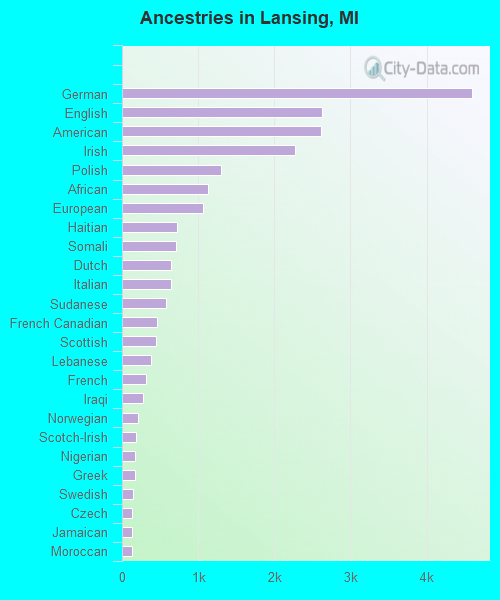
Ancestries in Lansing
4,589 9.0% German2,624 5.1% English2,611 5.1% American2,267 4.4% Irish1,301 2.5% Polish1,126 2.2% African1,061 2.1% European726 1.4% Haitian707 1.4% Somali645 1.3% Dutch644 1.3% Italian578 1.1% Sudanese458 0.9% French Canadian444 0.9% Scottish381 0.7% Lebanese311 0.6% French271 0.5% Iraqi215 0.4% Norwegian186 0.4% Scotch-Irish175 0.3% Nigerian165 0.3% Greek138 0.3% Swedish134 0.3% Czech130 0.3% Jamaican127 0.2% Moroccan119 0.2% Russian93 0.2% Danish80 0.2% Ugandan80 0.2% Welsh78 0.2% British68 0.1% Egyptian68 0.1% Romanian68 0.1% Iranian68 0.1% Scandinavian60 0.1% Hungarian57 0.1% Finnish51 0.10% Afghan51 0.10% Eastern European44 0.09% Ukrainian43 0.08% Northern European42 0.08% Belgian41 0.08% Arab36 0.07% Syrian34 0.07% Palestinian30 0.06% Canadian27 0.05% Ghanaian26 0.05% Lithuanian24 0.05% Liberian21 0.04% Armenian20 0.04% Czechoslovakian20 0.04% Brazilian17 0.03% Croatian16 0.03% Ethiopian14 0.03% Bulgarian14 0.03% Trinidadian and Tobagonian11 0.02% Yugoslavian10 0.02% Slovene10 0.02% Kenyan9 0.02% Pennsylvania German7 0.01% Macedonian7 0.01% Turkish6 0.01% Swiss6 0.01% Israeli5 0.01% Maltese4 0.01% Slovak
Geographical mobility in Lansing Same house 1 year ago 51,344 85.2% White (Caucasian)22,390 90.4% Black or African American426 91.4% American Indian / Alaska Native4,378 86.6% Asian3,501 87.9% Other race13,937 90.4% Two or more races50,254 86.4% White alone, not Hispanic / Latino10,312 82.5% Hispanic or LatinoMoved within same county 4,543 7.5% White / Caucasian1,507 6.1% Black or African American18 3.8% American Indian / Alaska Native289 5.7% Asian318 8.0% Other race752 4.9% Two or more races3,852 6.6% White alone, not Hispanic / Latino1,554 12.4% Hispanic or LatinoMoved within same state 3,606 6.0% White / Caucasian699 2.8% Black or African American20 4.4% American Indian / Alaska Native204 4.0% Asian129 3.2% Other race249 1.6% Two or more races3,420 5.9% White alone, not Hispanic / Latino332 2.7% Hispanic or LatinoMoved from different state 801 1.3% White / Caucasian161 0.7% Black or African American10 0.2% Asian28 0.7% Other race479 3.1% Two or more races663 1.1% White alone, not Hispanic / Latino296 2.4% Hispanic or LatinoMoved from abroad 109 2.2% Asian
Children Nativity (place of birth) in Lansing
Children under 6 years - Living with two parents Both parents native 2,731 100.0% NativeBoth parents foreign-born 706 85.5% Native120 14.5% Foreign-bornOne native, one foreign-born parent 231 100.0% NativeChildren under 6 years - Living with one parent Native parent 3,809 100.0% NativeForeign-born parent 548 84.9% Native97 15.1% Foreign-bornChildren 6 to 17 years - Living with two parents Both parents native 4,758 100.0% NativeBoth parents foreign-born 990 59.1% Native684 40.9% Foreign-bornOne native, one foreign-born parent 610 100.0% NativeChildren 6 to 17 years - Living with one parent Native parent 5,909 100.0% NativeForeign-born parent 993 58.9% Native693 41.1% Foreign-born
Place of birth for residents in Lansing 4,633 Asia3,210 Americas2,900 Latin America2,591 Africa1,891 South Central Asia1,393 Central America1,390 South Eastern Asia1,298 Caribbean1,170 Eastern Africa849 Eastern Asia703 Northern Africa680 Europe613 China489 Western Asia315 Western Africa313 Middle Africa310 Northern America286 Eastern Europe208 South America176 Western Europe165 Northern Europe53 Southern Europe7 Oceania1,253 Mexico746 Cuba699 India609 Nepal607 Sudan591 China495 Haiti473 Vietnam427 Somalia393 Burma (Myanmar)310 Canada303 Iraq248 Philippines236 Bhutan229 Korea202 Thailand157 Ghana138 Tanzania137 Lebanon124 Russia124 Kenya122 Democratic Republic of Congo (Zaire)109 Germany96 Morocco94 Uganda90 Pakistan83 Sri Lanka81 Iran81 Afghanistan75 Guatemala72 England70 United Kingdom67 Nigeria64 Romania57 Venezuela55 France54 Congo52 Liberia52 Honduras49 Colombia47 Laos42 Jamaica40 Ethiopia39 Spain39 Senegal37 Brazil34 Bosnia and Herzegovina33 Ecuador29 Ukraine27 Azerbaijan22 Hong Kong18 Indonesia15 Trinidad and Tobago14 Poland13 El Salvador13 Ireland13 Peru13 Uruguay12 Bangladesh12 Netherlands9 Israel7 Turkey7 Japan7 Italy7 Micronesia6 Argentina6 Armenia5 Singapore4 Belarus4 Cambodia
Grandparents responsible for own grandchildren in Lansing
Grandparents (30 to 59 years) White / Caucasian 439 71.3% Responsible for grandchildren177 28.7% Not responsible for grandchildrenBlack or African American 69 49.8% Responsible for grandchildren70 50.2% Not responsible for grandchildrenAmerican Indian / Alaska Native 6 100.0% Not responsible for grandchildrenAsian 195 100.0% Not responsible for grandchildrenOther race 7 100.0% Responsible for grandchildrenTwo or more races 10 49.4% Responsible for grandchildren10 50.6% Not responsible for grandchildrenWhite alone, not Hispanic / Latino 439 71.3% Responsible for grandchildren177 28.7% Not responsible for grandchildrenHispanic or Latino 4 100.0% Responsible for grandchildrenGrandparents (60 years and over) White / Caucasian 165 27.6% Responsible for grandchildren432 72.4% Not responsible for grandchildrenBlack or African American 58 37.9% Responsible for grandchildren94 62.1% Not responsible for grandchildrenAsian 204 84.5% Responsible for grandchildren37 15.5% Not responsible for grandchildrenOther race 69 100.0% Not responsible for grandchildrenTwo or more races 7 100.0% Not responsible for grandchildrenWhite alone, not Hispanic / Latino 165 27.6% Responsible for grandchildren432 72.4% Not responsible for grandchildrenHispanic or Latino 8 11.9% Responsible for grandchildren60 88.1% Not responsible for grandchildren