Races in Largo, Florida (FL) Detailed Stats
Data:
Races - White alone (%)
Races - White alone (% change since 2000)
Races - Black alone (%)
Races - Black alone (% change since 2000)
Races - American Indian alone (%)
Races - American Indian alone (% change since 2000)
Races - Asian alone (%)
Races - Asian alone (% change since 2000)
Races - Hispanic (%)
Races - Hispanic (% change since 2000)
Races - Native Hawaiian and Other Pacific Islander alone (%)
Races - Native Hawaiian and Other Pacific Islander alone (% change since 2000)
Races - Two or more races(%)
Races - Two or more races(% change since 2000)
Races - Other race alone (%)
Races - Other race alone (% change since 2000)
Racial diversity
Place of birth - Born in state of residence (%)
Place of birth - Born in state of residence (%) - White
Place of birth - Born in state of residence (%) - Black or African American
Place of birth - Born in state of residence (%) - Asian
Place of birth - Born in state of residence (%) - Hispanic or Latino
Place of birth - Born in state of residence (%) - American Indian and Alaska Native
Place of birth - Born in state of residence (%) - Multirace
Place of birth - Born in state of residence (%) - Other Race
Place of birth - Born in other state (%)
Place of birth - Born in other state (%) - White
Place of birth - Born in other state (%) - Black or African American
Place of birth - Born in other state (%) - Asian
Place of birth - Born in other state (%) - Hispanic or Latino
Place of birth - Born in other state (%) - American Indian and Alaska Native
Place of birth - Born in other state (%) - Multirace
Place of birth - Born in other state (%) - Other Race
Place of birth - Native, outside of US (%)
Place of birth - Native, outside of US (%) - White
Place of birth - Native, outside of US (%) - Black or African American
Place of birth - Native, outside of US (%) - Asian
Place of birth - Native, outside of US (%) - Hispanic or Latino
Place of birth - Native, outside of US (%) - American Indian and Alaska Native
Place of birth - Native, outside of US (%) - Multirace
Place of birth - Native, outside of US (%) - Other Race
Place of birth - Foreign born (%)
Place of birth - Foreign born (%) - White
Place of birth - Foreign born (%) - Black or African American
Place of birth - Foreign born (%) - Asian
Place of birth - Foreign born (%) - Hispanic or Latino
Place of birth - Foreign born (%) - American Indian and Alaska Native
Place of birth - Foreign born (%) - Multirace
Place of birth - Foreign born (%) - Other Race
Residents speaking English at home (%)
Residents speaking English at home - Born in the United States (%)
Residents speaking English at home - Native, born elsewhere (%)
Residents speaking English at home - Foreign born (%)
Residents speaking Spanish at home (%)
Residents speaking Spanish at home - Born in the United States (%)
Residents speaking Spanish at home - Native, born elsewhere (%)
Residents speaking Spanish at home - Foreign born (%)
Residents speaking other language at home (%)
Residents speaking other language at home - Born in the United States (%)
Residents speaking other language at home - Native, born elsewhere (%)
Residents speaking other language at home - Foreign born (%)
Marital status - Never married (%)
Marital status - Now married (%)
Marital status - Separated (%)
Marital status - Widowed (%)
Marital status - Divorced (%)
Ancestries Reported - Arab (%)
Ancestries Reported - Czech (%)
Ancestries Reported - Danish (%)
Ancestries Reported - Dutch (%)
Ancestries Reported - English (%)
Ancestries Reported - French (%)
Ancestries Reported - French Canadian (%)
Ancestries Reported - German (%)
Ancestries Reported - Greek (%)
Ancestries Reported - Hungarian (%)
Ancestries Reported - Irish (%)
Ancestries Reported - Italian (%)
Ancestries Reported - Lithuanian (%)
Ancestries Reported - Norwegian (%)
Ancestries Reported - Polish (%)
Ancestries Reported - Portuguese (%)
Ancestries Reported - Russian (%)
Ancestries Reported - Scotch-Irish (%)
Ancestries Reported - Scottish (%)
Ancestries Reported - Slovak (%)
Ancestries Reported - Subsaharan African (%)
Ancestries Reported - Swedish (%)
Ancestries Reported - Swiss (%)
Ancestries Reported - Ukrainian (%)
Ancestries Reported - United States (%)
Ancestries Reported - Welsh (%)
Ancestries Reported - West Indian (%)
Ancestries Reported - Other (%)
Geographical mobility - Same house 1 year ago (%)
Geographical mobility - Same house 1 year ago (%) - White
Geographical mobility - Same house 1 year ago (%) - Black or African American
Geographical mobility - Same house 1 year ago (%) - Asian
Geographical mobility - Same house 1 year ago (%) - Hispanic or Latino
Geographical mobility - Same house 1 year ago (%) - American Indian and Alaska Native
Geographical mobility - Same house 1 year ago (%) - Multirace
Geographical mobility - Same house 1 year ago (%) - Other Race
Geographical mobility - Moved within same county (%)
Geographical mobility - Moved within same county (%) - White
Geographical mobility - Moved within same county (%) - Black or African American
Geographical mobility - Moved within same county (%) - Asian
Geographical mobility - Moved within same county (%) - Hispanic or Latino
Geographical mobility - Moved within same county (%) - American Indian and Alaska Native
Geographical mobility - Moved within same county (%) - Multirace
Geographical mobility - Moved within same county (%) - Other Race
Geographical mobility - Moved from different county within same state (%)
Geographical mobility - Moved from different county within same state (%) - White
Geographical mobility - Moved from different county within same state (%) - Black or African American
Geographical mobility - Moved from different county within same state (%) - Asian
Geographical mobility - Moved from different county within same state (%) - Hispanic or Latino
Geographical mobility - Moved from different county within same state (%) - American Indian and Alaska Native
Geographical mobility - Moved from different county within same state (%) - Multirace
Geographical mobility - Moved from different county within same state (%) - Other Race
Geographical mobility - Moved from different state (%)
Geographical mobility - Moved from different state (%) - White
Geographical mobility - Moved from different state (%) - Black or African American
Geographical mobility - Moved from different state (%) - Asian
Geographical mobility - Moved from different state (%) - Hispanic or Latino
Geographical mobility - Moved from different state (%) - American Indian and Alaska Native
Geographical mobility - Moved from different state (%) - Multirace
Geographical mobility - Moved from different state (%) - Other Race
Geographical mobility - Moved from abroad (%)
Geographical mobility - Moved from abroad (%) - White
Geographical mobility - Moved from abroad (%) - Black or African American
Geographical mobility - Moved from abroad (%) - Asian
Geographical mobility - Moved from abroad (%) - Hispanic or Latino
Geographical mobility - Moved from abroad (%) - American Indian and Alaska Native
Geographical mobility - Moved from abroad (%) - Multirace
Geographical mobility - Moved from abroad (%) - Other Race
Place of birth for the foreign-born population - Ireland (%)
Place of birth for the foreign-born population - Denmark (%)
Place of birth for the foreign-born population - Norway (%)
Place of birth for the foreign-born population - Sweden (%)
Place of birth for the foreign-born population - United Kingdom (%)
Place of birth for the foreign-born population - England (%)
Place of birth for the foreign-born population - Scotland (%)
Place of birth for the foreign-born population - Other Northern Europe (%)
Place of birth for the foreign-born population - Austria (%)
Place of birth for the foreign-born population - Belgium (%)
Place of birth for the foreign-born population - France (%)
Place of birth for the foreign-born population - Germany (%)
Place of birth for the foreign-born population - Netherlands (%)
Place of birth for the foreign-born population - Switzerland (%)
Place of birth for the foreign-born population - Other Western Europe (%)
Place of birth for the foreign-born population - Greece (%)
Place of birth for the foreign-born population - Italy (%)
Place of birth for the foreign-born population - Portugal (%)
Place of birth for the foreign-born population - Spain (%)
Place of birth for the foreign-born population - Other Southern Europe (%)
Place of birth for the foreign-born population - Albania (%)
Place of birth for the foreign-born population - Belarus (%)
Place of birth for the foreign-born population - Bosnia and Herzegovina (%)
Place of birth for the foreign-born population - Bulgaria (%)
Place of birth for the foreign-born population - Croatia (%)
Place of birth for the foreign-born population - Czechoslovakia (%)
Place of birth for the foreign-born population - Hungary (%)
Place of birth for the foreign-born population - Latvia (%)
Place of birth for the foreign-born population - Lithuania (%)
Place of birth for the foreign-born population - North Macedonia (Macedonia) (%)
Place of birth for the foreign-born population - Moldova (%)
Place of birth for the foreign-born population - Poland (%)
Place of birth for the foreign-born population - Romania (%)
Place of birth for the foreign-born population - Russia (%)
Place of birth for the foreign-born population - Serbia (%)
Place of birth for the foreign-born population - Ukraine (%)
Place of birth for the foreign-born population - Other Eastern Europe (%)
Place of birth for the foreign-born population - China (%)
Place of birth for the foreign-born population - Hong Kong (%)
Place of birth for the foreign-born population - Taiwan (%)
Place of birth for the foreign-born population - Japan (%)
Place of birth for the foreign-born population - Korea (%)
Place of birth for the foreign-born population - Other Eastern Asia (%)
Place of birth for the foreign-born population - Afghanistan (%)
Place of birth for the foreign-born population - Bangladesh (%)
Place of birth for the foreign-born population - India (%)
Place of birth for the foreign-born population - Iran (%)
Place of birth for the foreign-born population - Kazakhstan (%)
Place of birth for the foreign-born population - Nepal (%)
Place of birth for the foreign-born population - Pakistan (%)
Place of birth for the foreign-born population - Sri Lanka (%)
Place of birth for the foreign-born population - Uzbekistan (%)
Place of birth for the foreign-born population - Other South Central Asia (%)
Place of birth for the foreign-born population - Burma (%)
Place of birth for the foreign-born population - Cambodia (%)
Place of birth for the foreign-born population - Indonesia (%)
Place of birth for the foreign-born population - Laos (%)
Place of birth for the foreign-born population - Malaysia (%)
Place of birth for the foreign-born population - Philippines (%)
Place of birth for the foreign-born population - Singapore (%)
Place of birth for the foreign-born population - Thailand (%)
Place of birth for the foreign-born population - Vietnam (%)
Place of birth for the foreign-born population - Other South Eastern Asia (%)
Place of birth for the foreign-born population - Armenia (%)
Place of birth for the foreign-born population - Iraq (%)
Place of birth for the foreign-born population - Israel (%)
Place of birth for the foreign-born population - Jordan (%)
Place of birth for the foreign-born population - Kuwait (%)
Place of birth for the foreign-born population - Lebanon (%)
Place of birth for the foreign-born population - Saudi Arabia (%)
Place of birth for the foreign-born population - Syria (%)
Place of birth for the foreign-born population - Turkey (%)
Place of birth for the foreign-born population - Yemen (%)
Place of birth for the foreign-born population - Other Western Asia (%)
Place of birth for the foreign-born population - Eritrea (%)
Place of birth for the foreign-born population - Ethiopia (%)
Place of birth for the foreign-born population - Kenya (%)
Place of birth for the foreign-born population - Somalia (%)
Place of birth for the foreign-born population - Uganda (%)
Place of birth for the foreign-born population - Zimbabwe (%)
Place of birth for the foreign-born population - Other Eastern Africa (%)
Place of birth for the foreign-born population - Cameroon (%)
Place of birth for the foreign-born population - Congo (%)
Place of birth for the foreign-born population - Democratic Republic of Congo (Zaire) (%)
Place of birth for the foreign-born population - Other Middle Africa (%)
Place of birth for the foreign-born population - Egypt (%)
Place of birth for the foreign-born population - Morocco (%)
Place of birth for the foreign-born population - Sudan (%)
Place of birth for the foreign-born population - Other Northern Africa (%)
Place of birth for the foreign-born population - South Africa (%)
Place of birth for the foreign-born population - Other Southern Africa (%)
Place of birth for the foreign-born population - Cabo Verde (%)
Place of birth for the foreign-born population - Ghana (%)
Place of birth for the foreign-born population - Liberia (%)
Place of birth for the foreign-born population - Nigeria (%)
Place of birth for the foreign-born population - Senegal (%)
Place of birth for the foreign-born population - Sierra Leone (%)
Place of birth for the foreign-born population - Other Western Africa (%)
Place of birth for the foreign-born population - Australia (%)
Place of birth for the foreign-born population - New Zealand (%)
Place of birth for the foreign-born population - Fiji (%)
Place of birth for the foreign-born population - Micronesia (%)
Place of birth for the foreign-born population - Bahamas (%)
Place of birth for the foreign-born population - Barbados (%)
Place of birth for the foreign-born population - Cuba (%)
Place of birth for the foreign-born population - Dominica (%)
Place of birth for the foreign-born population - Dominican Republic (%)
Place of birth for the foreign-born population - Grenada (%)
Place of birth for the foreign-born population - Haiti (%)
Place of birth for the foreign-born population - Jamaica (%)
Place of birth for the foreign-born population - St. Vincent and the Grenadines (%)
Place of birth for the foreign-born population - Trinidad and Tobago (%)
Place of birth for the foreign-born population - West Indies (%)
Place of birth for the foreign-born population - Other Caribbean (%)
Place of birth for the foreign-born population - Belize (%)
Place of birth for the foreign-born population - Costa Rica (%)
Place of birth for the foreign-born population - El Salvador (%)
Place of birth for the foreign-born population - Guatemala (%)
Place of birth for the foreign-born population - Honduras (%)
Place of birth for the foreign-born population - Mexico (%)
Place of birth for the foreign-born population - Nicaragua (%)
Place of birth for the foreign-born population - Panama (%)
Place of birth for the foreign-born population - Other Central America (%)
Place of birth for the foreign-born population - Argentina (%)
Place of birth for the foreign-born population - Bolivia (%)
Place of birth for the foreign-born population - Brazil (%)
Place of birth for the foreign-born population - Chile (%)
Place of birth for the foreign-born population - Colombia (%)
Place of birth for the foreign-born population - Ecuador (%)
Place of birth for the foreign-born population - Guyana (%)
Place of birth for the foreign-born population - Peru (%)
Place of birth for the foreign-born population - Uruguay (%)
Place of birth for the foreign-born population - Venezuela (%)
Place of birth for the foreign-born population - Other South America (%)
Place of birth for the foreign-born population - Canada (%)
Place of birth for the foreign-born population - Other Northern America (%)
Place of birth for the foreign-born population - Other (%)
Latest news about races in Largo, FL collected exclusively by city-data.com from local newspapers, TV, and radio stations
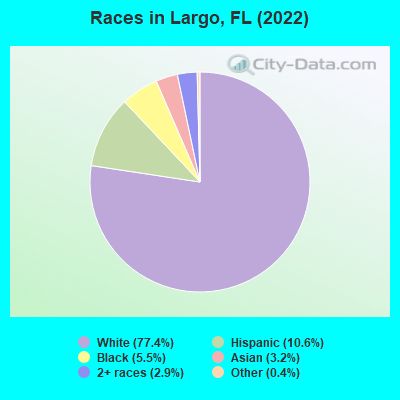
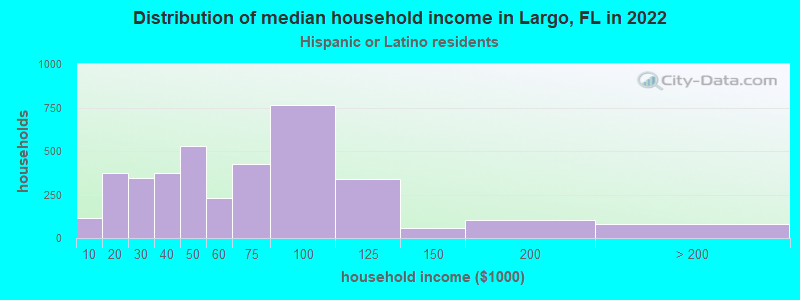
According to 2022 data, the most numerous races in Largo, FL are White alone (63,828 residents), Hispanic (8,731 residents), and Black alone (4,545 residents). 84.8% of Largo residents speak English at home. 13.1% of Largo, FL residents are foreign-born (6.2% born in Latin America, 3.0% born in Europe, 1.9% born in Asia), which is 59.8% less than the foreign-born rate of 21.0% across the entire state of Florida.
Race distribution in Largo
2000 2022
10,458,509 65.4% White alone 2,682,715 16.8% Hispanic 2,264,268 14.2% Black alone 261,693 1.6% Asian alone 236,954 1.5% Two or more races 42,358 0.3% American Indian alone 28,994 0.2% Other race alone 6,887 0.04% Native Hawaiian and Other
11,309,403 50.8% White alone 6,025,039 27.1% Hispanic 3,241,015 14.6% Black alone 861,630 3.9% Two or more races 623,692 2.8% Asian alone 152,054 0.7% Other race alone 22,504 0.1% American Indian alone 9,486 0.04% Native Hawaiian and Other
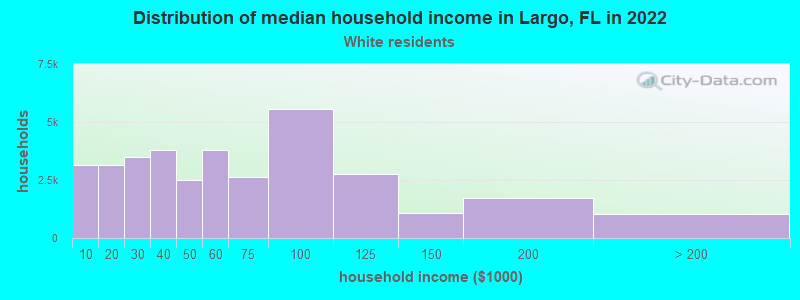
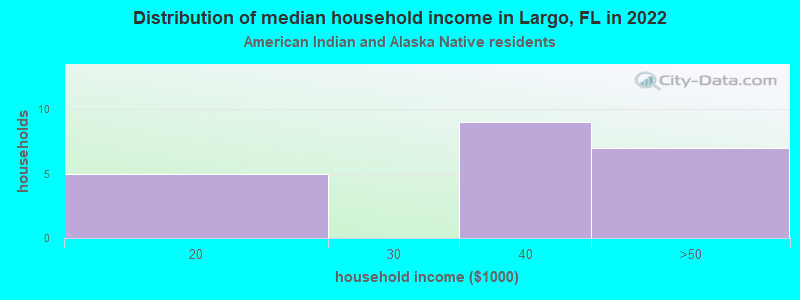
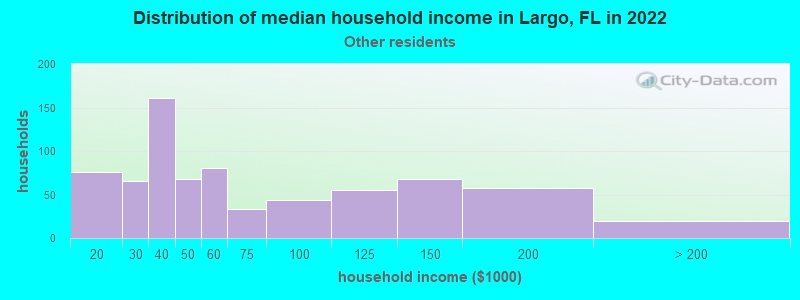
Income and house value in Largo Median household income in 2022 $52,714 White non-Hispanic householders$45,804 Black householders$68,859 Asian householders$52,831 Some other race householders$76,547 Two or more races householders$72,150 Hispanic or Latino race householdersMedian 2022 house value $335,881 White Non-Hispanic householders$259,356 Black or African American householders$355,107 American Indian or Alaska Native householders $354,353 Asian householders$320,425 Native Hawaiian and other Pacific Islander householders$287,629 Some other race householders$360,761 Two or more races householders$305,723 Hispanic or Latino householders
Median age by race in Largo
57.0 Median age for White residents52.5 59.9 23.1 Median age for Black or African American residents23.5 22.5 66.1 Median age for American Indian / Alaska Native residents-666,666,666.0 -666,666,666.0 46.8 Median age for Asian residents47.8 46.3 -666,666,666.0 Median age for Native Hawaiian / Pacific Islander residents-666,666,666.0 -666,666,666.0 30.7 Median age for Other race residents27.6 43.1 37.7 Median age for Two or more races residents33.5 40.7 58.0 Median age for White alone residents55.3 60.3 32.7 Median age for Hispanic or Latino residents32.1 40.4
Owner/renter occupied households by race in Largo
House owners and renters - White residents 21,918 63.3% Owner occupied12,708 36.7% Renter occupiedHouse owners and renters - Black or African American residents 190 13.2% Owner occupied1,244 86.8% Renter occupiedHouse owners and renters - American Indian / Alaska Native residents 10 43.1% Owner occupied13 56.9% Renter occupiedHouse owners and renters - Asian residents 497 63.0% Owner occupied292 37.0% Renter occupiedHouse owners and renters - Native Hawaiian / Pacific Islander residents 112 90.5% Owner occupied12 9.5% Renter occupiedHouse owners and renters - Other race residents 413 62.8% Owner occupied245 37.2% Renter occupiedHouse owners and renters - Two or more races residents 1,464 56.9% Owner occupied1,109 43.1% Renter occupiedHouse owners and renters - White alone residents 21,513 64.1% Owner occupied12,037 35.9% Renter occupiedHouse owners and renters - Hispanic or Latino residents 1,213 40.5% Owner occupied1,781 59.5% Renter occupied
Language usage in Largo
English speakers - Total 84.8% of residents of Largo speak English at home.
7.7% of residents speak Spanish at home 2,504 40.4% Speak English very well3,695 59.6% Speak English less than very well7.4% of residents speak other language at home 2,815 47.2% Speak English very well3,144 52.8% Speak English less than very well
English speakers - Born in the United States 96.1% of residents of Largo speak English at home.
2.4% of residents speak Spanish at home 858 74.2% Speak English very well299 25.8% Speak English less than very well1.4% of residents speak other language at home 458 69.2% Speak English very well204 30.8% Speak English less than very well
English speakers - Native, born elsewhere 42.2% of residents of Largo speak English at home.
57.8% of residents speak Spanish at home 574 33.8% Speak English very well1,126 66.2% Speak English less than very well
English speakers - Foreign-born 23.1% of residents of Largo speak English at home.
24.1% of residents speak Spanish at home 670 30.2% Speak English very well1,552 69.8% Speak English less than very well52.9% of residents speak other language at home 1,947 39.8% Speak English very well2,940 60.2% Speak English less than very well
White (Caucasian) - Speak only English Native:
94.7% (58,191)Foreign-born:
30.5% (1,445)
White (Caucasian) - Speak another language Native:
5.3% (3,257)Foreign-born:
69.5% (3,287)
Black or African American - Speak only English Native:
99.8% (5,837)Foreign-born:
35.3% (180)
Black or African American - Speak another language Native:
0.7% (40)Foreign-born:
58.3% (297)
Asian - Speak only English Native:
62.8% (766)Foreign-born:
13.1% (189)
Asian - Speak another language Native:
36.8% (449)Foreign-born:
86.8% (1,249)
Native Hawaiian / Pacific Islander - Speak only English Native:
87.6% (14)Foreign-born:
100.0% (85)
Other race - Speak only English Native:
57.7% (595)Foreign-born:
6.2% (66)
Other race - Speak another language Native:
42.4% (437)Foreign-born:
95.4% (1,017)
Two or more races - Speak only English Native:
70.5% (3,065)Foreign-born:
11.4% (123)
Two or more races - Speak another language Native:
29.5% (1,282)Foreign-born:
88.6% (954)
White alone - Speak only English Native:
98.3% (57,194)Foreign-born:
31.0% (1,445)
White alone - Speak another language Native:
1.7% (996)Foreign-born:
69.0% (3,214)
Hispanic or Latino - Speak only English Native:
40.2% (2,423)Foreign-born:
4.4% (100)
Hispanic or Latino - Speak another language Native:
59.8% (3,610)Foreign-born:
95.6% (2,153)
Foreign-born residents in Largo 10,869 residents are foreign born (6.2% Latin America , 3.0% Europe , 1.9% Asia ).
This city:
13.1%Florida:
21.1%
Marital status for residents in Largo Marital status - White (Caucasian) population 15 years and over
Males 33.1% Never married41.1% Now married2.7% Separated4.3% Widowed18.8% DivorcedFemales 26.1% Never married34.9% Now married1.5% Separated16.6% Widowed20.9% DivorcedWomen who gave birth in the past 12 months Now married:
100.0% (61)Unmarried:
0.0% (0)
Women who did not give birth in the past 12 months Now married:
26.4% (2,874)Unmarried:
73.6% (8,033)
Marital status - Black or African American population 15 years and over
Males 72.9% Never married4.7% Now married0.0% Separated4.2% Widowed18.2% DivorcedFemales 58.5% Never married0.0% Now married13.4% Separated14.3% Widowed13.8% DivorcedWomen who gave birth in the past 12 months Now married:
32.5% (34)Unmarried:
67.5% (72)
Women who did not give birth in the past 12 months Now married:
22.1% (417)Unmarried:
77.9% (1,466)
Marital status - American Indian / Alaska Native population 15 years and over
Males 25.0% Never married40.0% Now married0.0% Separated0.0% Widowed35.0% DivorcedFemales 100.0% Never married0.0% Now married0.0% Separated0.0% Widowed0.0% DivorcedWomen who did not give birth in the past 12 months Now married:
0.0% (0)Unmarried:
100.0% (15)
Marital status - Asian population 15 years and over
Males 57.3% Never married38.8% Now married0.8% Separated1.4% Widowed1.6% DivorcedFemales 34.4% Never married46.6% Now married0.8% Separated16.0% Widowed2.3% DivorcedWomen who gave birth in the past 12 months Now married:
100.0% (12)Unmarried:
0.0% (0)
Women who did not give birth in the past 12 months Now married:
42.1% (259)Unmarried:
57.9% (357)
Marital status - Native Hawaiian / Pacific Islander population 15 years and over
Males 24.4% Never married33.3% Now married0.0% Separated42.2% Widowed0.0% DivorcedFemales 12.0% Never married0.0% Now married0.0% Separated0.0% Widowed88.0% DivorcedWomen who gave birth in the past 12 months Now married:
0.0% (0)Unmarried:
100.0% (10)
Marital status - Other race population 15 years and over
Males 51.0% Never married39.7% Now married1.3% Separated0.0% Widowed8.1% DivorcedFemales 48.9% Never married32.7% Now married0.0% Separated4.8% Widowed13.6% DivorcedWomen who did not give birth in the past 12 months Now married:
30.2% (267)Unmarried:
69.8% (617)
Marital status - Two or more races population 15 years and over
Males 46.1% Never married36.4% Now married1.8% Separated2.1% Widowed13.5% DivorcedFemales 40.6% Never married18.5% Now married0.0% Separated8.4% Widowed32.5% DivorcedWomen who gave birth in the past 12 months Now married:
14.5% (48)Unmarried:
85.5% (285)
Women who did not give birth in the past 12 months Now married:
47.2% (1,058)Unmarried:
52.8% (1,184)
Marital status - White alone, not Hispanic / Latino population 15 years and over
Males 33.7% Never married38.9% Now married2.4% Separated4.6% Widowed20.4% DivorcedFemales 24.7% Never married35.4% Now married1.5% Separated17.0% Widowed21.3% DivorcedWomen who gave birth in the past 12 months Now married:
100.0% (61)Unmarried:
0.0% (0)
Women who did not give birth in the past 12 months Now married:
27.5% (2,788)Unmarried:
72.5% (7,335)
Marital status - Hispanic or Latino population 15 years and over
Males 40.7% Never married52.4% Now married5.7% Separated1.2% Widowed0.0% DivorcedFemales 51.8% Never married25.2% Now married0.0% Separated7.2% Widowed15.8% DivorcedWomen who gave birth in the past 12 months Now married:
32.5% (98)Unmarried:
67.5% (204)
Women who did not give birth in the past 12 months Now married:
40.3% (1,261)Unmarried:
59.7% (1,868)
Ancestries in Largo
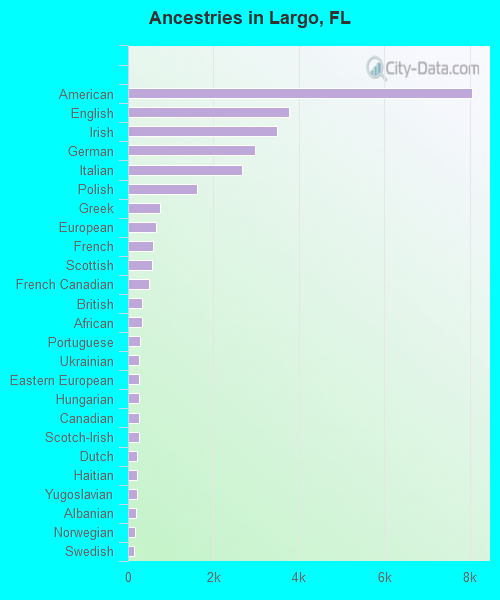
8,051 17.8% American3,774 8.3% English3,483 7.7% Irish2,985 6.6% German2,659 5.9% Italian1,624 3.6% Polish746 1.6% Greek655 1.4% European584 1.3% French571 1.3% Scottish498 1.1% French Canadian335 0.7% British334 0.7% African283 0.6% Portuguese263 0.6% Ukrainian258 0.6% Eastern European254 0.6% Hungarian251 0.6% Canadian248 0.5% Scotch-Irish214 0.5% Dutch201 0.4% Haitian200 0.4% Yugoslavian178 0.4% Albanian160 0.4% Norwegian138 0.3% Swedish134 0.3% Brazilian134 0.3% Russian132 0.3% Jamaican128 0.3% Slovene126 0.3% Austrian107 0.2% Slovak98 0.2% Northern European90 0.2% Croatian83 0.2% Lithuanian75 0.2% Swiss70 0.2% Trinidadian and Tobagonian62 0.1% Armenian59 0.1% Serbian46 0.1% Egyptian43 0.10% Bulgarian36 0.08% Danish35 0.08% Romanian32 0.07% Welsh25 0.06% Macedonian24 0.05% Turkish23 0.05% British West Indian21 0.05% Lebanese20 0.04% Israeli20 0.04% Belizean19 0.04% Scandinavian19 0.04% Moroccan18 0.04% Czechoslovakian13 0.03% West Indian8 0.02% Finnish8 0.02% Cajun7 0.02% Pennsylvania German7 0.02% Jordanian6 0.01% Belgian5 0.01% Slavic
Geographical mobility in Largo Same house 1 year ago 56,107 83.4% White (Caucasian)5,411 80.3% Black or African American76 91.8% American Indian / Alaska Native2,208 79.0% Asian171 100.0% Native Hawaiian / Pacific Islander1,576 76.0% Other race7,204 80.0% Two or more races53,873 84.5% White alone, not Hispanic / Latino8,446 77.9% Hispanic or LatinoMoved within same county 6,270 9.3% White / Caucasian786 11.7% Black or African American7 8.6% American Indian / Alaska Native506 18.1% Asian199 9.6% Other race931 10.3% Two or more races4,980 7.8% White alone, not Hispanic / Latino993 9.2% Hispanic or LatinoMoved within same state 1,908 2.8% White / Caucasian276 4.1% Black or African American62 2.2% Asian24 1.2% Other race143 1.6% Two or more races1,908 3.0% White alone, not Hispanic / Latino315 2.9% Hispanic or LatinoMoved from different state 2,652 3.9% White / Caucasian115 1.7% Black or African American42 1.5% Asian146 7.1% Other race64 0.7% Two or more races2,652 4.2% White alone, not Hispanic / Latino227 2.1% Hispanic or LatinoMoved from abroad 362 0.5% White22 0.3% Black or African American382 4.2% Two or more races362 0.6% White alone, not Hispanic / Latino570 5.3% Hispanic or Latino
Children Nativity (place of birth) in Largo
Children under 6 years - Living with two parents Both parents native 1,451 100.0% NativeBoth parents foreign-born 160 79.3% Native42 20.7% Foreign-bornOne native, one foreign-born parent 223 100.0% NativeChildren under 6 years - Living with one parent Native parent 1,302 100.0% NativeForeign-born parent 50 100.0% NativeChildren 6 to 17 years - Living with two parents Both parents native 2,657 100.0% NativeBoth parents foreign-born 237 42.3% Native323 57.7% Foreign-bornOne native, one foreign-born parent 526 98.4% Native9 1.6% Foreign-bornChildren 6 to 17 years - Living with one parent Native parent 3,088 100.0% NativeForeign-born parent 650 55.4% Native523 44.6% Foreign-born
Grandparents responsible for own grandchildren in Largo
Grandparents (30 to 59 years) White / Caucasian 214 80.0% Responsible for grandchildren54 20.0% Not responsible for grandchildrenBlack or African American 80 100.0% Responsible for grandchildrenTwo or more races 17 32.0% Responsible for grandchildren36 68.0% Not responsible for grandchildrenWhite alone, not Hispanic / Latino 136 71.5% Responsible for grandchildren54 28.5% Not responsible for grandchildrenHispanic or Latino 172 100.0% Responsible for grandchildrenGrandparents (60 years and over) White / Caucasian 326 42.0% Responsible for grandchildren449 58.0% Not responsible for grandchildrenBlack or African American 28 80.2% Responsible for grandchildren7 19.8% Not responsible for grandchildrenTwo or more races 118 100.0% Not responsible for grandchildrenWhite alone, not Hispanic / Latino 313 41.2% Responsible for grandchildren447 58.8% Not responsible for grandchildrenHispanic or Latino 96 100.0% Not responsible for grandchildren