Races in Leander, Texas (TX) Detailed Stats
Data:
Races - White alone (%)
Races - White alone (% change since 2000)
Races - Black alone (%)
Races - Black alone (% change since 2000)
Races - American Indian alone (%)
Races - American Indian alone (% change since 2000)
Races - Asian alone (%)
Races - Asian alone (% change since 2000)
Races - Hispanic (%)
Races - Hispanic (% change since 2000)
Races - Native Hawaiian and Other Pacific Islander alone (%)
Races - Native Hawaiian and Other Pacific Islander alone (% change since 2000)
Races - Two or more races(%)
Races - Two or more races(% change since 2000)
Races - Other race alone (%)
Races - Other race alone (% change since 2000)
Racial diversity
Place of birth - Born in state of residence (%)
Place of birth - Born in state of residence (%) - White
Place of birth - Born in state of residence (%) - Black or African American
Place of birth - Born in state of residence (%) - Asian
Place of birth - Born in state of residence (%) - Hispanic or Latino
Place of birth - Born in state of residence (%) - American Indian and Alaska Native
Place of birth - Born in state of residence (%) - Multirace
Place of birth - Born in state of residence (%) - Other Race
Place of birth - Born in other state (%)
Place of birth - Born in other state (%) - White
Place of birth - Born in other state (%) - Black or African American
Place of birth - Born in other state (%) - Asian
Place of birth - Born in other state (%) - Hispanic or Latino
Place of birth - Born in other state (%) - American Indian and Alaska Native
Place of birth - Born in other state (%) - Multirace
Place of birth - Born in other state (%) - Other Race
Place of birth - Native, outside of US (%)
Place of birth - Native, outside of US (%) - White
Place of birth - Native, outside of US (%) - Black or African American
Place of birth - Native, outside of US (%) - Asian
Place of birth - Native, outside of US (%) - Hispanic or Latino
Place of birth - Native, outside of US (%) - American Indian and Alaska Native
Place of birth - Native, outside of US (%) - Multirace
Place of birth - Native, outside of US (%) - Other Race
Place of birth - Foreign born (%)
Place of birth - Foreign born (%) - White
Place of birth - Foreign born (%) - Black or African American
Place of birth - Foreign born (%) - Asian
Place of birth - Foreign born (%) - Hispanic or Latino
Place of birth - Foreign born (%) - American Indian and Alaska Native
Place of birth - Foreign born (%) - Multirace
Place of birth - Foreign born (%) - Other Race
Residents speaking English at home (%)
Residents speaking English at home - Born in the United States (%)
Residents speaking English at home - Native, born elsewhere (%)
Residents speaking English at home - Foreign born (%)
Residents speaking Spanish at home (%)
Residents speaking Spanish at home - Born in the United States (%)
Residents speaking Spanish at home - Native, born elsewhere (%)
Residents speaking Spanish at home - Foreign born (%)
Residents speaking other language at home (%)
Residents speaking other language at home - Born in the United States (%)
Residents speaking other language at home - Native, born elsewhere (%)
Residents speaking other language at home - Foreign born (%)
Marital status - Never married (%)
Marital status - Now married (%)
Marital status - Separated (%)
Marital status - Widowed (%)
Marital status - Divorced (%)
Ancestries Reported - Arab (%)
Ancestries Reported - Czech (%)
Ancestries Reported - Danish (%)
Ancestries Reported - Dutch (%)
Ancestries Reported - English (%)
Ancestries Reported - French (%)
Ancestries Reported - French Canadian (%)
Ancestries Reported - German (%)
Ancestries Reported - Greek (%)
Ancestries Reported - Hungarian (%)
Ancestries Reported - Irish (%)
Ancestries Reported - Italian (%)
Ancestries Reported - Lithuanian (%)
Ancestries Reported - Norwegian (%)
Ancestries Reported - Polish (%)
Ancestries Reported - Portuguese (%)
Ancestries Reported - Russian (%)
Ancestries Reported - Scotch-Irish (%)
Ancestries Reported - Scottish (%)
Ancestries Reported - Slovak (%)
Ancestries Reported - Subsaharan African (%)
Ancestries Reported - Swedish (%)
Ancestries Reported - Swiss (%)
Ancestries Reported - Ukrainian (%)
Ancestries Reported - United States (%)
Ancestries Reported - Welsh (%)
Ancestries Reported - West Indian (%)
Ancestries Reported - Other (%)
Geographical mobility - Same house 1 year ago (%)
Geographical mobility - Same house 1 year ago (%) - White
Geographical mobility - Same house 1 year ago (%) - Black or African American
Geographical mobility - Same house 1 year ago (%) - Asian
Geographical mobility - Same house 1 year ago (%) - Hispanic or Latino
Geographical mobility - Same house 1 year ago (%) - American Indian and Alaska Native
Geographical mobility - Same house 1 year ago (%) - Multirace
Geographical mobility - Same house 1 year ago (%) - Other Race
Geographical mobility - Moved within same county (%)
Geographical mobility - Moved within same county (%) - White
Geographical mobility - Moved within same county (%) - Black or African American
Geographical mobility - Moved within same county (%) - Asian
Geographical mobility - Moved within same county (%) - Hispanic or Latino
Geographical mobility - Moved within same county (%) - American Indian and Alaska Native
Geographical mobility - Moved within same county (%) - Multirace
Geographical mobility - Moved within same county (%) - Other Race
Geographical mobility - Moved from different county within same state (%)
Geographical mobility - Moved from different county within same state (%) - White
Geographical mobility - Moved from different county within same state (%) - Black or African American
Geographical mobility - Moved from different county within same state (%) - Asian
Geographical mobility - Moved from different county within same state (%) - Hispanic or Latino
Geographical mobility - Moved from different county within same state (%) - American Indian and Alaska Native
Geographical mobility - Moved from different county within same state (%) - Multirace
Geographical mobility - Moved from different county within same state (%) - Other Race
Geographical mobility - Moved from different state (%)
Geographical mobility - Moved from different state (%) - White
Geographical mobility - Moved from different state (%) - Black or African American
Geographical mobility - Moved from different state (%) - Asian
Geographical mobility - Moved from different state (%) - Hispanic or Latino
Geographical mobility - Moved from different state (%) - American Indian and Alaska Native
Geographical mobility - Moved from different state (%) - Multirace
Geographical mobility - Moved from different state (%) - Other Race
Geographical mobility - Moved from abroad (%)
Geographical mobility - Moved from abroad (%) - White
Geographical mobility - Moved from abroad (%) - Black or African American
Geographical mobility - Moved from abroad (%) - Asian
Geographical mobility - Moved from abroad (%) - Hispanic or Latino
Geographical mobility - Moved from abroad (%) - American Indian and Alaska Native
Geographical mobility - Moved from abroad (%) - Multirace
Geographical mobility - Moved from abroad (%) - Other Race
Place of birth for the foreign-born population - Ireland (%)
Place of birth for the foreign-born population - Denmark (%)
Place of birth for the foreign-born population - Norway (%)
Place of birth for the foreign-born population - Sweden (%)
Place of birth for the foreign-born population - United Kingdom (%)
Place of birth for the foreign-born population - England (%)
Place of birth for the foreign-born population - Scotland (%)
Place of birth for the foreign-born population - Other Northern Europe (%)
Place of birth for the foreign-born population - Austria (%)
Place of birth for the foreign-born population - Belgium (%)
Place of birth for the foreign-born population - France (%)
Place of birth for the foreign-born population - Germany (%)
Place of birth for the foreign-born population - Netherlands (%)
Place of birth for the foreign-born population - Switzerland (%)
Place of birth for the foreign-born population - Other Western Europe (%)
Place of birth for the foreign-born population - Greece (%)
Place of birth for the foreign-born population - Italy (%)
Place of birth for the foreign-born population - Portugal (%)
Place of birth for the foreign-born population - Spain (%)
Place of birth for the foreign-born population - Other Southern Europe (%)
Place of birth for the foreign-born population - Albania (%)
Place of birth for the foreign-born population - Belarus (%)
Place of birth for the foreign-born population - Bosnia and Herzegovina (%)
Place of birth for the foreign-born population - Bulgaria (%)
Place of birth for the foreign-born population - Croatia (%)
Place of birth for the foreign-born population - Czechoslovakia (%)
Place of birth for the foreign-born population - Hungary (%)
Place of birth for the foreign-born population - Latvia (%)
Place of birth for the foreign-born population - Lithuania (%)
Place of birth for the foreign-born population - North Macedonia (Macedonia) (%)
Place of birth for the foreign-born population - Moldova (%)
Place of birth for the foreign-born population - Poland (%)
Place of birth for the foreign-born population - Romania (%)
Place of birth for the foreign-born population - Russia (%)
Place of birth for the foreign-born population - Serbia (%)
Place of birth for the foreign-born population - Ukraine (%)
Place of birth for the foreign-born population - Other Eastern Europe (%)
Place of birth for the foreign-born population - China (%)
Place of birth for the foreign-born population - Hong Kong (%)
Place of birth for the foreign-born population - Taiwan (%)
Place of birth for the foreign-born population - Japan (%)
Place of birth for the foreign-born population - Korea (%)
Place of birth for the foreign-born population - Other Eastern Asia (%)
Place of birth for the foreign-born population - Afghanistan (%)
Place of birth for the foreign-born population - Bangladesh (%)
Place of birth for the foreign-born population - India (%)
Place of birth for the foreign-born population - Iran (%)
Place of birth for the foreign-born population - Kazakhstan (%)
Place of birth for the foreign-born population - Nepal (%)
Place of birth for the foreign-born population - Pakistan (%)
Place of birth for the foreign-born population - Sri Lanka (%)
Place of birth for the foreign-born population - Uzbekistan (%)
Place of birth for the foreign-born population - Other South Central Asia (%)
Place of birth for the foreign-born population - Burma (%)
Place of birth for the foreign-born population - Cambodia (%)
Place of birth for the foreign-born population - Indonesia (%)
Place of birth for the foreign-born population - Laos (%)
Place of birth for the foreign-born population - Malaysia (%)
Place of birth for the foreign-born population - Philippines (%)
Place of birth for the foreign-born population - Singapore (%)
Place of birth for the foreign-born population - Thailand (%)
Place of birth for the foreign-born population - Vietnam (%)
Place of birth for the foreign-born population - Other South Eastern Asia (%)
Place of birth for the foreign-born population - Armenia (%)
Place of birth for the foreign-born population - Iraq (%)
Place of birth for the foreign-born population - Israel (%)
Place of birth for the foreign-born population - Jordan (%)
Place of birth for the foreign-born population - Kuwait (%)
Place of birth for the foreign-born population - Lebanon (%)
Place of birth for the foreign-born population - Saudi Arabia (%)
Place of birth for the foreign-born population - Syria (%)
Place of birth for the foreign-born population - Turkey (%)
Place of birth for the foreign-born population - Yemen (%)
Place of birth for the foreign-born population - Other Western Asia (%)
Place of birth for the foreign-born population - Eritrea (%)
Place of birth for the foreign-born population - Ethiopia (%)
Place of birth for the foreign-born population - Kenya (%)
Place of birth for the foreign-born population - Somalia (%)
Place of birth for the foreign-born population - Uganda (%)
Place of birth for the foreign-born population - Zimbabwe (%)
Place of birth for the foreign-born population - Other Eastern Africa (%)
Place of birth for the foreign-born population - Cameroon (%)
Place of birth for the foreign-born population - Congo (%)
Place of birth for the foreign-born population - Democratic Republic of Congo (Zaire) (%)
Place of birth for the foreign-born population - Other Middle Africa (%)
Place of birth for the foreign-born population - Egypt (%)
Place of birth for the foreign-born population - Morocco (%)
Place of birth for the foreign-born population - Sudan (%)
Place of birth for the foreign-born population - Other Northern Africa (%)
Place of birth for the foreign-born population - South Africa (%)
Place of birth for the foreign-born population - Other Southern Africa (%)
Place of birth for the foreign-born population - Cabo Verde (%)
Place of birth for the foreign-born population - Ghana (%)
Place of birth for the foreign-born population - Liberia (%)
Place of birth for the foreign-born population - Nigeria (%)
Place of birth for the foreign-born population - Senegal (%)
Place of birth for the foreign-born population - Sierra Leone (%)
Place of birth for the foreign-born population - Other Western Africa (%)
Place of birth for the foreign-born population - Australia (%)
Place of birth for the foreign-born population - New Zealand (%)
Place of birth for the foreign-born population - Fiji (%)
Place of birth for the foreign-born population - Micronesia (%)
Place of birth for the foreign-born population - Bahamas (%)
Place of birth for the foreign-born population - Barbados (%)
Place of birth for the foreign-born population - Cuba (%)
Place of birth for the foreign-born population - Dominica (%)
Place of birth for the foreign-born population - Dominican Republic (%)
Place of birth for the foreign-born population - Grenada (%)
Place of birth for the foreign-born population - Haiti (%)
Place of birth for the foreign-born population - Jamaica (%)
Place of birth for the foreign-born population - St. Vincent and the Grenadines (%)
Place of birth for the foreign-born population - Trinidad and Tobago (%)
Place of birth for the foreign-born population - West Indies (%)
Place of birth for the foreign-born population - Other Caribbean (%)
Place of birth for the foreign-born population - Belize (%)
Place of birth for the foreign-born population - Costa Rica (%)
Place of birth for the foreign-born population - El Salvador (%)
Place of birth for the foreign-born population - Guatemala (%)
Place of birth for the foreign-born population - Honduras (%)
Place of birth for the foreign-born population - Mexico (%)
Place of birth for the foreign-born population - Nicaragua (%)
Place of birth for the foreign-born population - Panama (%)
Place of birth for the foreign-born population - Other Central America (%)
Place of birth for the foreign-born population - Argentina (%)
Place of birth for the foreign-born population - Bolivia (%)
Place of birth for the foreign-born population - Brazil (%)
Place of birth for the foreign-born population - Chile (%)
Place of birth for the foreign-born population - Colombia (%)
Place of birth for the foreign-born population - Ecuador (%)
Place of birth for the foreign-born population - Guyana (%)
Place of birth for the foreign-born population - Peru (%)
Place of birth for the foreign-born population - Uruguay (%)
Place of birth for the foreign-born population - Venezuela (%)
Place of birth for the foreign-born population - Other South America (%)
Place of birth for the foreign-born population - Canada (%)
Place of birth for the foreign-born population - Other Northern America (%)
Place of birth for the foreign-born population - Other (%)
Latest news about races in Leander, TX collected exclusively by city-data.com from local newspapers, TV, and radio stations
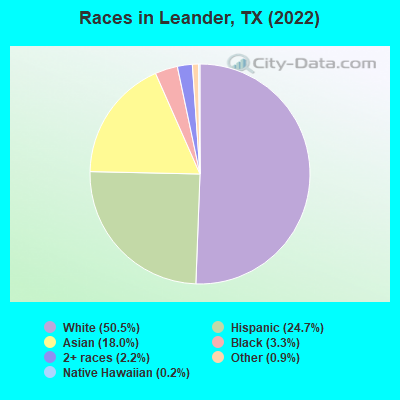
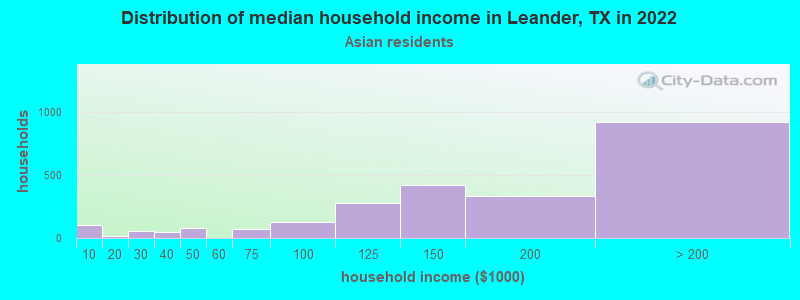
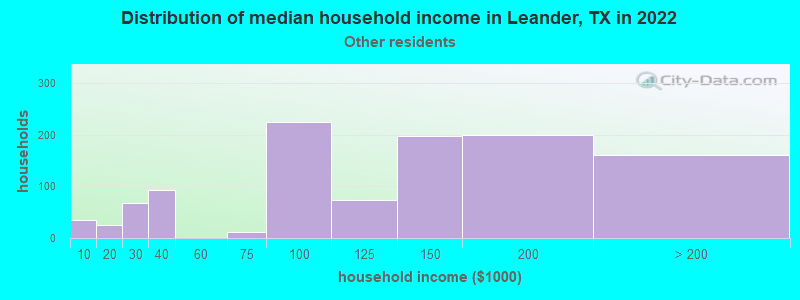
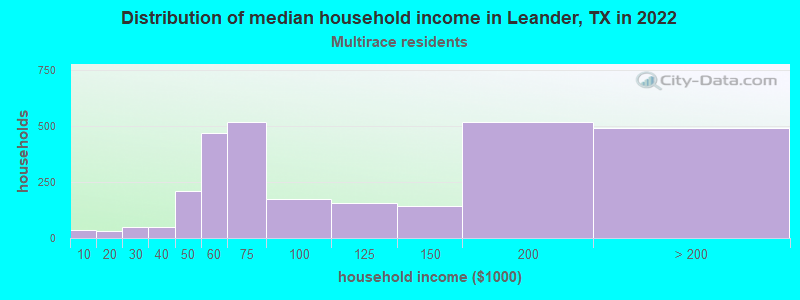
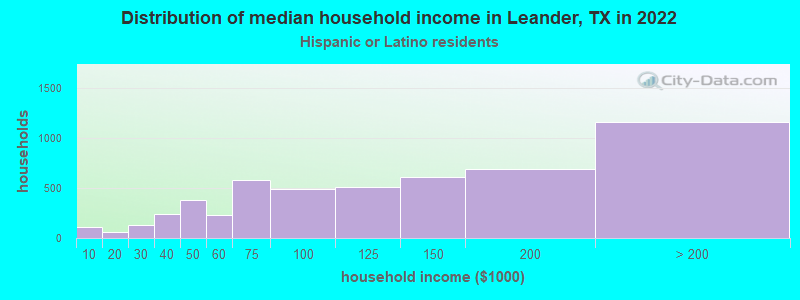
According to 2022 data, the most numerous races in Leander, TX are Hispanic (18,222 residents), White alone (37,263 residents), and Black alone (2,468 residents). 69.4% of Leander residents speak English at home. 14.1% of Leander, TX residents are foreign-born (6.2% born in Asia, 5.5% born in Latin America, 1.7% born in Europe), which is 20.7% less than the foreign-born rate of 17.0% across the entire state of Texas.
Race distribution in Leander
2000 2022
10,933,313 52.4% White alone 6,669,666 32.0% Hispanic 2,364,255 11.3% Black alone 554,445 2.7% Asian alone 230,567 1.1% Two or more races 68,859 0.3% American Indian alone 19,958 0.10% Other race alone 10,757 0.05% Native Hawaiian and Other
12,070,642 40.2% Hispanic 11,683,430 38.9% White alone 3,508,706 11.7% Black alone 1,608,173 5.4% Asian alone 956,560 3.2% Two or more races 125,763 0.4% Other race alone 47,023 0.2% American Indian alone 29,275 0.10% Native Hawaiian and Other
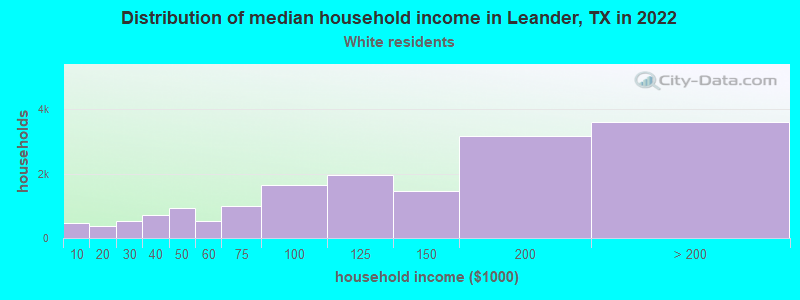
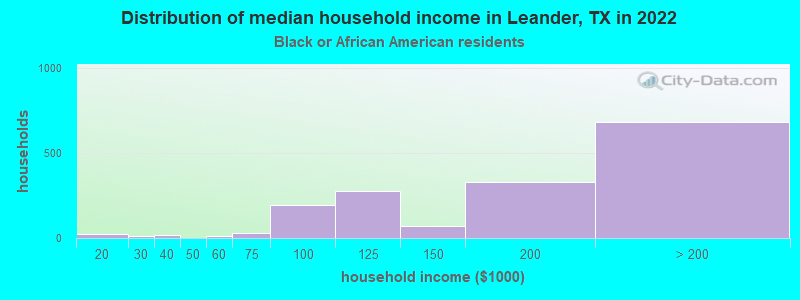
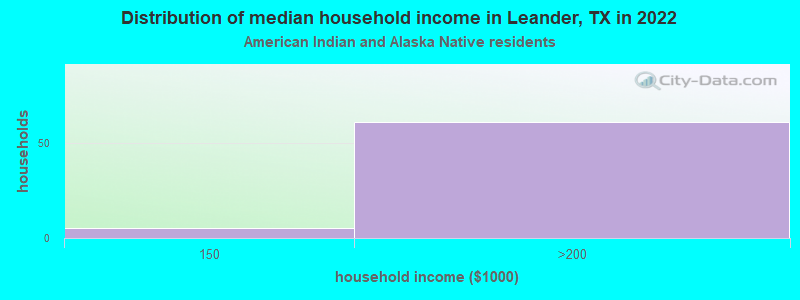
Income and house value in Leander Median household income in 2022 $122,128 White non-Hispanic householdersover $200,000 Black householders$165,344 Asian householdersover $200,000 Some other race householders$100,719 Two or more races householders$185,152 Hispanic or Latino race householdersMedian 2022 house value $557,051 White Non-Hispanic householders$583,128 Black or African American householders$527,090 American Indian or Alaska Native householders $624,186 Asian householders$901,602 Native Hawaiian and other Pacific Islander householders$520,987 Some other race householders$604,212 Two or more races householders$524,871 Hispanic or Latino householders
Median age by race in Leander
39.7 Median age for White residents39.5 40.0 40.8 Median age for Black or African American residents35.3 43.8 40.3 Median age for American Indian / Alaska Native residents42.8 32.8 35.9 Median age for Asian residents38.5 34.9 -666,666,666.0 Median age for Native Hawaiian / Pacific Islander residents-666,666,666.0 -666,666,666.0 34.9 Median age for Other race residents34.8 34.9 31.3 Median age for Two or more races residents35.6 20.2 40.3 Median age for White alone residents40.4 40.3 34.1 Median age for Hispanic or Latino residents35.1 25.8
Owner/renter occupied households by race in Leander
House owners and renters - White residents 12,353 75.7% Owner occupied3,963 24.3% Renter occupiedHouse owners and renters - Black or African American residents 884 76.1% Owner occupied278 23.9% Renter occupiedHouse owners and renters - American Indian / Alaska Native residents 87 100.0% Owner occupiedHouse owners and renters - Asian residents 4,141 88.0% Owner occupied566 12.0% Renter occupiedHouse owners and renters - Native Hawaiian / Pacific Islander residents 45 100.0% Renter occupiedHouse owners and renters - Other race residents 1,155 85.5% Owner occupied195 14.5% Renter occupiedHouse owners and renters - Two or more races residents 2,400 66.4% Owner occupied1,217 33.6% Renter occupiedHouse owners and renters - White alone residents 10,626 73.9% Owner occupied3,758 26.1% Renter occupiedHouse owners and renters - Hispanic or Latino residents 4,094 80.2% Owner occupied1,013 19.8% Renter occupied
Language usage in Leander
English speakers - Total 69.4% of residents of Leander speak English at home.
12.6% of residents speak Spanish at home 6,713 76.8% Speak English very well2,030 23.2% Speak English less than very well18.0% of residents speak other language at home 9,829 78.3% Speak English very well2,716 21.7% Speak English less than very well
English speakers - Born in the United States 90.1% of residents of Leander speak English at home.
4.5% of residents speak Spanish at home 807 78.6% Speak English very well220 21.4% Speak English less than very well5.4% of residents speak other language at home 1,113 89.6% Speak English very well129 10.4% Speak English less than very well
English speakers - Native, born elsewhere 57.9% of residents of Leander speak English at home.
35.9% of residents speak Spanish at home 517 89.8% Speak English very well59 10.2% Speak English less than very well6.2% of residents speak other language at home 99 100.0% Speak English very well
English speakers - Foreign-born 11.1% of residents of Leander speak English at home.
19.8% of residents speak Spanish at home 1,595 53.3% Speak English very well1,395 46.7% Speak English less than very well69.2% of residents speak other language at home 8,004 76.5% Speak English very well2,463 23.5% Speak English less than very well
White (Caucasian) - Speak only English Native:
97.1% (35,828)Foreign-born:
40.8% (1,066)
White (Caucasian) - Speak another language Native:
2.9% (1,080)Foreign-born:
59.2% (1,548)
Black or African American - Speak only English Native:
96.8% (3,001)Foreign-born:
18.8% (124)
Black or African American - Speak another language Native:
1.5% (47)Foreign-born:
79.4% (522)
American Indian / Alaska Native - Speak another language Native:
68.0% (73)Foreign-born:
98.9% (129)
Asian - Speak only English Native:
50.9% (1,800)Foreign-born:
3.0% (273)
Asian - Speak another language Native:
49.1% (1,739)Foreign-born:
97.0% (8,837)
Other race - Speak only English Native:
40.1% (1,045)Foreign-born:
12.6% (145)
Other race - Speak another language Native:
59.9% (1,558)Foreign-born:
87.4% (1,009)
Two or more races - Speak only English Native:
63.1% (5,898)Foreign-born:
3.6% (64)
Two or more races - Speak another language Native:
36.9% (3,454)Foreign-born:
96.4% (1,700)
White alone - Speak only English Native:
98.4% (32,550)Foreign-born:
39.6% (920)
White alone - Speak another language Native:
1.6% (542)Foreign-born:
60.4% (1,404)
Hispanic or Latino - Speak only English Native:
62.4% (8,557)Foreign-born:
8.9% (291)
Hispanic or Latino - Speak another language Native:
37.6% (5,156)Foreign-born:
91.1% (2,990)
Foreign-born residents in Leander 9,571 residents are foreign born (6.2% Asia , 5.5% Latin America , 1.7% Europe ).
This city:
14.1%Texas:
17.1%
Marital status for residents in Leander Marital status - White (Caucasian) population 15 years and over
Males 16.7% Never married69.9% Now married1.3% Separated0.3% Widowed11.9% DivorcedFemales 22.7% Never married55.0% Now married0.6% Separated5.3% Widowed16.5% DivorcedWomen who gave birth in the past 12 months Now married:
100.0% (470)Unmarried:
0.0% (0)
Women who did not give birth in the past 12 months Now married:
51.7% (5,615)Unmarried:
48.3% (5,238)
Marital status - Black or African American population 15 years and over
Males 12.0% Never married80.8% Now married6.8% Separated0.0% Widowed0.3% DivorcedFemales 43.7% Never married48.8% Now married0.0% Separated3.2% Widowed4.2% DivorcedWomen who gave birth in the past 12 months Now married:
100.0% (13)Unmarried:
0.0% (0)
Women who did not give birth in the past 12 months Now married:
45.1% (523)Unmarried:
54.9% (636)
Marital status - American Indian / Alaska Native population 15 years and over
Males 29.4% Never married70.6% Now married0.0% Separated0.0% Widowed0.0% DivorcedFemales 0.0% Never married100.0% Now married0.0% Separated0.0% Widowed0.0% DivorcedWomen who did not give birth in the past 12 months Now married:
100.0% (66)Unmarried:
0.0% (0)
Marital status - Asian population 15 years and over
Males 12.7% Never married84.8% Now married0.6% Separated0.0% Widowed1.8% DivorcedFemales 17.9% Never married69.5% Now married4.7% Separated6.0% Widowed1.9% DivorcedWomen who gave birth in the past 12 months Now married:
82.6% (475)Unmarried:
17.4% (100)
Women who did not give birth in the past 12 months Now married:
75.5% (2,761)Unmarried:
24.5% (897)
Marital status - Native Hawaiian / Pacific Islander population 15 years and over
Males 63.9% Never married36.1% Now married0.0% Separated0.0% Widowed0.0% DivorcedFemales 0.0% Never married100.0% Now married0.0% Separated0.0% Widowed0.0% DivorcedWomen who gave birth in the past 12 months Now married:
100.0% (13)Unmarried:
0.0% (0)
Marital status - Other race population 15 years and over
Males 41.6% Never married54.2% Now married2.7% Separated0.0% Widowed1.5% DivorcedFemales 34.1% Never married51.0% Now married5.6% Separated2.9% Widowed6.5% DivorcedWomen who gave birth in the past 12 months Now married:
100.0% (90)Unmarried:
0.0% (0)
Women who did not give birth in the past 12 months Now married:
47.6% (668)Unmarried:
52.4% (736)
Marital status - Two or more races population 15 years and over
Males 45.6% Never married42.1% Now married1.2% Separated6.8% Widowed4.4% DivorcedFemales 32.0% Never married56.2% Now married1.7% Separated0.0% Widowed10.0% DivorcedWomen who gave birth in the past 12 months Now married:
100.0% (242)Unmarried:
0.0% (0)
Women who did not give birth in the past 12 months Now married:
53.3% (1,820)Unmarried:
46.7% (1,593)
Marital status - White alone, not Hispanic / Latino population 15 years and over
Males 16.0% Never married68.8% Now married1.4% Separated0.3% Widowed13.4% DivorcedFemales 22.8% Never married55.5% Now married0.6% Separated5.7% Widowed15.4% DivorcedWomen who gave birth in the past 12 months Now married:
100.0% (470)Unmarried:
0.0% (0)
Women who did not give birth in the past 12 months Now married:
53.1% (5,414)Unmarried:
46.9% (4,782)
Marital status - Hispanic or Latino population 15 years and over
Males 26.6% Never married66.7% Now married1.9% Separated0.0% Widowed4.8% DivorcedFemales 35.4% Never married52.0% Now married0.0% Separated4.4% Widowed8.2% DivorcedWomen who gave birth in the past 12 months Now married:
100.0% (136)Unmarried:
0.0% (0)
Women who did not give birth in the past 12 months Now married:
43.4% (2,132)Unmarried:
56.6% (2,786)
Ancestries in Leander
2,508 8.9% German2,033 7.2% English1,480 5.2% American1,027 3.6% European698 2.5% Irish478 1.7% Italian458 1.6% Norwegian376 1.3% French282 1.0% Polish247 0.9% Scotch-Irish244 0.9% African223 0.8% Scottish208 0.7% Portuguese182 0.6% Iranian165 0.6% British138 0.5% Brazilian132 0.5% Swedish104 0.4% Jamaican92 0.3% Eastern European85 0.3% Russian80 0.3% Afghan80 0.3% French Canadian75 0.3% Romanian65 0.2% Dutch56 0.2% Nigerian51 0.2% Danish48 0.2% Czechoslovakian47 0.2% Serbian39 0.1% Czech38 0.1% Cajun37 0.1% Canadian34 0.1% Welsh34 0.1% Scandinavian31 0.1% Austrian29 0.1% Swiss24 0.09% Yugoslavian22 0.08% Greek22 0.08% Croatian21 0.07% Lithuanian19 0.07% Lebanese15 0.05% Ukrainian14 0.05% Belgian11 0.04% Hungarian11 0.04% Armenian10 0.04% Northern European7 0.02% Celtic4 0.01% West Indian3 0.01% Alsatian
Geographical mobility in Leander Same house 1 year ago 32,570 79.8% White (Caucasian)3,274 76.9% Black or African American170 73.9% American Indian / Alaska Native5,121 73.4% Asian39 56.4% Native Hawaiian / Pacific Islander4,572 83.9% Other race9,558 80.5% Two or more races30,213 82.3% White alone, not Hispanic / Latino13,229 80.9% Hispanic or LatinoMoved within same county 2,153 5.3% White / Caucasian413 9.7% Black or African American10 4.2% American Indian / Alaska Native722 10.3% Asian13 18.9% Native Hawaiian / Pacific Islander80 1.5% Other race580 4.9% Two or more races1,027 2.8% White alone, not Hispanic / Latino1,255 7.7% Hispanic or LatinoMoved within same state 3,493 8.6% White / Caucasian276 6.5% Black or African American5 2.2% American Indian / Alaska Native311 4.5% Asian461 8.5% Other race1,376 11.6% Two or more races3,020 8.2% White alone, not Hispanic / Latino792 4.8% Hispanic or LatinoMoved from different state 2,435 6.0% White / Caucasian42 1.0% Black or African American11 4.8% American Indian / Alaska Native789 11.3% Asian214 1.8% Two or more races2,257 6.1% White alone, not Hispanic / Latino246 1.5% Hispanic or LatinoMoved from abroad 186 0.5% White127 3.0% Black or African American19 8.3% American Indian / Alaska Native107 1.5% Asian107 2.0% Other race186 0.5% White alone, not Hispanic / Latino156 1.0% Hispanic or Latino
Children Nativity (place of birth) in Leander
Children under 6 years - Living with two parents Both parents native 1,919 100.0% NativeBoth parents foreign-born 1,251 91.8% Native112 8.2% Foreign-bornOne native, one foreign-born parent 907 100.0% NativeChildren under 6 years - Living with one parent Native parent 430 100.0% NativeForeign-born parent 112 100.0% NativeChildren 6 to 17 years - Living with two parents Both parents native 7,563 100.0% NativeBoth parents foreign-born 2,669 81.0% Native627 19.0% Foreign-bornOne native, one foreign-born parent 940 100.0% NativeChildren 6 to 17 years - Living with one parent Native parent 3,110 96.3% Native119 3.7% Foreign-bornForeign-born parent 175 86.2% Native28 13.8% Foreign-born
Grandparents responsible for own grandchildren in Leander
Grandparents (30 to 59 years) White / Caucasian 1 0.3% Responsible for grandchildren155 99.7% Not responsible for grandchildrenBlack or African American 5 100.0% Responsible for grandchildrenAsian 15 19.7% Responsible for grandchildren59 80.3% Not responsible for grandchildrenOther race 25 66.1% Responsible for grandchildren13 33.9% Not responsible for grandchildrenTwo or more races 181 96.0% Responsible for grandchildren8 4.0% Not responsible for grandchildrenWhite alone, not Hispanic / Latino 101 100.0% Not responsible for grandchildrenHispanic or Latino 64 30.5% Responsible for grandchildren145 69.5% Not responsible for grandchildrenGrandparents (60 years and over) White / Caucasian 39 11.9% Responsible for grandchildren285 88.1% Not responsible for grandchildrenBlack or African American 7 100.0% Responsible for grandchildrenAsian 115 100.0% Not responsible for grandchildrenOther race 130 100.0% Not responsible for grandchildrenTwo or more races 15 13.9% Responsible for grandchildren91 86.1% Not responsible for grandchildrenWhite alone, not Hispanic / Latino 25 11.5% Responsible for grandchildren189 88.5% Not responsible for grandchildrenHispanic or Latino 5 1.5% Responsible for grandchildren351 98.5% Not responsible for grandchildren