Races in Lexington Park, Maryland (MD) Detailed Stats
Data:
Races - White alone (%)
Races - White alone (% change since 2000)
Races - Black alone (%)
Races - Black alone (% change since 2000)
Races - American Indian alone (%)
Races - American Indian alone (% change since 2000)
Races - Asian alone (%)
Races - Asian alone (% change since 2000)
Races - Hispanic (%)
Races - Hispanic (% change since 2000)
Races - Native Hawaiian and Other Pacific Islander alone (%)
Races - Native Hawaiian and Other Pacific Islander alone (% change since 2000)
Races - Two or more races(%)
Races - Two or more races(% change since 2000)
Races - Other race alone (%)
Races - Other race alone (% change since 2000)
Racial diversity
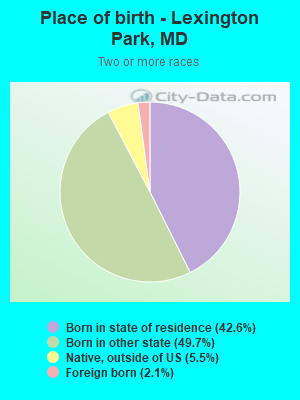
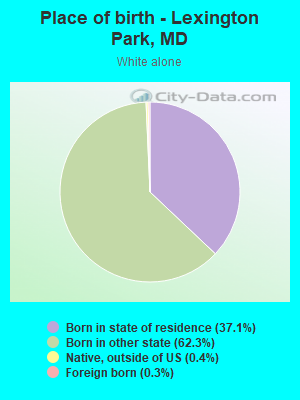
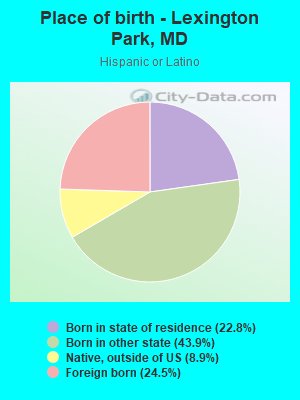
Place of birth - Born in state of residence (%)
Place of birth - Born in state of residence (%) - White
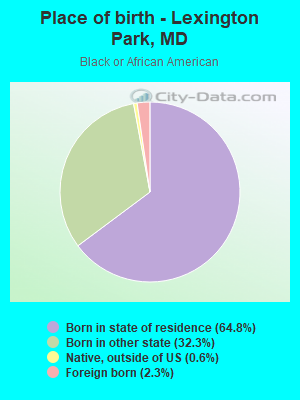
Place of birth - Born in state of residence (%) - Black or African American
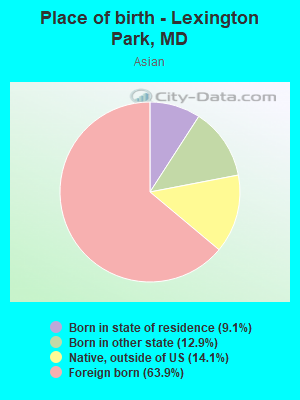
Place of birth - Born in state of residence (%) - Asian
Place of birth - Born in state of residence (%) - Hispanic or Latino
Place of birth - Born in state of residence (%) - American Indian and Alaska Native
Place of birth - Born in state of residence (%) - Multirace
Place of birth - Born in state of residence (%) - Other Race
Place of birth - Born in other state (%)
Place of birth - Born in other state (%) - White
Place of birth - Born in other state (%) - Black or African American
Place of birth - Born in other state (%) - Asian
Place of birth - Born in other state (%) - Hispanic or Latino
Place of birth - Born in other state (%) - American Indian and Alaska Native
Place of birth - Born in other state (%) - Multirace
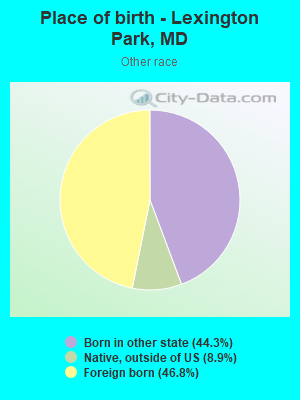
Place of birth - Born in other state (%) - Other Race
Place of birth - Native, outside of US (%)
Place of birth - Native, outside of US (%) - White
Place of birth - Native, outside of US (%) - Black or African American
Place of birth - Native, outside of US (%) - Asian
Place of birth - Native, outside of US (%) - Hispanic or Latino
Place of birth - Native, outside of US (%) - American Indian and Alaska Native
Place of birth - Native, outside of US (%) - Multirace
Place of birth - Native, outside of US (%) - Other Race
Place of birth - Foreign born (%)
Place of birth - Foreign born (%) - White
Place of birth - Foreign born (%) - Black or African American
Place of birth - Foreign born (%) - Asian
Place of birth - Foreign born (%) - Hispanic or Latino
Place of birth - Foreign born (%) - American Indian and Alaska Native
Place of birth - Foreign born (%) - Multirace
Place of birth - Foreign born (%) - Other Race
Residents speaking English at home (%)
Residents speaking English at home - Born in the United States (%)
Residents speaking English at home - Native, born elsewhere (%)
Residents speaking English at home - Foreign born (%)
Residents speaking Spanish at home (%)
Residents speaking Spanish at home - Born in the United States (%)
Residents speaking Spanish at home - Native, born elsewhere (%)
Residents speaking Spanish at home - Foreign born (%)
Residents speaking other language at home (%)
Residents speaking other language at home - Born in the United States (%)
Residents speaking other language at home - Native, born elsewhere (%)
Residents speaking other language at home - Foreign born (%)
Marital status - Never married (%)
Marital status - Now married (%)
Marital status - Separated (%)
Marital status - Widowed (%)
Marital status - Divorced (%)
Ancestries Reported - Arab (%)
Ancestries Reported - Czech (%)
Ancestries Reported - Danish (%)
Ancestries Reported - Dutch (%)
Ancestries Reported - English (%)
Ancestries Reported - French (%)
Ancestries Reported - French Canadian (%)
Ancestries Reported - German (%)
Ancestries Reported - Greek (%)
Ancestries Reported - Hungarian (%)
Ancestries Reported - Irish (%)
Ancestries Reported - Italian (%)
Ancestries Reported - Lithuanian (%)
Ancestries Reported - Norwegian (%)
Ancestries Reported - Polish (%)
Ancestries Reported - Portuguese (%)
Ancestries Reported - Russian (%)
Ancestries Reported - Scotch-Irish (%)
Ancestries Reported - Scottish (%)
Ancestries Reported - Slovak (%)
Ancestries Reported - Subsaharan African (%)
Ancestries Reported - Swedish (%)
Ancestries Reported - Swiss (%)
Ancestries Reported - Ukrainian (%)
Ancestries Reported - United States (%)
Ancestries Reported - Welsh (%)
Ancestries Reported - West Indian (%)
Ancestries Reported - Other (%)
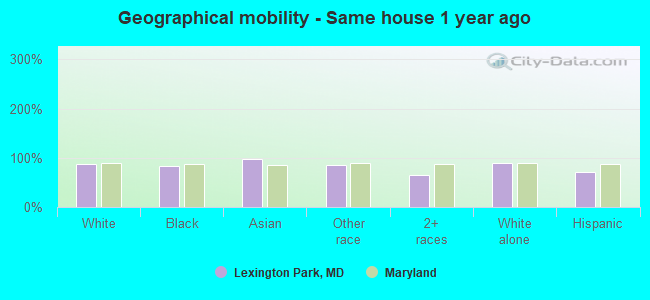
Geographical mobility - Same house 1 year ago (%)
Geographical mobility - Same house 1 year ago (%) - White
Geographical mobility - Same house 1 year ago (%) - Black or African American
Geographical mobility - Same house 1 year ago (%) - Asian
Geographical mobility - Same house 1 year ago (%) - Hispanic or Latino
Geographical mobility - Same house 1 year ago (%) - American Indian and Alaska Native
Geographical mobility - Same house 1 year ago (%) - Multirace
Geographical mobility - Same house 1 year ago (%) - Other Race
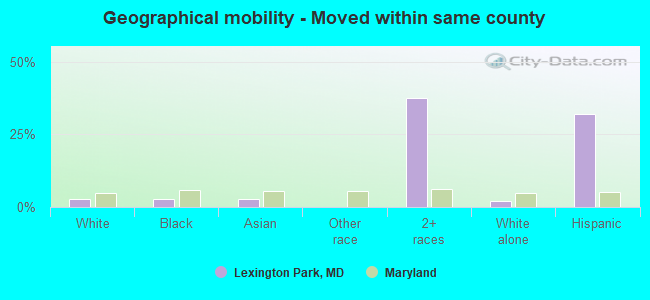
Geographical mobility - Moved within same county (%)
Geographical mobility - Moved within same county (%) - White
Geographical mobility - Moved within same county (%) - Black or African American
Geographical mobility - Moved within same county (%) - Asian
Geographical mobility - Moved within same county (%) - Hispanic or Latino
Geographical mobility - Moved within same county (%) - American Indian and Alaska Native
Geographical mobility - Moved within same county (%) - Multirace
Geographical mobility - Moved within same county (%) - Other Race
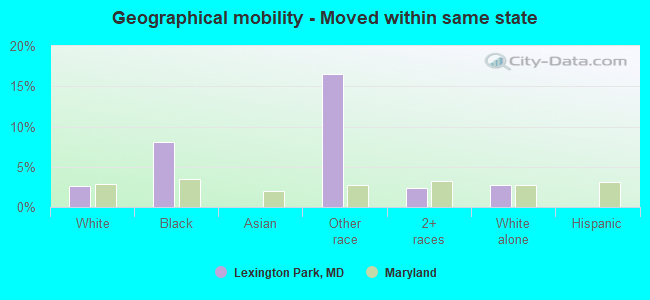
Geographical mobility - Moved from different county within same state (%)
Geographical mobility - Moved from different county within same state (%) - White
Geographical mobility - Moved from different county within same state (%) - Black or African American
Geographical mobility - Moved from different county within same state (%) - Asian
Geographical mobility - Moved from different county within same state (%) - Hispanic or Latino
Geographical mobility - Moved from different county within same state (%) - American Indian and Alaska Native
Geographical mobility - Moved from different county within same state (%) - Multirace
Geographical mobility - Moved from different county within same state (%) - Other Race
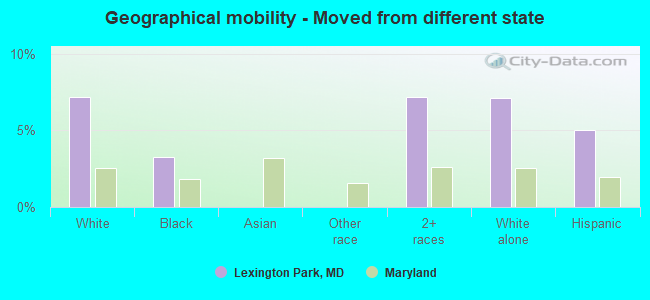
Geographical mobility - Moved from different state (%)
Geographical mobility - Moved from different state (%) - White
Geographical mobility - Moved from different state (%) - Black or African American
Geographical mobility - Moved from different state (%) - Asian
Geographical mobility - Moved from different state (%) - Hispanic or Latino
Geographical mobility - Moved from different state (%) - American Indian and Alaska Native
Geographical mobility - Moved from different state (%) - Multirace
Geographical mobility - Moved from different state (%) - Other Race
Geographical mobility - Moved from abroad (%)
Geographical mobility - Moved from abroad (%) - White
Geographical mobility - Moved from abroad (%) - Black or African American
Geographical mobility - Moved from abroad (%) - Asian
Geographical mobility - Moved from abroad (%) - Hispanic or Latino
Geographical mobility - Moved from abroad (%) - American Indian and Alaska Native
Geographical mobility - Moved from abroad (%) - Multirace
Geographical mobility - Moved from abroad (%) - Other Race
Place of birth for the foreign-born population - Ireland (%)
Place of birth for the foreign-born population - Denmark (%)
Place of birth for the foreign-born population - Norway (%)
Place of birth for the foreign-born population - Sweden (%)
Place of birth for the foreign-born population - United Kingdom (%)
Place of birth for the foreign-born population - England (%)
Place of birth for the foreign-born population - Scotland (%)
Place of birth for the foreign-born population - Other Northern Europe (%)
Place of birth for the foreign-born population - Austria (%)
Place of birth for the foreign-born population - Belgium (%)
Place of birth for the foreign-born population - France (%)
Place of birth for the foreign-born population - Germany (%)
Place of birth for the foreign-born population - Netherlands (%)
Place of birth for the foreign-born population - Switzerland (%)
Place of birth for the foreign-born population - Other Western Europe (%)
Place of birth for the foreign-born population - Greece (%)
Place of birth for the foreign-born population - Italy (%)
Place of birth for the foreign-born population - Portugal (%)
Place of birth for the foreign-born population - Spain (%)
Place of birth for the foreign-born population - Other Southern Europe (%)
Place of birth for the foreign-born population - Albania (%)
Place of birth for the foreign-born population - Belarus (%)
Place of birth for the foreign-born population - Bosnia and Herzegovina (%)
Place of birth for the foreign-born population - Bulgaria (%)
Place of birth for the foreign-born population - Croatia (%)
Place of birth for the foreign-born population - Czechoslovakia (%)
Place of birth for the foreign-born population - Hungary (%)
Place of birth for the foreign-born population - Latvia (%)
Place of birth for the foreign-born population - Lithuania (%)
Place of birth for the foreign-born population - North Macedonia (Macedonia) (%)
Place of birth for the foreign-born population - Moldova (%)
Place of birth for the foreign-born population - Poland (%)
Place of birth for the foreign-born population - Romania (%)
Place of birth for the foreign-born population - Russia (%)
Place of birth for the foreign-born population - Serbia (%)
Place of birth for the foreign-born population - Ukraine (%)
Place of birth for the foreign-born population - Other Eastern Europe (%)
Place of birth for the foreign-born population - China (%)
Place of birth for the foreign-born population - Hong Kong (%)
Place of birth for the foreign-born population - Taiwan (%)
Place of birth for the foreign-born population - Japan (%)
Place of birth for the foreign-born population - Korea (%)
Place of birth for the foreign-born population - Other Eastern Asia (%)
Place of birth for the foreign-born population - Afghanistan (%)
Place of birth for the foreign-born population - Bangladesh (%)
Place of birth for the foreign-born population - India (%)
Place of birth for the foreign-born population - Iran (%)
Place of birth for the foreign-born population - Kazakhstan (%)
Place of birth for the foreign-born population - Nepal (%)
Place of birth for the foreign-born population - Pakistan (%)
Place of birth for the foreign-born population - Sri Lanka (%)
Place of birth for the foreign-born population - Uzbekistan (%)
Place of birth for the foreign-born population - Other South Central Asia (%)
Place of birth for the foreign-born population - Burma (%)
Place of birth for the foreign-born population - Cambodia (%)
Place of birth for the foreign-born population - Indonesia (%)
Place of birth for the foreign-born population - Laos (%)
Place of birth for the foreign-born population - Malaysia (%)
Place of birth for the foreign-born population - Philippines (%)
Place of birth for the foreign-born population - Singapore (%)
Place of birth for the foreign-born population - Thailand (%)
Place of birth for the foreign-born population - Vietnam (%)
Place of birth for the foreign-born population - Other South Eastern Asia (%)
Place of birth for the foreign-born population - Armenia (%)
Place of birth for the foreign-born population - Iraq (%)
Place of birth for the foreign-born population - Israel (%)
Place of birth for the foreign-born population - Jordan (%)
Place of birth for the foreign-born population - Kuwait (%)
Place of birth for the foreign-born population - Lebanon (%)
Place of birth for the foreign-born population - Saudi Arabia (%)
Place of birth for the foreign-born population - Syria (%)
Place of birth for the foreign-born population - Turkey (%)
Place of birth for the foreign-born population - Yemen (%)
Place of birth for the foreign-born population - Other Western Asia (%)
Place of birth for the foreign-born population - Eritrea (%)
Place of birth for the foreign-born population - Ethiopia (%)
Place of birth for the foreign-born population - Kenya (%)
Place of birth for the foreign-born population - Somalia (%)
Place of birth for the foreign-born population - Uganda (%)
Place of birth for the foreign-born population - Zimbabwe (%)
Place of birth for the foreign-born population - Other Eastern Africa (%)
Place of birth for the foreign-born population - Cameroon (%)
Place of birth for the foreign-born population - Congo (%)
Place of birth for the foreign-born population - Democratic Republic of Congo (Zaire) (%)
Place of birth for the foreign-born population - Other Middle Africa (%)
Place of birth for the foreign-born population - Egypt (%)
Place of birth for the foreign-born population - Morocco (%)
Place of birth for the foreign-born population - Sudan (%)
Place of birth for the foreign-born population - Other Northern Africa (%)
Place of birth for the foreign-born population - South Africa (%)
Place of birth for the foreign-born population - Other Southern Africa (%)
Place of birth for the foreign-born population - Cabo Verde (%)
Place of birth for the foreign-born population - Ghana (%)
Place of birth for the foreign-born population - Liberia (%)
Place of birth for the foreign-born population - Nigeria (%)
Place of birth for the foreign-born population - Senegal (%)
Place of birth for the foreign-born population - Sierra Leone (%)
Place of birth for the foreign-born population - Other Western Africa (%)
Place of birth for the foreign-born population - Australia (%)
Place of birth for the foreign-born population - New Zealand (%)
Place of birth for the foreign-born population - Fiji (%)
Place of birth for the foreign-born population - Micronesia (%)
Place of birth for the foreign-born population - Bahamas (%)
Place of birth for the foreign-born population - Barbados (%)
Place of birth for the foreign-born population - Cuba (%)
Place of birth for the foreign-born population - Dominica (%)
Place of birth for the foreign-born population - Dominican Republic (%)
Place of birth for the foreign-born population - Grenada (%)
Place of birth for the foreign-born population - Haiti (%)
Place of birth for the foreign-born population - Jamaica (%)
Place of birth for the foreign-born population - St. Vincent and the Grenadines (%)
Place of birth for the foreign-born population - Trinidad and Tobago (%)
Place of birth for the foreign-born population - West Indies (%)
Place of birth for the foreign-born population - Other Caribbean (%)
Place of birth for the foreign-born population - Belize (%)
Place of birth for the foreign-born population - Costa Rica (%)
Place of birth for the foreign-born population - El Salvador (%)
Place of birth for the foreign-born population - Guatemala (%)
Place of birth for the foreign-born population - Honduras (%)
Place of birth for the foreign-born population - Mexico (%)
Place of birth for the foreign-born population - Nicaragua (%)
Place of birth for the foreign-born population - Panama (%)
Place of birth for the foreign-born population - Other Central America (%)
Place of birth for the foreign-born population - Argentina (%)
Place of birth for the foreign-born population - Bolivia (%)
Place of birth for the foreign-born population - Brazil (%)
Place of birth for the foreign-born population - Chile (%)
Place of birth for the foreign-born population - Colombia (%)
Place of birth for the foreign-born population - Ecuador (%)
Place of birth for the foreign-born population - Guyana (%)
Place of birth for the foreign-born population - Peru (%)
Place of birth for the foreign-born population - Uruguay (%)
Place of birth for the foreign-born population - Venezuela (%)
Place of birth for the foreign-born population - Other South America (%)
Place of birth for the foreign-born population - Canada (%)
Place of birth for the foreign-born population - Other Northern America (%)
Place of birth for the foreign-born population - Other (%)
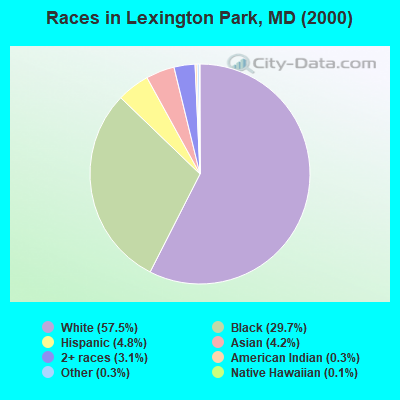
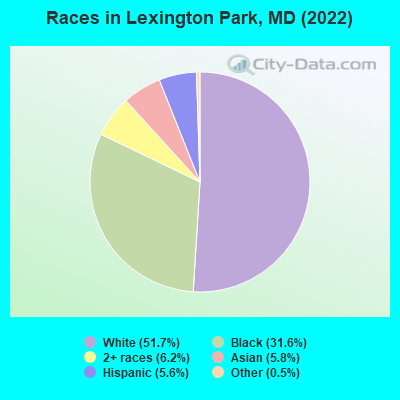
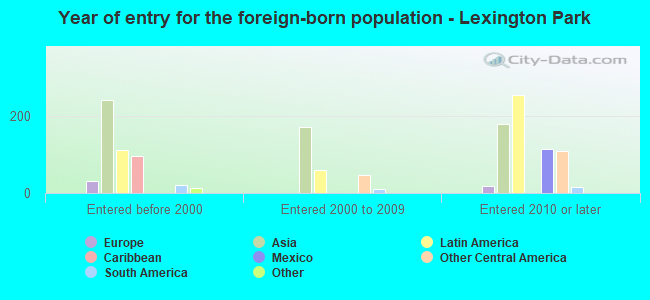
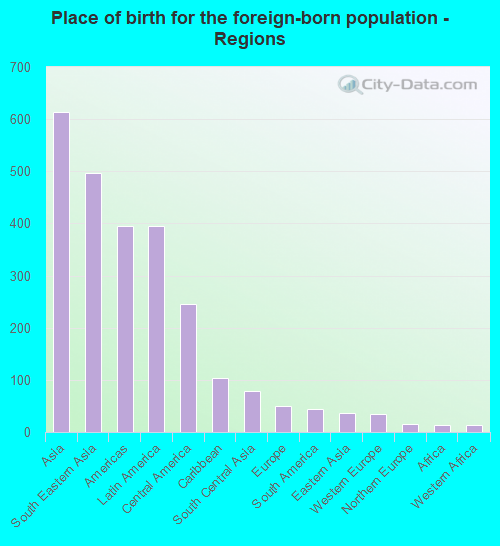
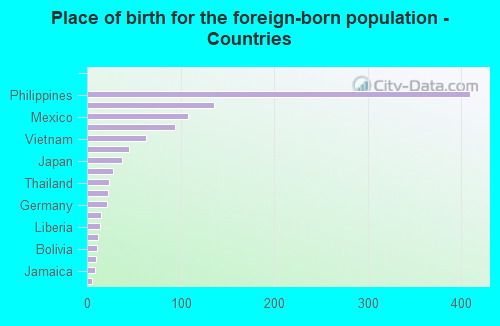
According to 2022 data, the most numerous races in Lexington Park, MD are White alone (7,066 residents), Black alone (4,319 residents), and Hispanic (771 residents). 91.1% of Lexington Park residents speak English at home. 7.9% of Lexington Park, MD residents are foreign-born (4.2% born in Asia, 2.7% born in Latin America), which is 103.7% less than the foreign-born rate of 16.0% across the entire state of Maryland.
Race distribution in Lexington Park
2000 2022
3,286,547 62.1% White alone 1,464,735 27.7% Black alone 227,916 4.3% Hispanic 209,738 4.0% Asian alone 82,946 1.6% Two or more races 13,312 0.3% American Indian alone 9,379 0.2% Other race alone 1,913 0.04% Native Hawaiian and Other
2,906,492 47.1% White alone 1,800,914 29.2% Black alone 705,842 11.4% Hispanic 401,818 6.5% Asian alone 291,317 4.7% Two or more races 46,930 0.8% Other race alone 8,930 0.1% American Indian alone 2,417 0.04% Native Hawaiian and Other
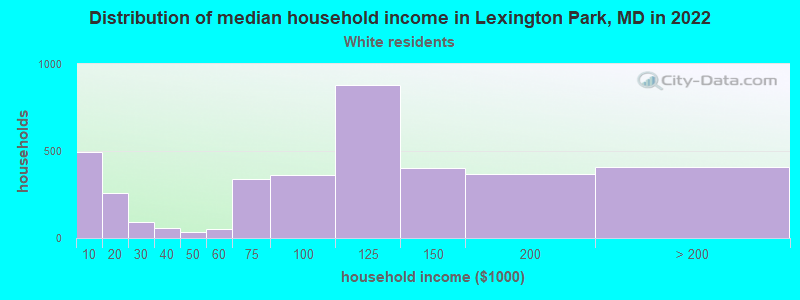
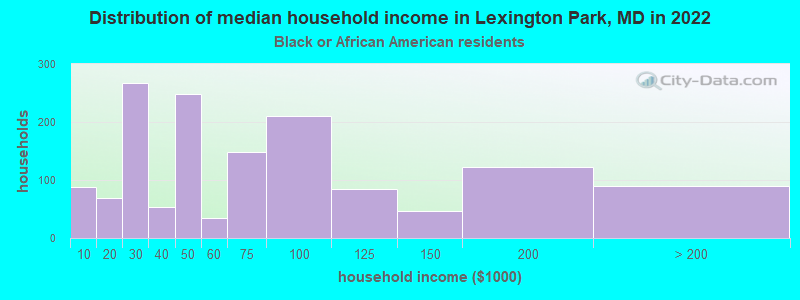
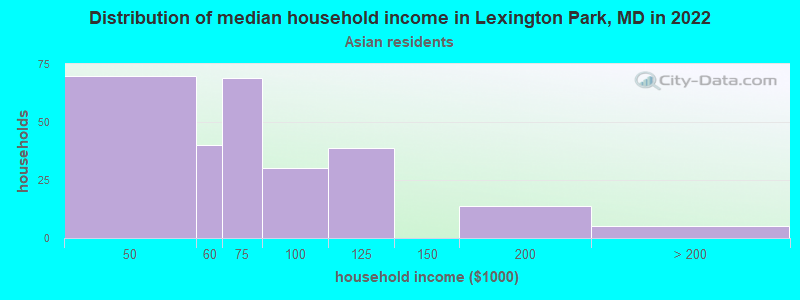
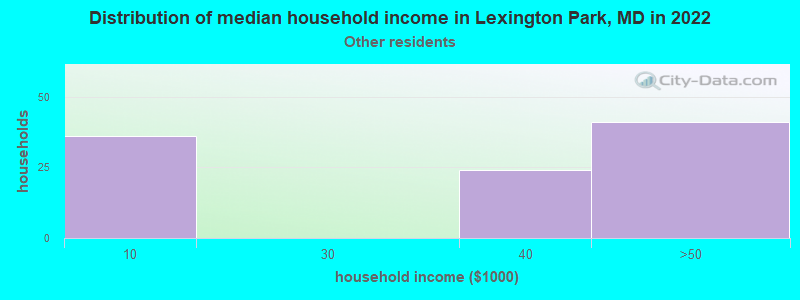
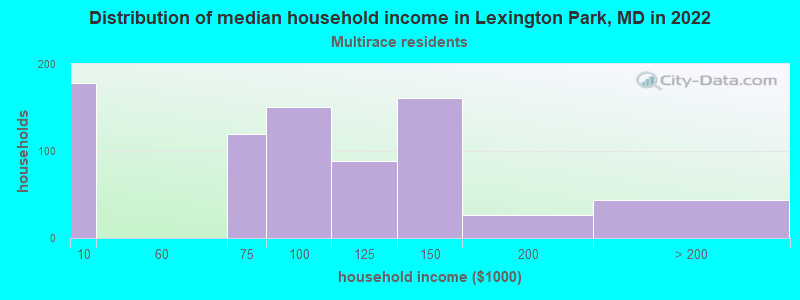
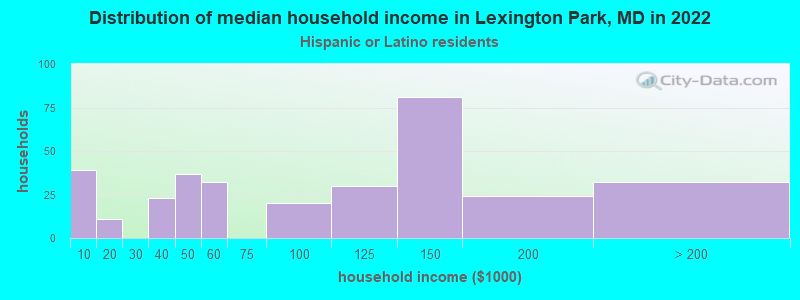
Income and house value in Lexington Park Median household income in 2022 $105,156 White non-Hispanic householders$60,355 Black householders$64,176 Asian householders$79,853 Two or more races householders$80,976 Hispanic or Latino race householdersMedian 2022 house value $315,752 White Non-Hispanic householders$244,767 Black or African American householders$492,951 American Indian or Alaska Native householders $355,714 Asian householders$409,084 Two or more races householders$404,352 Hispanic or Latino householders
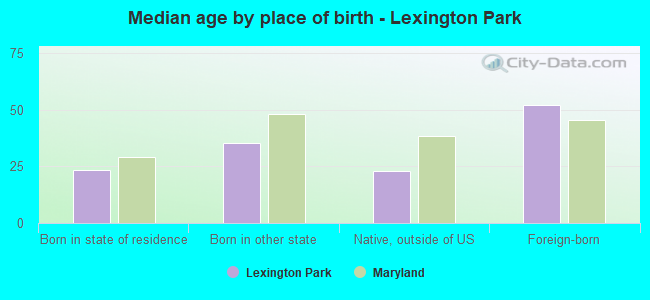
Median age by race in Lexington Park
33.2 Median age for White residents31.6 34.4 29.0 Median age for Black or African American residents37.8 25.7 -647,863,247.2 Median age for American Indian / Alaska Native residents-642,487,046.0 -676,818,950.3 44.9 Median age for Asian residents42.0 41.1 -666,666,666.0 Median age for Native Hawaiian / Pacific Islander residents-666,666,666.0 -666,666,666.0 29.0 Median age for Other race residents32.1 30.5 26.2 Median age for Two or more races residents25.9 28.1 33.3 Median age for White alone residents31.2 34.7 33.1 Median age for Hispanic or Latino residents34.4 29.4
Owner/renter occupied households by race in Lexington Park
House owners and renters - White residents 1,926 56.2% Owner occupied1,498 43.8% Renter occupiedHouse owners and renters - Black or African American residents 466 26.4% Owner occupied1,297 73.6% Renter occupiedHouse owners and renters - Asian residents 125 35.6% Owner occupied226 64.4% Renter occupiedHouse owners and renters - Other race residents 45 30.7% Owner occupied102 69.3% Renter occupiedHouse owners and renters - Two or more races residents 267 45.1% Owner occupied325 54.9% Renter occupiedHouse owners and renters - White alone residents 1,871 56.0% Owner occupied1,469 44.0% Renter occupiedHouse owners and renters - Hispanic or Latino residents 208 50.4% Owner occupied204 49.6% Renter occupied
Language usage in Lexington Park
English speakers - Total 91.1% of residents of Lexington Park speak English at home.
2.8% of residents speak Spanish at home 152 43.1% Speak English very well201 56.9% Speak English less than very well6.6% of residents speak other language at home 362 43.9% Speak English very well463 56.1% Speak English less than very well
English speakers - Born in the United States 95.3% of residents of Lexington Park speak English at home.
0.8% of residents speak Spanish at home 49 100.0% Speak English very well2.4% of residents speak other language at home 116 75.8% Speak English very well37 24.2% Speak English less than very well
English speakers - Native, born elsewhere 85.2% of residents of Lexington Park speak English at home.
13.3% of residents speak Spanish at home 35 100.0% Speak English very well
English speakers - Foreign-born 31.1% of residents of Lexington Park speak English at home.
18.7% of residents speak Spanish at home 45 36.0% Speak English very well80 64.0% Speak English less than very well65.9% of residents speak other language at home 189 42.9% Speak English very well252 57.1% Speak English less than very well
White (Caucasian) - Speak only English Native:
96.5% (6,453)Foreign-born:
27.0% (31)
White (Caucasian) - Speak another language Native:
2.7% (179)Foreign-born:
57.6% (65)
Black or African American - Speak only English Native:
98.3% (3,348)Foreign-born:
96.8% (120)
Asian - Speak only English Native:
68.6% (136)Foreign-born:
30.6% (180)
Asian - Speak another language Native:
30.2% (60)Foreign-born:
71.6% (420)
Two or more races - Speak only English Native:
90.1% (1,133)Foreign-born:
25.3% (16)
Two or more races - Speak another language Native:
9.0% (113)Foreign-born:
74.6% (46)
White alone - Speak only English Native:
96.6% (6,374)Foreign-born:
67.1% (16)
White alone - Speak another language Native:
2.0% (132)Foreign-born:
85.0% (20)
Hispanic or Latino - Speak only English Native:
63.6% (265)Foreign-born:
15.8% (28)
Hispanic or Latino - Speak another language Native:
35.9% (150)Foreign-born:
84.3% (149)
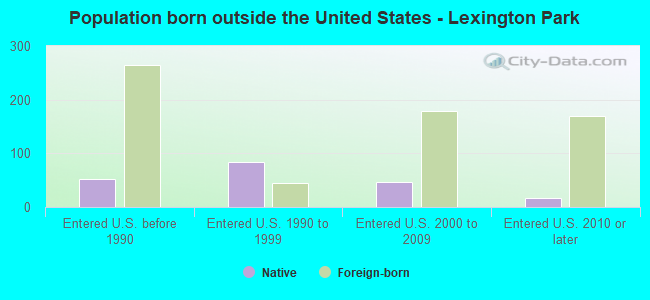
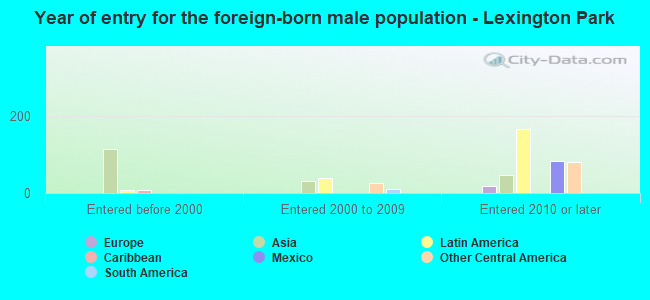
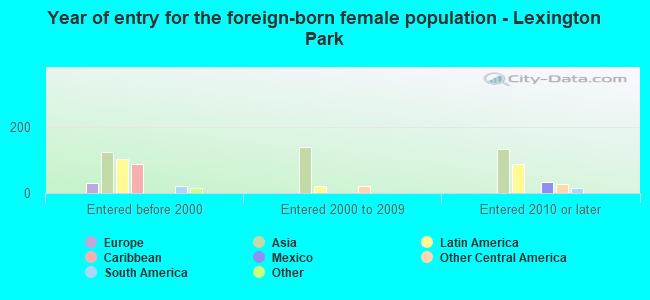
Foreign-born residents in Lexington Park 1,073 residents are foreign born (4.2% Asia , 2.7% Latin America ).
This city:
7.9%Maryland:
15.7%
Marital status for residents in Lexington Park Marital status - White (Caucasian) population 15 years and over
Males 47.7% Never married40.3% Now married0.0% Separated3.6% Widowed8.5% DivorcedFemales 46.9% Never married39.5% Now married0.5% Separated3.7% Widowed9.3% DivorcedWomen who gave birth in the past 12 months Now married:
82.9% (62)Unmarried:
17.1% (13)
Women who did not give birth in the past 12 months Now married:
35.1% (753)Unmarried:
64.9% (1,394)
Marital status - Black or African American population 15 years and over
Males 51.3% Never married33.4% Now married2.1% Separated2.8% Widowed10.5% DivorcedFemales 58.4% Never married24.9% Now married2.2% Separated1.2% Widowed13.4% DivorcedWomen who gave birth in the past 12 months Now married:
29.8% (59)Unmarried:
70.2% (139)
Women who did not give birth in the past 12 months Now married:
24.4% (247)Unmarried:
75.6% (765)
Marital status - Asian population 15 years and over
Males 42.6% Never married48.8% Now married0.0% Separated0.0% Widowed8.6% DivorcedFemales 27.0% Never married55.9% Now married0.0% Separated9.6% Widowed7.5% DivorcedWomen who gave birth in the past 12 months Now married:
100.0% (11)Unmarried:
0.0% (0)
Women who did not give birth in the past 12 months Now married:
55.8% (173)Unmarried:
44.2% (137)
Marital status - Other race population 15 years and over
Males 73.8% Never married26.2% Now married0.0% Separated0.0% Widowed0.0% DivorcedFemales 0.0% Never married40.4% Now married0.0% Separated0.0% Widowed59.6% DivorcedWomen who did not give birth in the past 12 months Now married:
40.4% (29)Unmarried:
59.6% (43)
Marital status - Two or more races population 15 years and over
Males 76.8% Never married21.3% Now married2.0% Separated0.0% Widowed0.0% DivorcedFemales 35.4% Never married33.8% Now married24.7% Separated0.0% Widowed6.1% DivorcedWomen who gave birth in the past 12 months Now married:
100.0% (7)Unmarried:
0.0% (0)
Women who did not give birth in the past 12 months Now married:
57.5% (329)Unmarried:
42.5% (243)
Marital status - White alone, not Hispanic / Latino population 15 years and over
Males 46.9% Never married40.4% Now married0.0% Separated3.8% Widowed8.9% DivorcedFemales 46.9% Never married39.2% Now married0.5% Separated3.8% Widowed9.5% DivorcedWomen who gave birth in the past 12 months Now married:
82.9% (63)Unmarried:
17.1% (13)
Women who did not give birth in the past 12 months Now married:
35.0% (746)Unmarried:
65.0% (1,385)
Marital status - Hispanic or Latino population 15 years and over
Males 68.6% Never married31.4% Now married0.0% Separated0.0% Widowed0.0% DivorcedFemales 50.0% Never married41.4% Now married6.1% Separated0.0% Widowed2.5% DivorcedWomen who gave birth in the past 12 months Now married:
100.0% (8)Unmarried:
0.0% (0)
Women who did not give birth in the past 12 months Now married:
36.1% (73)Unmarried:
63.9% (130)
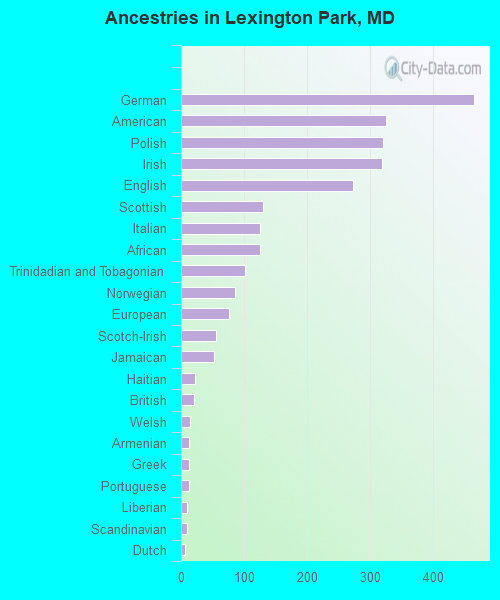
Ancestries in Lexington Park
466 7.7% German325 5.4% American321 5.3% Polish320 5.3% Irish274 4.5% English130 2.2% Scottish126 2.1% Italian126 2.1% African101 1.7% Trinidadian and Tobagonian85 1.4% Norwegian77 1.3% European55 0.9% Scotch-Irish53 0.9% Jamaican23 0.4% Haitian20 0.3% British14 0.2% Welsh13 0.2% Armenian13 0.2% Greek12 0.2% Portuguese10 0.2% Liberian9 0.1% Scandinavian7 0.1% Dutch
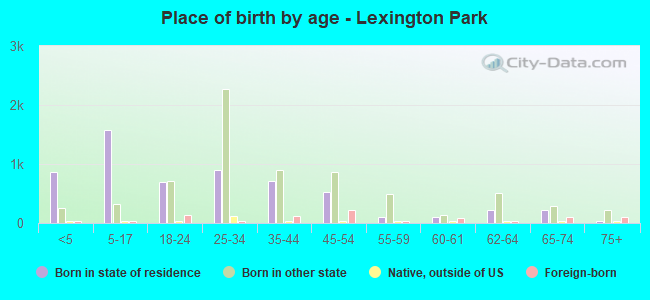
Children Nativity (place of birth) in Lexington Park
Children under 6 years - Living with two parents Both parents native 662 100.0% NativeOne native, one foreign-born parent 34 100.0% NativeChildren under 6 years - Living with one parent Native parent 514 100.0% NativeChildren 6 to 17 years - Living with two parents Both parents native 766 100.0% Native0 0.0% Foreign-bornBoth parents foreign-born 21 100.0% Foreign-bornOne native, one foreign-born parent 47 100.0% NativeChildren 6 to 17 years - Living with one parent Native parent 776 96.8% Native26 3.2% Foreign-bornForeign-born parent 46 79.4% Native12 20.6% Foreign-born
Grandparents responsible for own grandchildren in Lexington Park
Grandparents (30 to 59 years) White / Caucasian 21 100.0% Not responsible for grandchildrenBlack or African American 89 74.0% Responsible for grandchildren31 26.0% Not responsible for grandchildrenWhite alone, not Hispanic / Latino 23 100.0% Not responsible for grandchildren
Grandparents (60 years and over) White / Caucasian 213 100.0% Not responsible for grandchildrenBlack or African American 64 100.0% Not responsible for grandchildrenWhite alone, not Hispanic / Latino 228 100.0% Not responsible for grandchildren