Races in Lexington, Virginia (VA) Detailed Stats
Ancestries, Foreign-born residents, place of birth
Settings
X


Recent posts about races in Lexington, Virginia on our local forum with over 2,400,000 registered users:
 | Most Conservative Areas (118 replies) |
| Relocating for VA homestead/farmstead (56 replies) |
| Lexington area move (6 replies) |
| Lexington, Staunton, or Richmond? (13 replies) |
| Fair Warning Relocation (117 replies) |
| Prices for beautiful old country estates low for a reason? (35 replies) |
Latest news about races in Lexington, VA collected exclusively by city-data.com from local newspapers, TV, and radio stations
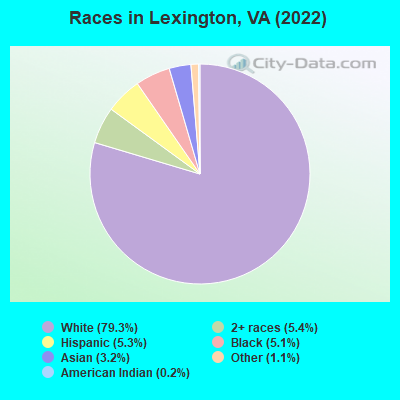
According to 2022 data, the most numerous races in Lexington, VA are White alone (5,864 residents), Black alone (378 residents), and Hispanic (390 residents). 91.5% of Lexington residents speak English at home. 4.6% of Lexington, VA residents are foreign-born (2.8% born in Asia, 1.5% born in Europe), which is 159.5% less than the foreign-born rate of 12.0% across the entire state of Virginia.
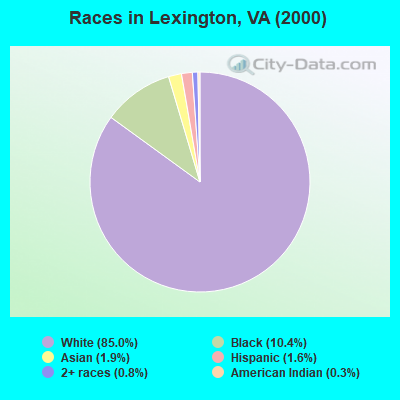
Race distribution in Lexington
2000
2022

- 5,83785.0%White alone
- 71310.4%Black alone
- 1301.9%Asian alone
- 1091.6%Hispanic
- 560.8%Two or more races
- 180.3%American Indian alone
- 30.04%Other race alone
- 10.01%Native Hawaiian and Other
Pacific Islander alone
-
- 5,86479.3%White alone
- 3985.4%Two or more races
- 3905.3%Hispanic
- 3785.1%Black alone
- 2373.2%Asian alone
- 831.1%Other race alone
- 180.2%American Indian alone
2000
2022
-
- 4,965,63770.2%White alone
- 1,376,37819.4%Black alone
- 329,5404.7%Hispanic
- 259,2773.7%Asian alone
- 114,0221.6%Two or more races
- 18,5960.3%American Indian alone
- 11,6850.2%Other race alone
- 3,3800.05%Native Hawaiian and Other
Pacific Islander alone

-
- 5,095,13058.7%White alone
- 1,594,78518.4%Black alone
- 905,75010.4%Hispanic
- 602,8816.9%Asian alone
- 406,0474.7%Two or more races
- 60,4190.7%Other race alone
- 11,7380.1%American Indian alone
- 6,8690.08%Native Hawaiian and Other
Pacific Islander alone

Income and house value in Lexington
- Median household income in 2022
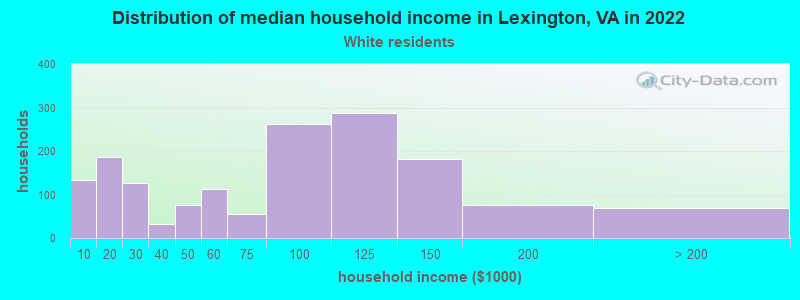
- $90,894White non-Hispanic householders
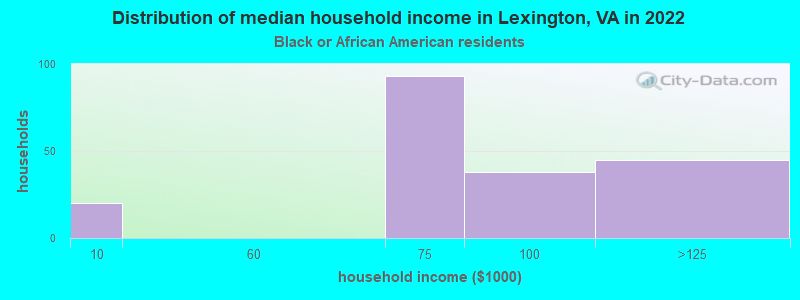
- $73,394Black householders
- $97,293Two or more races householders
- Median 2022 house value
- $269,773White Non-Hispanic householders
- $133,768Black or African American householders
- $121,099American Indian or Alaska Native householders
Household income for White non-Hispanic householders
Household income for Black householders
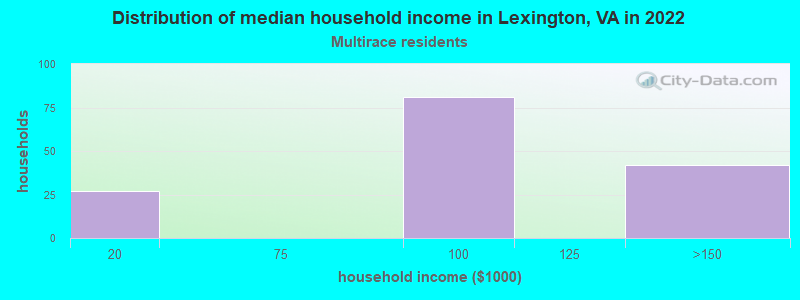
Household income for Two or more races householders
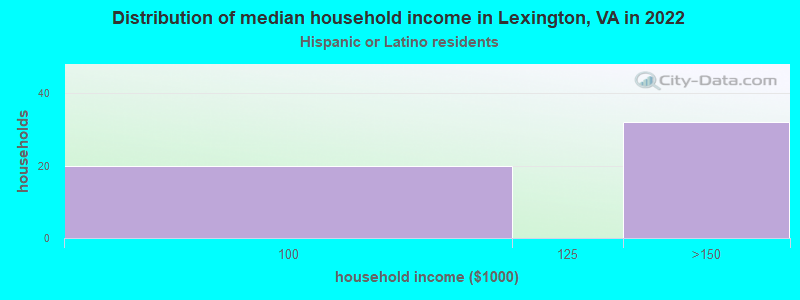
Household income for Hispanic or Latino race householders
Median age by race in Lexington
- 22.7Median age for White residents
- 22.0Males
- 25.8Females
- 48.5Median age for Black or African American residents
- 37.9Males
- 48.9Females
- 22.4Median age for American Indian / Alaska Native residents
- -682,352,940.5Males
- -687,861,271.0Females
- 22.6Median age for Asian residents
- 23.0Males
- 21.0Females
- -611,955,419.9Median age for Native Hawaiian / Pacific Islander residents
- -541,531,822.5Males
- -714,150,046.8Females
- -680,272,108.2Median age for Other race residents
- -673,400,672.7Males
- -687,285,222.7Females
- 23.3Median age for Two or more races residents
- 22.5Males
- 29.7Females
- 22.6Median age for White alone residents
- 21.9Males
- 25.4Females
- 21.3Median age for Hispanic or Latino residents
- 20.8Males
- 28.3Females
Owner/renter occupied households by race in Lexington
- House owners and renters - White residents
- 82652.9%Owner occupied
- 73447.1%Renter occupied
- House owners and renters - Black or African American residents
- 10453.6%Owner occupied
- 9046.4%Renter occupied
- House owners and renters - Asian residents
- 48100.0%Renter occupied
- House owners and renters - Other race residents
- 75100.0%Owner occupied
- House owners and renters - Two or more races residents
- 10066.5%Owner occupied
- 5033.5%Renter occupied
- House owners and renters - White alone residents
- 83952.5%Owner occupied
- 75947.5%Renter occupied
- House owners and renters - Hispanic or Latino residents
- 3058.9%Owner occupied
- 2141.1%Renter occupied
Language usage in Lexington
- English speakers - Total
- 91.5% of residents of Lexington speak English at home.
- 3.9% of residents speak Spanish at home
- 26493.3%Speak English very well
- 196.7%Speak English less than very well
- 4.5% of residents speak other language at home
- 13541.9%Speak English very well
- 18758.1%Speak English less than very well
- English speakers - Born in the United States
- 94.3% of residents of Lexington speak English at home.
- 3.1% of residents speak Spanish at home
- 12395.3%Speak English very well
- 64.7%Speak English less than very well
- 2.4% of residents speak other language at home
- 4444.0%Speak English very well
- 5656.0%Speak English less than very well
- English speakers - Native, born elsewhere
- 77.0% of residents of Lexington speak English at home.
- 21.9% of residents speak Spanish at home
- 59100.0%Speak English very well
- English speakers - Foreign-born
- 26.5% of residents of Lexington speak English at home.
- 11.1% of residents speak Spanish at home
- 38100.0%Speak English very well
- 64.1% of residents speak other language at home
- 9040.9%Speak English very well
- 13059.1%Speak English less than very well
White (Caucasian) - Speak only English
| Native: | 97.5% (5,535) |
| Foreign-born: | 55.8% (43) |
White (Caucasian) - Speak another language
| Native: | 2.6% (149) |
| Foreign-born: | 50.4% (39) |
American Indian / Alaska Native - Speak another language
| Native: | 42.6% (14) |
| Foreign-born: | 100.0% (9) |
Asian - Speak another language
| Native: | 38.0% (20) |
| Foreign-born: | 98.9% (185) |
Two or more races - Speak only English
| Native: | 87.2% (451) |
| Foreign-born: | 94.7% (54) |
White alone - Speak only English
| Native: | 98.2% (5,509) |
| Foreign-born: | 60.1% (46) |
White alone - Speak another language
| Native: | 1.8% (102) |
| Foreign-born: | 37.4% (29) |
Hispanic or Latino - Speak another language
| Native: | 58.9% (216) |
| Foreign-born: | 99.6% (37) |
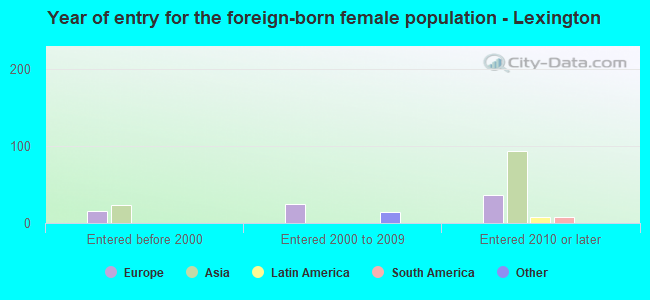
Foreign-born residents in Lexington
342 residents are foreign born (2.8% Asia, 1.5% Europe).
| This city: | 4.6% |
| Virginia: | 12.6% |

Marital status for residents in Lexington
Marital status - White (Caucasian) population 15 years and over
- Males
- 70.6%Never married
- 24.6%Now married
- 1.0%Separated
- 1.3%Widowed
- 2.5%Divorced
- Females
- 55.0%Never married
- 26.8%Now married
- 0.9%Separated
- 8.0%Widowed
- 9.3%Divorced
Women who gave birth in the past 12 months
| Now married: | 47.9% (33) |
| Unmarried: | 52.1% (36) |
Women who did not give birth in the past 12 months
| Now married: | 17.2% (239) |
| Unmarried: | 82.8% (1,150) |
Marital status - Black or African American population 15 years and over
- Males
- 53.2%Never married
- 14.6%Now married
- 21.0%Separated
- 0.0%Widowed
- 11.2%Divorced
- Females
- 50.3%Never married
- 15.4%Now married
- 0.0%Separated
- 25.1%Widowed
- 9.1%Divorced
Women who did not give birth in the past 12 months
| Now married: | 17.8% (19) |
| Unmarried: | 82.2% (87) |
Marital status - American Indian / Alaska Native population 15 years and over
- Males
- 100.0%Never married
- 0.0%Now married
- 0.0%Separated
- 0.0%Widowed
- 0.0%Divorced
- Females
- 100.0%Never married
- 0.0%Now married
- 0.0%Separated
- 0.0%Widowed
- 0.0%Divorced
Women who did not give birth in the past 12 months
| Now married: | 0.0% (0) |
| Unmarried: | 100.0% (6) |
Marital status - Asian population 15 years and over
- Males
- 72.6%Never married
- 27.4%Now married
- 0.0%Separated
- 0.0%Widowed
- 0.0%Divorced
- Females
- 100.0%Never married
- 0.0%Now married
- 0.0%Separated
- 0.0%Widowed
- 0.0%Divorced
Women who did not give birth in the past 12 months
| Now married: | 0.0% (0) |
| Unmarried: | 100.0% (129) |
Marital status - Two or more races population 15 years and over
- Males
- 54.8%Never married
- 36.9%Now married
- 0.0%Separated
- 0.0%Widowed
- 8.3%Divorced
- Females
- 43.1%Never married
- 53.0%Now married
- 0.0%Separated
- 3.9%Widowed
- 0.0%Divorced
Women who gave birth in the past 12 months
| Now married: | 100.0% (18) |
| Unmarried: | 0.0% (0) |
Women who did not give birth in the past 12 months
| Now married: | 29.6% (40) |
| Unmarried: | 70.4% (94) |
Marital status - White alone, not Hispanic / Latino population 15 years and over
- Males
- 69.3%Never married
- 25.6%Now married
- 1.1%Separated
- 1.3%Widowed
- 2.6%Divorced
- Females
- 54.1%Never married
- 27.3%Now married
- 0.9%Separated
- 8.1%Widowed
- 9.5%Divorced
Women who gave birth in the past 12 months
| Now married: | 47.9% (34) |
| Unmarried: | 52.1% (37) |
Women who did not give birth in the past 12 months
| Now married: | 17.7% (248) |
| Unmarried: | 82.3% (1,150) |
Marital status - Hispanic or Latino population 15 years and over
- Males
- 92.5%Never married
- 0.0%Now married
- 0.0%Separated
- 0.0%Widowed
- 7.5%Divorced
- Females
- 69.8%Never married
- 30.2%Now married
- 0.0%Separated
- 0.0%Widowed
- 0.0%Divorced
Women who did not give birth in the past 12 months
| Now married: | 30.2% (31) |
| Unmarried: | 69.8% (71) |
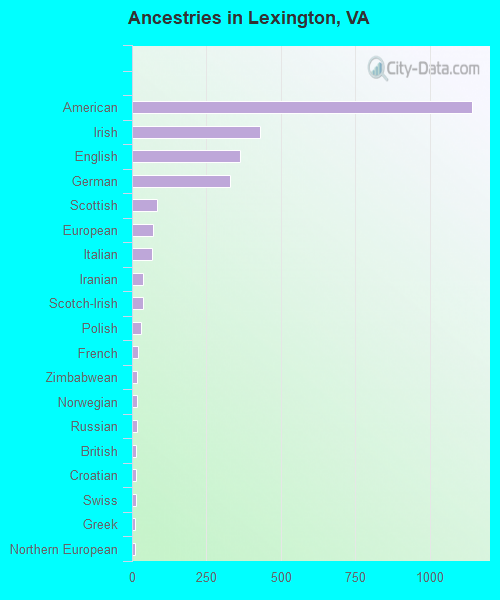
Ancestries in Lexington

- 1,14133.3%American
- 42912.5%Irish
- 36310.6%English
- 3289.6%German
- 852.5%Scottish
- 702.0%European
- 661.9%Italian
- 361.1%Iranian
- 361.1%Scotch-Irish
- 310.9%Polish
- 200.6%French
- 180.5%Zimbabwean
- 170.5%Norwegian
- 160.5%Russian
- 150.4%British
- 130.4%Croatian
- 120.4%Swiss
- 110.3%Greek
- 110.3%Northern European
- 90.3%Canadian
- 70.2%Haitian
- 30.09%Eastern European
- 20.06%Syrian
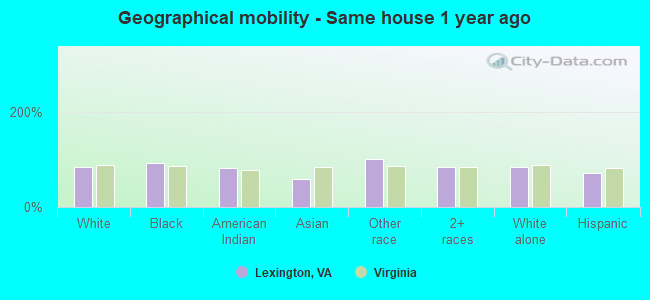
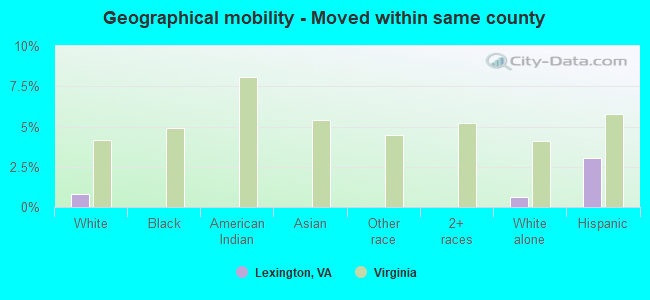
Geographical mobility in Lexington

- Same house 1 year ago
- 4,78382.7%White (Caucasian)
- 35393.4%Black or African American
- 3581.3%American Indian / Alaska Native
- 14259.4%Asian
- 155100.0%Other race
- 48884.3%Two or more races
- 4,82883.4%White alone, not Hispanic / Latino
- 27971.6%Hispanic or Latino
-
- Moved within same county
- 450.8%White / Caucasian
- 370.6%White alone, not Hispanic / Latino
- 123.1%Hispanic or Latino
-
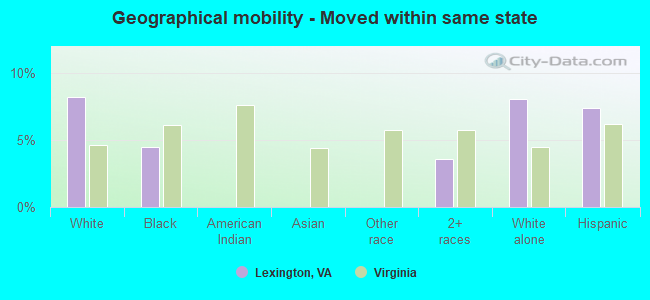
- Moved within same state
- 4758.2%White / Caucasian
- 174.5%Black or African American
- 213.6%Two or more races
- 4648.0%White alone, not Hispanic / Latino
- 297.4%Hispanic or Latino
-
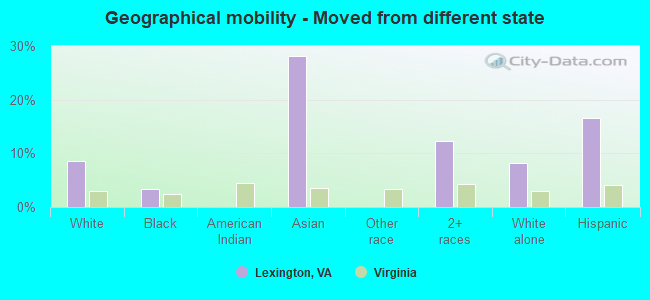
- Moved from different state
- 4988.6%White / Caucasian
- 133.4%Black or African American
- 6728.2%Asian
- 7112.3%Two or more races
- 4788.3%White alone, not Hispanic / Latino
- 6516.6%Hispanic or Latino
-
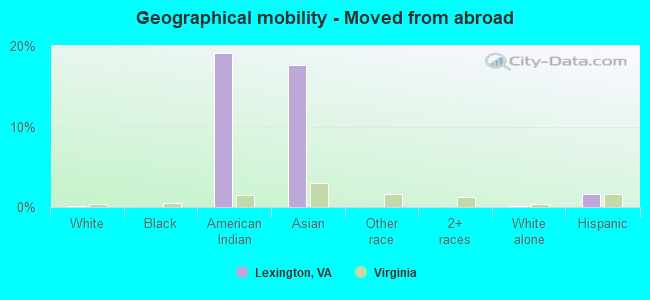
- Moved from abroad
- 70.1%White
- 819.2%American Indian / Alaska Native
- 4217.7%Asian
- 80.1%White alone, not Hispanic / Latino
- 61.6%Hispanic or Latino
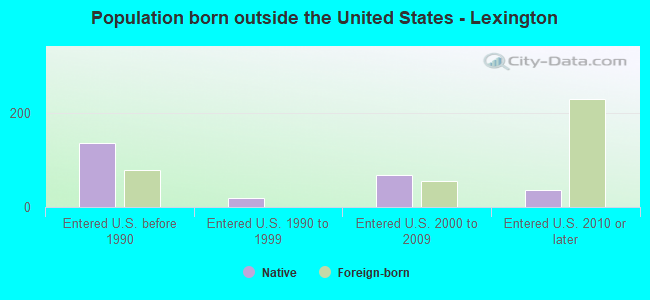
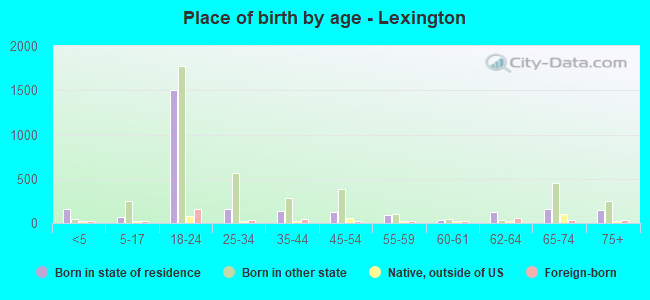
Children Nativity (place of birth) in Lexington
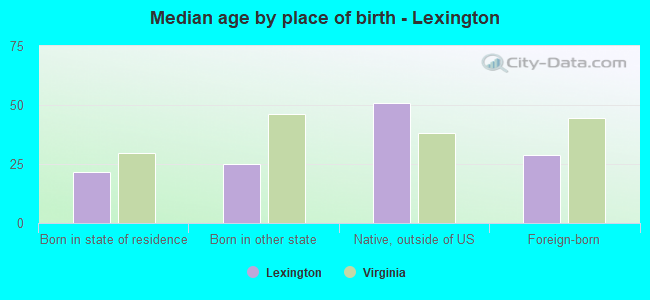
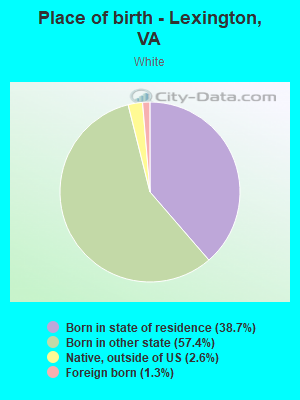
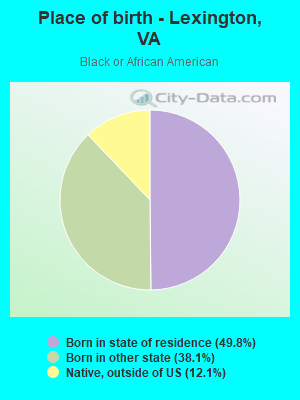
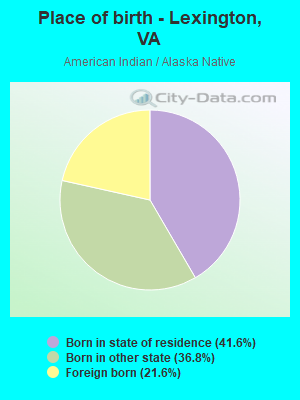
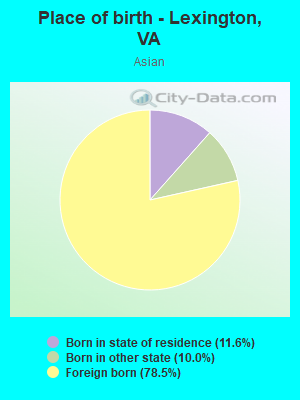
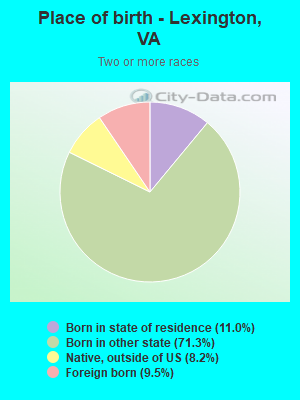
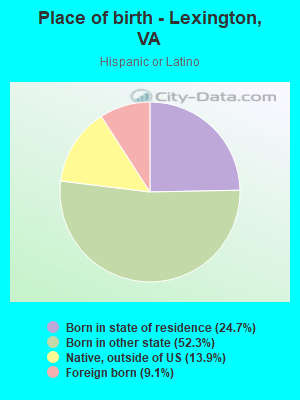
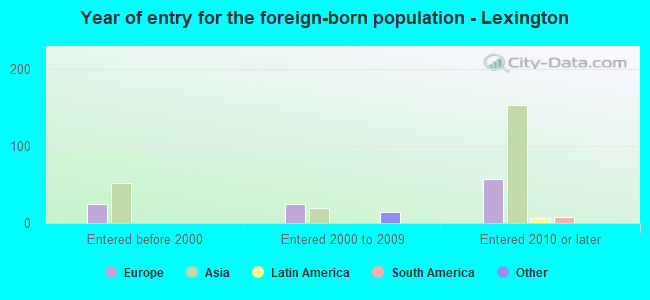
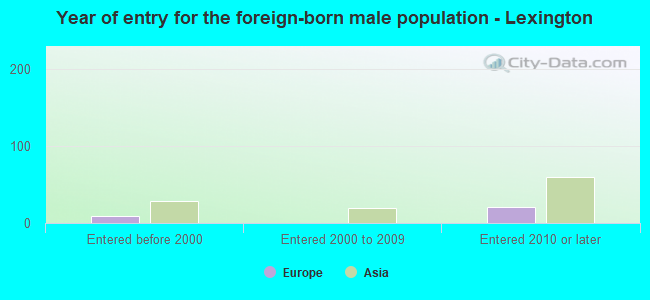
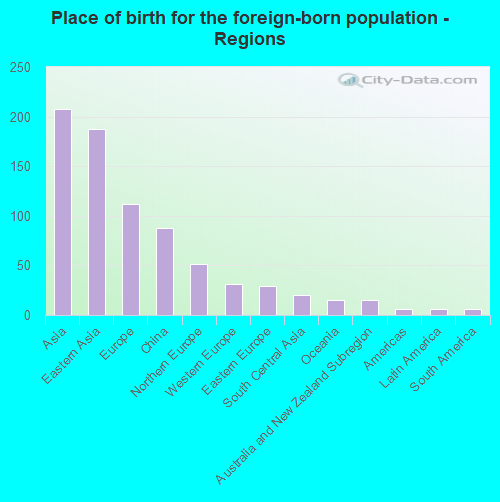
Place of birth for residents in Lexington
![Place of birth for the foreign-born population - Regions]()
- 208Asia
- 188Eastern Asia
- 112Europe
- 88China
- 51Northern Europe
- 31Western Europe
- 29Eastern Europe
- 20South Central Asia
- 15Oceania
- 15Australia and New Zealand Subregion
- 6Americas
- 6Latin America
- 6South America
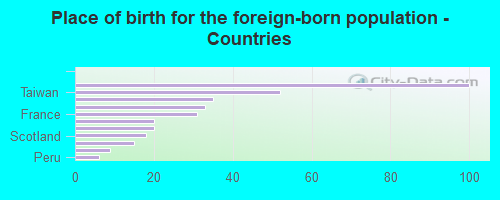
![Place of birth for the foreign-born population - Countries]()
- 100Japan
- 52Taiwan
- 35China
- 33England
- 31France
- 20Russia
- 20Pakistan
- 18Scotland
- 15Australia
- 9Belarus
- 6Peru
Grandparents responsible for own grandchildren in Lexington
Zip codes: 24450.