Races in Lihue, Hawaii (HI) Detailed Stats
Ancestries, Foreign-born residents, place of birth
Settings
X


Recent posts about races in Lihue, Hawaii on our local forum with over 2,400,000 registered users:
 | Looking for a room to rent or roommate to rent a house/apt close to poipu (4 replies) |
| Coming to Kauai for 10 days in June - Staying all 10 days in Princeville a mistake? (7 replies) |
| 9 Days in Kauai... Tips? (17 replies) |
| Areas in Kauai like Kula in Maui? (3 replies) |
| Kuali without a car (9 replies) |
| How bad is the flooding on Kauai? (13 replies) |
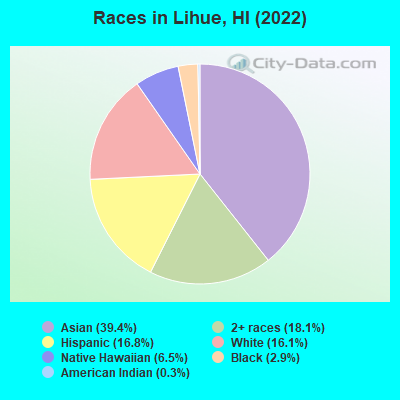
According to 2022 data, the most numerous races in Lihue, HI are Asian alone (3,419 residents), Two or more races (1,571 residents), and White alone (1,394 residents). 80.6% of Lihue residents speak English at home. 18.4% of Lihue, HI residents are foreign-born (15.5% born in Asia), which is 2.4% greater than the foreign-born rate of 18.0% across the entire state of Hawaii.
Race distribution in Lihue
2000
2022

- 2,72948.1%Asian alone
- 1,21821.5%White alone
- 98417.3%Two or more races
- 3706.5%Hispanic
- 3456.1%Native Hawaiian and Other
Pacific Islander alone - 120.2%Black alone
- 110.2%Other race alone
- 50.09%American Indian alone

-
- 3,41939.4%Asian alone
- 1,57118.1%Two or more races
- 1,45616.8%Hispanic
- 1,39416.1%White alone
- 5646.5%Native Hawaiian and Other
Pacific Islander alone - 2532.9%Black alone
- 300.3%American Indian alone
2000
2022
-
- 494,14940.8%Asian alone
- 277,09122.9%White alone
- 218,70018.1%Two or more races
- 108,4419.0%Native Hawaiian and Other
Pacific Islander alone - 87,6997.2%Hispanic
- 20,8291.7%Black alone
- 2,0890.2%Other race alone
- 2,5390.2%American Indian alone

-
- 498,12534.6%Asian alone
- 318,57422.1%Two or more races
- 297,93720.7%White alone
- 160,10311.1%Hispanic
- 134,5679.3%Native Hawaiian and Other
Pacific Islander alone - 23,6821.6%Black alone
- 5,3780.4%Other race alone
- 1,8300.1%American Indian alone

Income and house value in Lihue
- Median household income in 2022
- $65,036White non-Hispanic householders
- $163,218Black householders
- $81,440Asian householders
- $67,462Native Hawaiian and other Pacific Islander householders
- $98,590Two or more races householders
- $144,521Hispanic or Latino race householders
- Median 2022 house value
- over $1,000,000White Non-Hispanic householders
- $931,727Asian householders
- $817,304Native Hawaiian and other Pacific Islander householders
- over $1,000,000Two or more races householders
- $817,304Hispanic or Latino householders
Household income for White non-Hispanic householders

Household income for Black householders

Household income for Asian householders

Household income for Native Hawaiian and other Pacific Islander householders

Household income for Two or more races householders

Household income for Hispanic or Latino race householders

Median age by race in Lihue
- 66.6Median age for White residents
- 61.2Males
- 68.0Females
- 32.3Median age for Black or African American residents
- 33.1Males
- -717,439,292.9Females
- -711,949,684.8Median age for American Indian / Alaska Native residents
- -709,178,743.3Males
- -1,409,683,425.0Females
- 51.9Median age for Asian residents
- 52.3Males
- 51.8Females
- 23.3Median age for Native Hawaiian / Pacific Islander residents
- 11.4Males
- 43.7Females
- 27.5Median age for Other race residents
- -662,121,211.5Males
- 36.0Females
- 18.8Median age for Two or more races residents
- 13.5Males
- 29.2Females
- 65.5Median age for White alone residents
- 61.5Males
- 66.1Females
- 16.9Median age for Hispanic or Latino residents
- 13.5Males
- 28.8Females
Owner/renter occupied households by race in Lihue
- House owners and renters - White residents
- 44154.4%Owner occupied
- 37045.6%Renter occupied
- House owners and renters - Black or African American residents
- 115100.0%Renter occupied
- House owners and renters - American Indian / Alaska Native residents
- 9100.0%Renter occupied
- House owners and renters - Asian residents
- 84677.6%Owner occupied
- 24422.4%Renter occupied
- House owners and renters - Native Hawaiian / Pacific Islander residents
- 4126.5%Owner occupied
- 11473.5%Renter occupied
- House owners and renters - Two or more races residents
- 37158.0%Owner occupied
- 26942.0%Renter occupied
- House owners and renters - White alone residents
- 44754.9%Owner occupied
- 36845.1%Renter occupied
- House owners and renters - Hispanic or Latino residents
- 11764.6%Owner occupied
- 6435.4%Renter occupied
Language usage in Lihue
- English speakers - Total
- 80.6% of residents of Lihue speak English at home.
- 2.5% of residents speak Spanish at home
- 14571.1%Speak English very well
- 5928.9%Speak English less than very well
- 17.2% of residents speak other language at home
- 68649.6%Speak English very well
- 69750.4%Speak English less than very well
- English speakers - Born in the United States
- 93.9% of residents of Lihue speak English at home.
- 5.3% of residents speak Spanish at home
- 123100.0%Speak English very well
- 0.7% of residents speak other language at home
- 1270.6%Speak English very well
- 529.4%Speak English less than very well
All residents speak only English at home
- English speakers - Foreign-born
- 12.2% of residents of Lihue speak English at home.
- 5.5% of residents speak Spanish at home
- 2328.4%Speak English very well
- 5871.6%Speak English less than very well
- 82.2% of residents speak other language at home
- 52943.4%Speak English very well
- 69156.6%Speak English less than very well
White (Caucasian) - Speak only English
| Native: | 100.0% (1,342) |
| Foreign-born: | 19.4% (8) |
White (Caucasian) - Speak another language
| Native: | 0.6% (8) |
| Foreign-born: | 89.5% (39) |
Black or African American - Speak only English
| Native: | 100.0% (131) |
| Foreign-born: | 100.0% (21) |
Asian - Speak only English
| Native: | 89.1% (1,781) |
| Foreign-born: | 9.0% (127) |
Asian - Speak another language
| Native: | 9.5% (190) |
| Foreign-born: | 91.5% (1,295) |
Native Hawaiian / Pacific Islander - Speak another language
| Native: | 0.8% (4) |
| Foreign-born: | 100.0% (25) |
Two or more races - Speak another language
| Native: | 7.6% (190) |
| Foreign-born: | 98.8% (61) |
White alone - Speak only English
| Native: | 99.8% (1,308) |
| Foreign-born: | 22.6% (9) |
White alone - Speak another language
| Native: | 0.7% (9) |
| Foreign-born: | 76.2% (30) |
Hispanic or Latino - Speak another language
| Native: | 14.5% (154) |
| Foreign-born: | 84.7% (103) |
Foreign-born residents in Lihue
1,602 residents are foreign born (15.5% Asia).
| This city: | 18.4% |
| Hawaii: | 18.0% |


Marital status for residents in Lihue
Marital status - White (Caucasian) population 15 years and over
- Males
- 21.9%Never married
- 63.5%Now married
- 0.0%Separated
- 2.0%Widowed
- 12.7%Divorced
- Females
- 21.8%Never married
- 45.6%Now married
- 9.3%Separated
- 10.0%Widowed
- 13.3%Divorced
Women who gave birth in the past 12 months
| Now married: | 100.0% (35) |
| Unmarried: | 0.0% (0) |
Women who did not give birth in the past 12 months
| Now married: | 6.2% (6) |
| Unmarried: | 93.8% (93) |
Marital status - American Indian / Alaska Native population 15 years and over
- Males
- 0.0%Never married
- 100.0%Now married
- 0.0%Separated
- 0.0%Widowed
- 0.0%Divorced
- Females
- 0.0%Never married
- 0.0%Now married
- 0.0%Separated
- 0.0%Widowed
- 100.0%Divorced
Marital status - Asian population 15 years and over
- Males
- 28.1%Never married
- 61.0%Now married
- 0.0%Separated
- 2.4%Widowed
- 8.6%Divorced
- Females
- 18.0%Never married
- 52.5%Now married
- 3.5%Separated
- 16.6%Widowed
- 9.3%Divorced
Women who gave birth in the past 12 months
| Now married: | 100.0% (88) |
| Unmarried: | 0.0% (0) |
Women who did not give birth in the past 12 months
| Now married: | 47.2% (276) |
| Unmarried: | 52.8% (309) |
Marital status - Native Hawaiian / Pacific Islander population 15 years and over
- Males
- 59.3%Never married
- 34.1%Now married
- 0.0%Separated
- 4.4%Widowed
- 2.2%Divorced
- Females
- 35.9%Never married
- 22.2%Now married
- 0.0%Separated
- 6.9%Widowed
- 35.1%Divorced
Women who did not give birth in the past 12 months
| Now married: | 25.0% (29) |
| Unmarried: | 75.0% (86) |
Marital status - Other race population 15 years and over
- Males
- 0.0%Never married
- 100.0%Now married
- 0.0%Separated
- 0.0%Widowed
- 0.0%Divorced
- Females
- 90.5%Never married
- 0.0%Now married
- 0.0%Separated
- 9.5%Widowed
- 0.0%Divorced
Women who did not give birth in the past 12 months
| Now married: | 0.0% (0) |
| Unmarried: | 100.0% (69) |
Marital status - Two or more races population 15 years and over
- Males
- 47.1%Never married
- 33.9%Now married
- 2.7%Separated
- 0.0%Widowed
- 16.3%Divorced
- Females
- 57.7%Never married
- 32.1%Now married
- 0.0%Separated
- 0.0%Widowed
- 10.2%Divorced
Women who did not give birth in the past 12 months
| Now married: | 30.5% (234) |
| Unmarried: | 69.5% (531) |
Marital status - White alone, not Hispanic / Latino population 15 years and over
- Males
- 20.4%Never married
- 64.5%Now married
- 0.0%Separated
- 2.0%Widowed
- 13.1%Divorced
- Females
- 22.7%Never married
- 47.7%Now married
- 5.2%Separated
- 10.5%Widowed
- 13.9%Divorced
Women who gave birth in the past 12 months
| Now married: | 100.0% (37) |
| Unmarried: | 0.0% (0) |
Women who did not give birth in the past 12 months
| Now married: | 6.2% (7) |
| Unmarried: | 93.8% (98) |
Marital status - Hispanic or Latino population 15 years and over
- Males
- 66.6%Never married
- 33.4%Now married
- 0.0%Separated
- 0.0%Widowed
- 0.0%Divorced
- Females
- 51.8%Never married
- 36.0%Now married
- 6.1%Separated
- 1.2%Widowed
- 4.9%Divorced
Women who did not give birth in the past 12 months
| Now married: | 40.4% (144) |
| Unmarried: | 59.6% (213) |
Ancestries in Lihue

- 942.4%American
- 772.0%Italian
- 591.5%Lebanese
- 481.2%Irish
- 360.9%Dutch
- 360.9%French Canadian
- 240.6%British West Indian
- 220.6%Portuguese
- 190.5%English
- 180.5%Czech
- 170.4%Polish
- 170.4%Scandinavian
- 150.4%German
- 150.4%Swedish
- 150.4%Swiss
- 140.4%Russian
- 140.4%Scottish
- 120.3%Danish
- 100.3%Macedonian
- 70.2%European
- 40.1%Lithuanian
- 40.1%Scotch-Irish
- 40.1%Welsh
- 30.08%Canadian

Geographical mobility in Lihue

- Same house 1 year ago
- 1,24887.7%White (Caucasian)
- 10870.2%Black or African American
- 1155.9%American Indian / Alaska Native
- 2,75780.5%Asian
- 51892.3%Native Hawaiian / Pacific Islander
- 4857.8%Other race
- 2,48088.5%Two or more races
- 1,22487.8%White alone, not Hispanic / Latino
- 1,24186.0%Hispanic or Latino

-
- Moved within same county
- 1087.6%White / Caucasian
- 4126.5%Black or African American
- 1787.1%American Indian / Alaska Native
- 43112.6%Asian
- 274.9%Native Hawaiian / Pacific Islander
- 2125.6%Other race
- 1706.1%Two or more races
- 1107.9%White alone, not Hispanic / Latino
- 352.4%Hispanic or Latino

-
- Moved within same state
- 352.5%White / Caucasian
- 2788.1%Asian
- 352.5%White alone, not Hispanic / Latino

-
- Moved from different state
- 412.9%White / Caucasian
- 170.5%Asian
- 1013.6%Two or more races
- 382.7%White alone, not Hispanic / Latino
- 19513.5%Hispanic or Latino

-
- Moved from abroad
- 80.6%White
- 142.6%Native Hawaiian / Pacific Islander
- 80.6%White alone, not Hispanic / Latino

Children Nativity (place of birth) in Lihue
Place of birth for residents in Lihue
![Place of birth for the foreign-born population - Regions]()
- 1,365Asia
- 1,241South Eastern Asia
- 135Americas
- 124Eastern Asia
- 119Latin America
- 88Caribbean
- 57Europe
- 43Oceania
- 30Central America
- 29Eastern Europe
- 27Western Europe
- 16Northern America

![Place of birth for the foreign-born population - Countries]()
- 1,071Philippines
- 117Vietnam
- 116Japan
- 60Dominican Republic
- 30Mexico
- 27Netherlands
- 24Thailand
- 18Czechoslovakia
- 16Canada
- 15Cambodia
- 12Malaysia
- 11North Macedonia (Macedonia)
- 9Micronesia
- 8Korea

Grandparents responsible for own grandchildren in Lihue
Zip codes: 96766.