Races in Lino Lakes, Minnesota (MN) Detailed Stats
Data:
Races - White alone (%)
Races - White alone (% change since 2000)
Races - Black alone (%)
Races - Black alone (% change since 2000)
Races - American Indian alone (%)
Races - American Indian alone (% change since 2000)
Races - Asian alone (%)
Races - Asian alone (% change since 2000)
Races - Hispanic (%)
Races - Hispanic (% change since 2000)
Races - Native Hawaiian and Other Pacific Islander alone (%)
Races - Native Hawaiian and Other Pacific Islander alone (% change since 2000)
Races - Two or more races(%)
Races - Two or more races(% change since 2000)
Races - Other race alone (%)
Races - Other race alone (% change since 2000)
Racial diversity
Place of birth - Born in state of residence (%)
Place of birth - Born in state of residence (%) - White
Place of birth - Born in state of residence (%) - Black or African American
Place of birth - Born in state of residence (%) - Asian
Place of birth - Born in state of residence (%) - Hispanic or Latino
Place of birth - Born in state of residence (%) - American Indian and Alaska Native
Place of birth - Born in state of residence (%) - Multirace
Place of birth - Born in state of residence (%) - Other Race
Place of birth - Born in other state (%)
Place of birth - Born in other state (%) - White
Place of birth - Born in other state (%) - Black or African American
Place of birth - Born in other state (%) - Asian
Place of birth - Born in other state (%) - Hispanic or Latino
Place of birth - Born in other state (%) - American Indian and Alaska Native
Place of birth - Born in other state (%) - Multirace
Place of birth - Born in other state (%) - Other Race
Place of birth - Native, outside of US (%)
Place of birth - Native, outside of US (%) - White
Place of birth - Native, outside of US (%) - Black or African American
Place of birth - Native, outside of US (%) - Asian
Place of birth - Native, outside of US (%) - Hispanic or Latino
Place of birth - Native, outside of US (%) - American Indian and Alaska Native
Place of birth - Native, outside of US (%) - Multirace
Place of birth - Native, outside of US (%) - Other Race
Place of birth - Foreign born (%)
Place of birth - Foreign born (%) - White
Place of birth - Foreign born (%) - Black or African American
Place of birth - Foreign born (%) - Asian
Place of birth - Foreign born (%) - Hispanic or Latino
Place of birth - Foreign born (%) - American Indian and Alaska Native
Place of birth - Foreign born (%) - Multirace
Place of birth - Foreign born (%) - Other Race
Residents speaking English at home (%)
Residents speaking English at home - Born in the United States (%)
Residents speaking English at home - Native, born elsewhere (%)
Residents speaking English at home - Foreign born (%)
Residents speaking Spanish at home (%)
Residents speaking Spanish at home - Born in the United States (%)
Residents speaking Spanish at home - Native, born elsewhere (%)
Residents speaking Spanish at home - Foreign born (%)
Residents speaking other language at home (%)
Residents speaking other language at home - Born in the United States (%)
Residents speaking other language at home - Native, born elsewhere (%)
Residents speaking other language at home - Foreign born (%)
Marital status - Never married (%)
Marital status - Now married (%)
Marital status - Separated (%)
Marital status - Widowed (%)
Marital status - Divorced (%)
Ancestries Reported - Arab (%)
Ancestries Reported - Czech (%)
Ancestries Reported - Danish (%)
Ancestries Reported - Dutch (%)
Ancestries Reported - English (%)
Ancestries Reported - French (%)
Ancestries Reported - French Canadian (%)
Ancestries Reported - German (%)
Ancestries Reported - Greek (%)
Ancestries Reported - Hungarian (%)
Ancestries Reported - Irish (%)
Ancestries Reported - Italian (%)
Ancestries Reported - Lithuanian (%)
Ancestries Reported - Norwegian (%)
Ancestries Reported - Polish (%)
Ancestries Reported - Portuguese (%)
Ancestries Reported - Russian (%)
Ancestries Reported - Scotch-Irish (%)
Ancestries Reported - Scottish (%)
Ancestries Reported - Slovak (%)
Ancestries Reported - Subsaharan African (%)
Ancestries Reported - Swedish (%)
Ancestries Reported - Swiss (%)
Ancestries Reported - Ukrainian (%)
Ancestries Reported - United States (%)
Ancestries Reported - Welsh (%)
Ancestries Reported - West Indian (%)
Ancestries Reported - Other (%)
Geographical mobility - Same house 1 year ago (%)
Geographical mobility - Same house 1 year ago (%) - White
Geographical mobility - Same house 1 year ago (%) - Black or African American
Geographical mobility - Same house 1 year ago (%) - Asian
Geographical mobility - Same house 1 year ago (%) - Hispanic or Latino
Geographical mobility - Same house 1 year ago (%) - American Indian and Alaska Native
Geographical mobility - Same house 1 year ago (%) - Multirace
Geographical mobility - Same house 1 year ago (%) - Other Race
Geographical mobility - Moved within same county (%)
Geographical mobility - Moved within same county (%) - White
Geographical mobility - Moved within same county (%) - Black or African American
Geographical mobility - Moved within same county (%) - Asian
Geographical mobility - Moved within same county (%) - Hispanic or Latino
Geographical mobility - Moved within same county (%) - American Indian and Alaska Native
Geographical mobility - Moved within same county (%) - Multirace
Geographical mobility - Moved within same county (%) - Other Race
Geographical mobility - Moved from different county within same state (%)
Geographical mobility - Moved from different county within same state (%) - White
Geographical mobility - Moved from different county within same state (%) - Black or African American
Geographical mobility - Moved from different county within same state (%) - Asian
Geographical mobility - Moved from different county within same state (%) - Hispanic or Latino
Geographical mobility - Moved from different county within same state (%) - American Indian and Alaska Native
Geographical mobility - Moved from different county within same state (%) - Multirace
Geographical mobility - Moved from different county within same state (%) - Other Race
Geographical mobility - Moved from different state (%)
Geographical mobility - Moved from different state (%) - White
Geographical mobility - Moved from different state (%) - Black or African American
Geographical mobility - Moved from different state (%) - Asian
Geographical mobility - Moved from different state (%) - Hispanic or Latino
Geographical mobility - Moved from different state (%) - American Indian and Alaska Native
Geographical mobility - Moved from different state (%) - Multirace
Geographical mobility - Moved from different state (%) - Other Race
Geographical mobility - Moved from abroad (%)
Geographical mobility - Moved from abroad (%) - White
Geographical mobility - Moved from abroad (%) - Black or African American
Geographical mobility - Moved from abroad (%) - Asian
Geographical mobility - Moved from abroad (%) - Hispanic or Latino
Geographical mobility - Moved from abroad (%) - American Indian and Alaska Native
Geographical mobility - Moved from abroad (%) - Multirace
Geographical mobility - Moved from abroad (%) - Other Race
Place of birth for the foreign-born population - Ireland (%)
Place of birth for the foreign-born population - Denmark (%)
Place of birth for the foreign-born population - Norway (%)
Place of birth for the foreign-born population - Sweden (%)
Place of birth for the foreign-born population - United Kingdom (%)
Place of birth for the foreign-born population - England (%)
Place of birth for the foreign-born population - Scotland (%)
Place of birth for the foreign-born population - Other Northern Europe (%)
Place of birth for the foreign-born population - Austria (%)
Place of birth for the foreign-born population - Belgium (%)
Place of birth for the foreign-born population - France (%)
Place of birth for the foreign-born population - Germany (%)
Place of birth for the foreign-born population - Netherlands (%)
Place of birth for the foreign-born population - Switzerland (%)
Place of birth for the foreign-born population - Other Western Europe (%)
Place of birth for the foreign-born population - Greece (%)
Place of birth for the foreign-born population - Italy (%)
Place of birth for the foreign-born population - Portugal (%)
Place of birth for the foreign-born population - Spain (%)
Place of birth for the foreign-born population - Other Southern Europe (%)
Place of birth for the foreign-born population - Albania (%)
Place of birth for the foreign-born population - Belarus (%)
Place of birth for the foreign-born population - Bosnia and Herzegovina (%)
Place of birth for the foreign-born population - Bulgaria (%)
Place of birth for the foreign-born population - Croatia (%)
Place of birth for the foreign-born population - Czechoslovakia (%)
Place of birth for the foreign-born population - Hungary (%)
Place of birth for the foreign-born population - Latvia (%)
Place of birth for the foreign-born population - Lithuania (%)
Place of birth for the foreign-born population - North Macedonia (Macedonia) (%)
Place of birth for the foreign-born population - Moldova (%)
Place of birth for the foreign-born population - Poland (%)
Place of birth for the foreign-born population - Romania (%)
Place of birth for the foreign-born population - Russia (%)
Place of birth for the foreign-born population - Serbia (%)
Place of birth for the foreign-born population - Ukraine (%)
Place of birth for the foreign-born population - Other Eastern Europe (%)
Place of birth for the foreign-born population - China (%)
Place of birth for the foreign-born population - Hong Kong (%)
Place of birth for the foreign-born population - Taiwan (%)
Place of birth for the foreign-born population - Japan (%)
Place of birth for the foreign-born population - Korea (%)
Place of birth for the foreign-born population - Other Eastern Asia (%)
Place of birth for the foreign-born population - Afghanistan (%)
Place of birth for the foreign-born population - Bangladesh (%)
Place of birth for the foreign-born population - India (%)
Place of birth for the foreign-born population - Iran (%)
Place of birth for the foreign-born population - Kazakhstan (%)
Place of birth for the foreign-born population - Nepal (%)
Place of birth for the foreign-born population - Pakistan (%)
Place of birth for the foreign-born population - Sri Lanka (%)
Place of birth for the foreign-born population - Uzbekistan (%)
Place of birth for the foreign-born population - Other South Central Asia (%)
Place of birth for the foreign-born population - Burma (%)
Place of birth for the foreign-born population - Cambodia (%)
Place of birth for the foreign-born population - Indonesia (%)
Place of birth for the foreign-born population - Laos (%)
Place of birth for the foreign-born population - Malaysia (%)
Place of birth for the foreign-born population - Philippines (%)
Place of birth for the foreign-born population - Singapore (%)
Place of birth for the foreign-born population - Thailand (%)
Place of birth for the foreign-born population - Vietnam (%)
Place of birth for the foreign-born population - Other South Eastern Asia (%)
Place of birth for the foreign-born population - Armenia (%)
Place of birth for the foreign-born population - Iraq (%)
Place of birth for the foreign-born population - Israel (%)
Place of birth for the foreign-born population - Jordan (%)
Place of birth for the foreign-born population - Kuwait (%)
Place of birth for the foreign-born population - Lebanon (%)
Place of birth for the foreign-born population - Saudi Arabia (%)
Place of birth for the foreign-born population - Syria (%)
Place of birth for the foreign-born population - Turkey (%)
Place of birth for the foreign-born population - Yemen (%)
Place of birth for the foreign-born population - Other Western Asia (%)
Place of birth for the foreign-born population - Eritrea (%)
Place of birth for the foreign-born population - Ethiopia (%)
Place of birth for the foreign-born population - Kenya (%)
Place of birth for the foreign-born population - Somalia (%)
Place of birth for the foreign-born population - Uganda (%)
Place of birth for the foreign-born population - Zimbabwe (%)
Place of birth for the foreign-born population - Other Eastern Africa (%)
Place of birth for the foreign-born population - Cameroon (%)
Place of birth for the foreign-born population - Congo (%)
Place of birth for the foreign-born population - Democratic Republic of Congo (Zaire) (%)
Place of birth for the foreign-born population - Other Middle Africa (%)
Place of birth for the foreign-born population - Egypt (%)
Place of birth for the foreign-born population - Morocco (%)
Place of birth for the foreign-born population - Sudan (%)
Place of birth for the foreign-born population - Other Northern Africa (%)
Place of birth for the foreign-born population - South Africa (%)
Place of birth for the foreign-born population - Other Southern Africa (%)
Place of birth for the foreign-born population - Cabo Verde (%)
Place of birth for the foreign-born population - Ghana (%)
Place of birth for the foreign-born population - Liberia (%)
Place of birth for the foreign-born population - Nigeria (%)
Place of birth for the foreign-born population - Senegal (%)
Place of birth for the foreign-born population - Sierra Leone (%)
Place of birth for the foreign-born population - Other Western Africa (%)
Place of birth for the foreign-born population - Australia (%)
Place of birth for the foreign-born population - New Zealand (%)
Place of birth for the foreign-born population - Fiji (%)
Place of birth for the foreign-born population - Micronesia (%)
Place of birth for the foreign-born population - Bahamas (%)
Place of birth for the foreign-born population - Barbados (%)
Place of birth for the foreign-born population - Cuba (%)
Place of birth for the foreign-born population - Dominica (%)
Place of birth for the foreign-born population - Dominican Republic (%)
Place of birth for the foreign-born population - Grenada (%)
Place of birth for the foreign-born population - Haiti (%)
Place of birth for the foreign-born population - Jamaica (%)
Place of birth for the foreign-born population - St. Vincent and the Grenadines (%)
Place of birth for the foreign-born population - Trinidad and Tobago (%)
Place of birth for the foreign-born population - West Indies (%)
Place of birth for the foreign-born population - Other Caribbean (%)
Place of birth for the foreign-born population - Belize (%)
Place of birth for the foreign-born population - Costa Rica (%)
Place of birth for the foreign-born population - El Salvador (%)
Place of birth for the foreign-born population - Guatemala (%)
Place of birth for the foreign-born population - Honduras (%)
Place of birth for the foreign-born population - Mexico (%)
Place of birth for the foreign-born population - Nicaragua (%)
Place of birth for the foreign-born population - Panama (%)
Place of birth for the foreign-born population - Other Central America (%)
Place of birth for the foreign-born population - Argentina (%)
Place of birth for the foreign-born population - Bolivia (%)
Place of birth for the foreign-born population - Brazil (%)
Place of birth for the foreign-born population - Chile (%)
Place of birth for the foreign-born population - Colombia (%)
Place of birth for the foreign-born population - Ecuador (%)
Place of birth for the foreign-born population - Guyana (%)
Place of birth for the foreign-born population - Peru (%)
Place of birth for the foreign-born population - Uruguay (%)
Place of birth for the foreign-born population - Venezuela (%)
Place of birth for the foreign-born population - Other South America (%)
Place of birth for the foreign-born population - Canada (%)
Place of birth for the foreign-born population - Other Northern America (%)
Place of birth for the foreign-born population - Other (%)
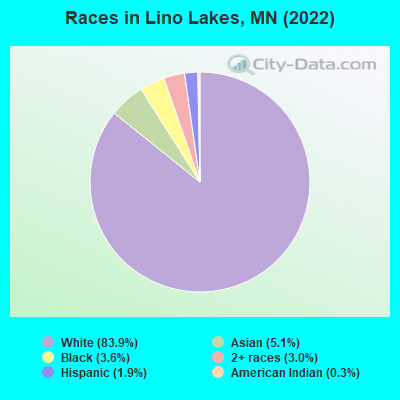
According to 2022 data, the most numerous races in Lino Lakes, MN are White alone (18,310 residents), Black alone (781 residents), and Hispanic (419 residents). 91.4% of Lino Lakes residents speak English at home. 4.3% of Lino Lakes, MN residents are foreign-born (1.9% born in Asia, 1.0% born in Europe, 0.5% born in Latin America, 0.5% born in Africa), which is 87.8% less than the foreign-born rate of 8.0% across the entire state of Minnesota.
Race distribution in Lino Lakes
2000 2022
4,337,143 88.2% White alone 168,813 3.4% Black alone 143,382 2.9% Hispanic 141,083 2.9% Asian alone 70,304 1.4% Two or more races 52,009 1.1% American Indian alone 5,031 0.1% Other race alone 1,714 0.03% Native Hawaiian and Other
4,356,347 76.2% White alone 395,179 6.9% Black alone 333,830 5.8% Hispanic 294,800 5.2% Asian alone 259,649 4.5% Two or more races 42,125 0.7% American Indian alone 32,976 0.6% Other race alone 2,278 0.04% Native Hawaiian and Other
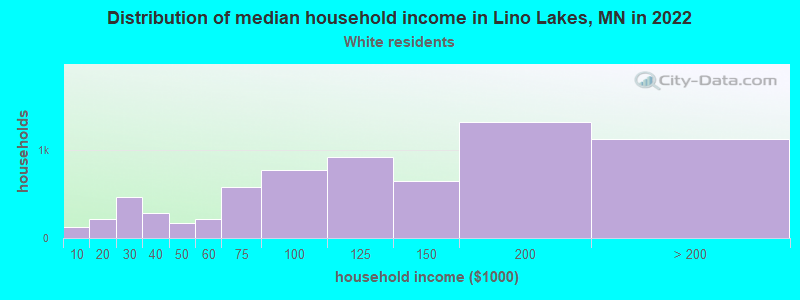
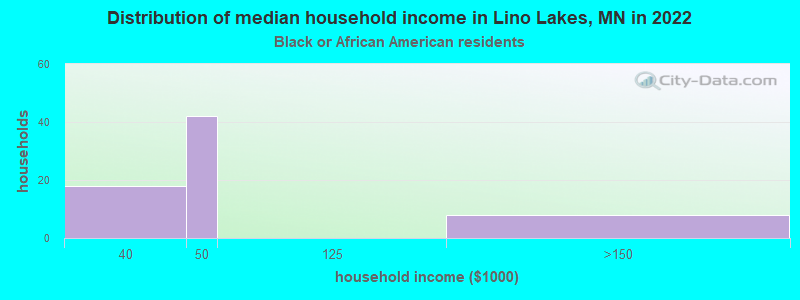
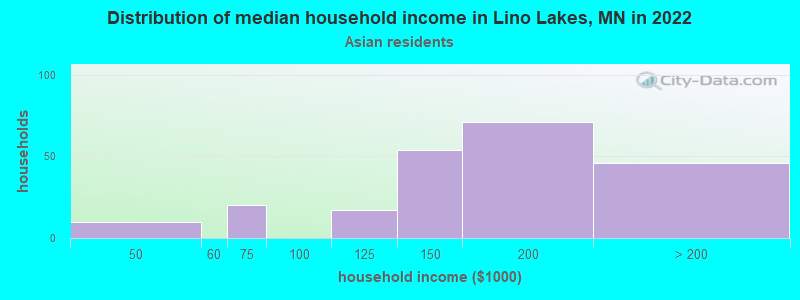
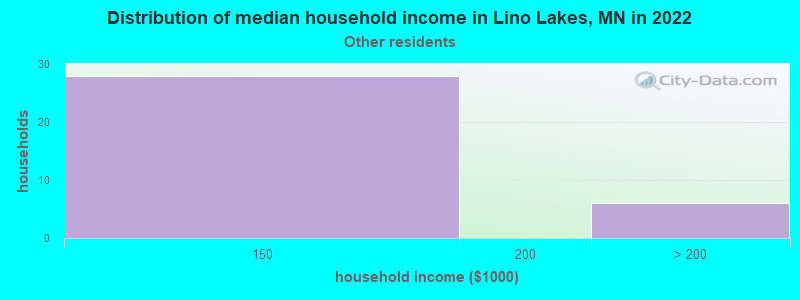
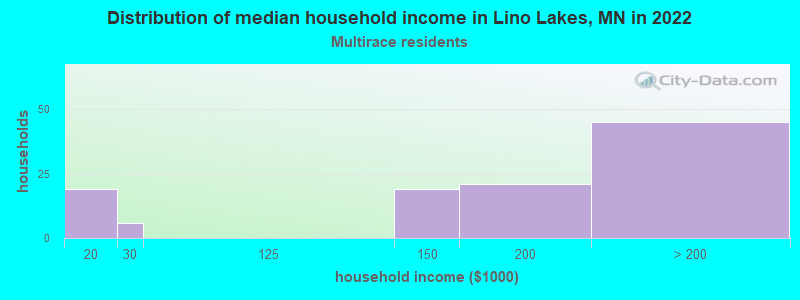
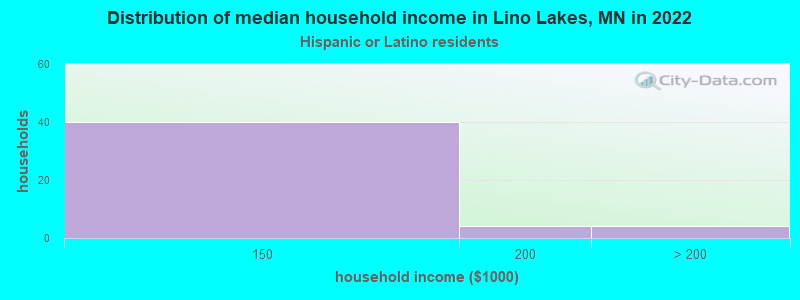
Income and house value in Lino Lakes Median household income in 2022 $116,135 White non-Hispanic householders$38,320 Black householders$166,419 Asian householders$149,161 Some other race householders$159,639 Two or more races householders$129,803 Hispanic or Latino race householdersMedian 2022 house value $399,085 White Non-Hispanic householders$460,200 American Indian or Alaska Native householders $545,368 Asian householders$552,240 Some other race householders$302,873 Two or more races householders$242,494 Hispanic or Latino householders
Median age by race in Lino Lakes
45.4 Median age for White residents42.8 47.6 32.6 Median age for Black or African American residents39.6 15.1 55.6 Median age for American Indian / Alaska Native residents47.6 -1,037,974,682.5 32.8 Median age for Asian residents29.9 35.6 -670,553,935.2 Median age for Native Hawaiian / Pacific Islander residents-670,553,935.2 -534,959,349.1 36.0 Median age for Other race residents33.7 -710,194,730.1 17.5 Median age for Two or more races residents19.1 16.9 45.2 Median age for White alone residents43.0 47.1 22.4 Median age for Hispanic or Latino residents22.1 30.7
Owner/renter occupied households by race in Lino Lakes
House owners and renters - White residents 6,427 92.7% Owner occupied504 7.3% Renter occupiedHouse owners and renters - Black or African American residents 33 42.5% Owner occupied45 57.5% Renter occupiedHouse owners and renters - Asian residents 241 93.3% Owner occupied17 6.7% Renter occupiedHouse owners and renters - Other race residents 58 100.0% Owner occupiedHouse owners and renters - Two or more races residents 114 100.0% Owner occupiedHouse owners and renters - White alone residents 6,453 92.7% Owner occupied510 7.3% Renter occupiedHouse owners and renters - Hispanic or Latino residents 63 100.0% Owner occupied
Language usage in Lino Lakes
English speakers - Total 91.4% of residents of Lino Lakes speak English at home.
1.3% of residents speak Spanish at home 203 73.0% Speak English very well75 27.0% Speak English less than very well5.8% of residents speak other language at home 1,000 83.1% Speak English very well204 16.9% Speak English less than very well
English speakers - Born in the United States 93.7% of residents of Lino Lakes speak English at home.
1.2% of residents speak Spanish at home 44 88.0% Speak English very well6 12.0% Speak English less than very well2.9% of residents speak other language at home 108 89.3% Speak English very well13 10.7% Speak English less than very well
English speakers - Native, born elsewhere 63.5% of residents of Lino Lakes speak English at home.
4.2% of residents speak Spanish at home 4 100.0% Speak English very well33.3% of residents speak other language at home 32 100.0% Speak English very well
English speakers - Foreign-born 38.6% of residents of Lino Lakes speak English at home.
10.0% of residents speak Spanish at home 59 57.3% Speak English very well44 42.7% Speak English less than very well49.7% of residents speak other language at home 405 78.9% Speak English very well108 21.1% Speak English less than very well
White (Caucasian) - Speak only English Native:
98.4% (16,877)Foreign-born:
66.3% (213)
White (Caucasian) - Speak another language Native:
1.3% (226)Foreign-born:
27.6% (89)
Black or African American - Speak only English Native:
64.9% (439)Foreign-born:
8.2% (9)
Black or African American - Speak another language Native:
38.5% (261)Foreign-born:
91.7% (96)
Asian - Speak only English Native:
45.6% (284)Foreign-born:
22.4% (98)
Asian - Speak another language Native:
51.8% (322)Foreign-born:
69.6% (305)
Other race - Speak only English Native:
98.3% (137)Foreign-born:
39.5% (10)
Other race - Speak another language Native:
17.8% (25)Foreign-born:
49.9% (13)
Two or more races - Speak another language Native:
6.6% (41)Foreign-born:
100.0% (103)
White alone - Speak only English Native:
98.5% (16,934)Foreign-born:
60.8% (206)
White alone - Speak another language Native:
1.2% (213)Foreign-born:
30.8% (104)
Hispanic or Latino - Speak only English Native:
52.8% (118)Foreign-born:
40.9% (62)
Hispanic or Latino - Speak another language Native:
42.3% (94)Foreign-born:
66.1% (100)
Foreign-born residents in Lino Lakes 929 residents are foreign born (1.9% Asia , 1.0% Europe , 0.5% Latin America , 0.5% Africa ).
This city:
4.3%Minnesota:
8.5%
Marital status for residents in Lino Lakes Marital status - White (Caucasian) population 15 years and over
Males 27.0% Never married63.8% Now married0.6% Separated3.3% Widowed5.4% DivorcedFemales 19.1% Never married65.9% Now married0.1% Separated4.7% Widowed10.2% DivorcedWomen who gave birth in the past 12 months Now married:
94.7% (133)Unmarried:
5.3% (7)
Women who did not give birth in the past 12 months Now married:
50.8% (1,778)Unmarried:
49.2% (1,723)
Marital status - Black or African American population 15 years and over
Males 71.1% Never married19.5% Now married1.6% Separated2.8% Widowed5.0% DivorcedFemales 44.8% Never married28.0% Now married0.0% Separated0.0% Widowed27.2% DivorcedWomen who gave birth in the past 12 months Now married:
0.0% (0)Unmarried:
100.0% (18)
Women who did not give birth in the past 12 months Now married:
32.4% (37)Unmarried:
67.6% (78)
Marital status - Asian population 15 years and over
Males 38.3% Never married61.7% Now married0.0% Separated0.0% Widowed0.0% DivorcedFemales 29.5% Never married68.3% Now married0.0% Separated0.0% Widowed2.2% DivorcedWomen who did not give birth in the past 12 months Now married:
59.3% (187)Unmarried:
40.7% (129)
Marital status - Other race population 15 years and over
Males 52.9% Never married37.1% Now married0.0% Separated0.0% Widowed10.0% DivorcedFemales 68.8% Never married31.3% Now married0.0% Separated0.0% Widowed0.0% DivorcedWomen who did not give birth in the past 12 months Now married:
0.0% (0)Unmarried:
100.0% (20)
Marital status - Two or more races population 15 years and over
Males 54.1% Never married30.1% Now married0.0% Separated0.0% Widowed15.8% DivorcedFemales 58.3% Never married34.5% Now married0.0% Separated0.0% Widowed7.2% DivorcedWomen who did not give birth in the past 12 months Now married:
25.4% (45)Unmarried:
74.6% (132)
Marital status - White alone, not Hispanic / Latino population 15 years and over
Males 26.4% Never married64.3% Now married0.6% Separated3.3% Widowed5.4% DivorcedFemales 19.1% Never married65.9% Now married0.1% Separated4.7% Widowed10.2% DivorcedWomen who gave birth in the past 12 months Now married:
94.7% (136)Unmarried:
5.3% (8)
Women who did not give birth in the past 12 months Now married:
50.7% (1,798)Unmarried:
49.3% (1,748)
Marital status - Hispanic or Latino population 15 years and over
Males 72.6% Never married22.4% Now married0.0% Separated0.0% Widowed4.9% DivorcedFemales 43.7% Never married50.0% Now married0.0% Separated0.0% Widowed6.2% DivorcedWomen who did not give birth in the past 12 months Now married:
50.0% (35)Unmarried:
50.0% (35)
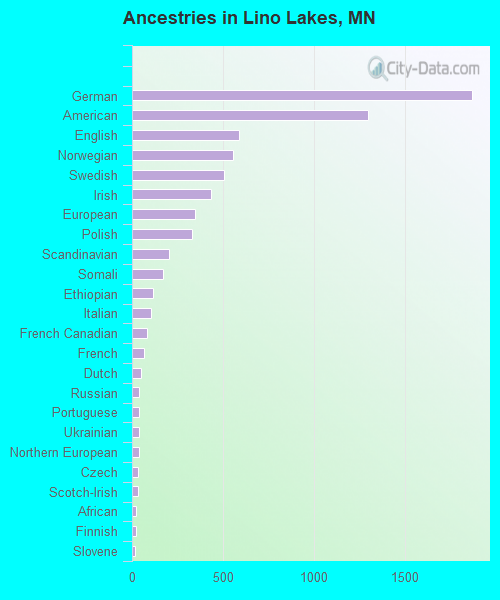
Ancestries in Lino Lakes
1,871 20.7% German1,299 14.4% American587 6.5% English554 6.1% Norwegian507 5.6% Swedish433 4.8% Irish344 3.8% European329 3.6% Polish202 2.2% Scandinavian168 1.9% Somali118 1.3% Ethiopian105 1.2% Italian80 0.9% French Canadian66 0.7% French49 0.5% Dutch40 0.4% Russian40 0.4% Portuguese38 0.4% Ukrainian37 0.4% Northern European33 0.4% Czech31 0.3% Scotch-Irish24 0.3% African23 0.3% Finnish18 0.2% Slovene16 0.2% Scottish14 0.2% Danish11 0.1% Hungarian10 0.1% Luxembourger9 0.10% Slovak9 0.10% Canadian8 0.09% Czechoslovakian6 0.07% Icelander6 0.07% Slavic
Children Nativity (place of birth) in Lino Lakes
Children under 6 years - Living with two parents Both parents native 743 100.0% NativeBoth parents foreign-born 16 100.0% NativeOne native, one foreign-born parent 72 100.0% NativeChildren under 6 years - Living with one parent Native parent 367 100.0% NativeChildren 6 to 17 years - Living with two parents Both parents native 1,988 97.2% Native57 2.8% Foreign-bornBoth parents foreign-born 146 79.1% Native38 20.9% Foreign-bornOne native, one foreign-born parent 215 100.0% NativeChildren 6 to 17 years - Living with one parent Native parent 518 100.0% NativeForeign-born parent 232 48.5% Native247 51.5% Foreign-born
Grandparents responsible for own grandchildren in Lino Lakes
Grandparents (30 to 59 years) White / Caucasian 34 47.1% Responsible for grandchildren38 52.9% Not responsible for grandchildrenBlack or African American 7 100.0% Not responsible for grandchildrenWhite alone, not Hispanic / Latino 34 45.4% Responsible for grandchildren41 54.6% Not responsible for grandchildrenGrandparents (60 years and over) White / Caucasian 40 22.0% Responsible for grandchildren140 78.0% Not responsible for grandchildrenWhite alone, not Hispanic / Latino 40 22.0% Responsible for grandchildren140 78.0% Not responsible for grandchildren