Races in Lisle, Illinois (IL) Detailed Stats
Data:
Races - White alone (%)
Races - White alone (% change since 2000)
Races - Black alone (%)
Races - Black alone (% change since 2000)
Races - American Indian alone (%)
Races - American Indian alone (% change since 2000)
Races - Asian alone (%)
Races - Asian alone (% change since 2000)
Races - Hispanic (%)
Races - Hispanic (% change since 2000)
Races - Native Hawaiian and Other Pacific Islander alone (%)
Races - Native Hawaiian and Other Pacific Islander alone (% change since 2000)
Races - Two or more races(%)
Races - Two or more races(% change since 2000)
Races - Other race alone (%)
Races - Other race alone (% change since 2000)
Racial diversity
Place of birth - Born in state of residence (%)
Place of birth - Born in state of residence (%) - White
Place of birth - Born in state of residence (%) - Black or African American
Place of birth - Born in state of residence (%) - Asian
Place of birth - Born in state of residence (%) - Hispanic or Latino
Place of birth - Born in state of residence (%) - American Indian and Alaska Native
Place of birth - Born in state of residence (%) - Multirace
Place of birth - Born in state of residence (%) - Other Race
Place of birth - Born in other state (%)
Place of birth - Born in other state (%) - White
Place of birth - Born in other state (%) - Black or African American
Place of birth - Born in other state (%) - Asian
Place of birth - Born in other state (%) - Hispanic or Latino
Place of birth - Born in other state (%) - American Indian and Alaska Native
Place of birth - Born in other state (%) - Multirace
Place of birth - Born in other state (%) - Other Race
Place of birth - Native, outside of US (%)
Place of birth - Native, outside of US (%) - White
Place of birth - Native, outside of US (%) - Black or African American
Place of birth - Native, outside of US (%) - Asian
Place of birth - Native, outside of US (%) - Hispanic or Latino
Place of birth - Native, outside of US (%) - American Indian and Alaska Native
Place of birth - Native, outside of US (%) - Multirace
Place of birth - Native, outside of US (%) - Other Race
Place of birth - Foreign born (%)
Place of birth - Foreign born (%) - White
Place of birth - Foreign born (%) - Black or African American
Place of birth - Foreign born (%) - Asian
Place of birth - Foreign born (%) - Hispanic or Latino
Place of birth - Foreign born (%) - American Indian and Alaska Native
Place of birth - Foreign born (%) - Multirace
Place of birth - Foreign born (%) - Other Race
Residents speaking English at home (%)
Residents speaking English at home - Born in the United States (%)
Residents speaking English at home - Native, born elsewhere (%)
Residents speaking English at home - Foreign born (%)
Residents speaking Spanish at home (%)
Residents speaking Spanish at home - Born in the United States (%)
Residents speaking Spanish at home - Native, born elsewhere (%)
Residents speaking Spanish at home - Foreign born (%)
Residents speaking other language at home (%)
Residents speaking other language at home - Born in the United States (%)
Residents speaking other language at home - Native, born elsewhere (%)
Residents speaking other language at home - Foreign born (%)
Marital status - Never married (%)
Marital status - Now married (%)
Marital status - Separated (%)
Marital status - Widowed (%)
Marital status - Divorced (%)
Ancestries Reported - Arab (%)
Ancestries Reported - Czech (%)
Ancestries Reported - Danish (%)
Ancestries Reported - Dutch (%)
Ancestries Reported - English (%)
Ancestries Reported - French (%)
Ancestries Reported - French Canadian (%)
Ancestries Reported - German (%)
Ancestries Reported - Greek (%)
Ancestries Reported - Hungarian (%)
Ancestries Reported - Irish (%)
Ancestries Reported - Italian (%)
Ancestries Reported - Lithuanian (%)
Ancestries Reported - Norwegian (%)
Ancestries Reported - Polish (%)
Ancestries Reported - Portuguese (%)
Ancestries Reported - Russian (%)
Ancestries Reported - Scotch-Irish (%)
Ancestries Reported - Scottish (%)
Ancestries Reported - Slovak (%)
Ancestries Reported - Subsaharan African (%)
Ancestries Reported - Swedish (%)
Ancestries Reported - Swiss (%)
Ancestries Reported - Ukrainian (%)
Ancestries Reported - United States (%)
Ancestries Reported - Welsh (%)
Ancestries Reported - West Indian (%)
Ancestries Reported - Other (%)
Geographical mobility - Same house 1 year ago (%)
Geographical mobility - Same house 1 year ago (%) - White
Geographical mobility - Same house 1 year ago (%) - Black or African American
Geographical mobility - Same house 1 year ago (%) - Asian
Geographical mobility - Same house 1 year ago (%) - Hispanic or Latino
Geographical mobility - Same house 1 year ago (%) - American Indian and Alaska Native
Geographical mobility - Same house 1 year ago (%) - Multirace
Geographical mobility - Same house 1 year ago (%) - Other Race
Geographical mobility - Moved within same county (%)
Geographical mobility - Moved within same county (%) - White
Geographical mobility - Moved within same county (%) - Black or African American
Geographical mobility - Moved within same county (%) - Asian
Geographical mobility - Moved within same county (%) - Hispanic or Latino
Geographical mobility - Moved within same county (%) - American Indian and Alaska Native
Geographical mobility - Moved within same county (%) - Multirace
Geographical mobility - Moved within same county (%) - Other Race
Geographical mobility - Moved from different county within same state (%)
Geographical mobility - Moved from different county within same state (%) - White
Geographical mobility - Moved from different county within same state (%) - Black or African American
Geographical mobility - Moved from different county within same state (%) - Asian
Geographical mobility - Moved from different county within same state (%) - Hispanic or Latino
Geographical mobility - Moved from different county within same state (%) - American Indian and Alaska Native
Geographical mobility - Moved from different county within same state (%) - Multirace
Geographical mobility - Moved from different county within same state (%) - Other Race
Geographical mobility - Moved from different state (%)
Geographical mobility - Moved from different state (%) - White
Geographical mobility - Moved from different state (%) - Black or African American
Geographical mobility - Moved from different state (%) - Asian
Geographical mobility - Moved from different state (%) - Hispanic or Latino
Geographical mobility - Moved from different state (%) - American Indian and Alaska Native
Geographical mobility - Moved from different state (%) - Multirace
Geographical mobility - Moved from different state (%) - Other Race
Geographical mobility - Moved from abroad (%)
Geographical mobility - Moved from abroad (%) - White
Geographical mobility - Moved from abroad (%) - Black or African American
Geographical mobility - Moved from abroad (%) - Asian
Geographical mobility - Moved from abroad (%) - Hispanic or Latino
Geographical mobility - Moved from abroad (%) - American Indian and Alaska Native
Geographical mobility - Moved from abroad (%) - Multirace
Geographical mobility - Moved from abroad (%) - Other Race
Place of birth for the foreign-born population - Ireland (%)
Place of birth for the foreign-born population - Denmark (%)
Place of birth for the foreign-born population - Norway (%)
Place of birth for the foreign-born population - Sweden (%)
Place of birth for the foreign-born population - United Kingdom (%)
Place of birth for the foreign-born population - England (%)
Place of birth for the foreign-born population - Scotland (%)
Place of birth for the foreign-born population - Other Northern Europe (%)
Place of birth for the foreign-born population - Austria (%)
Place of birth for the foreign-born population - Belgium (%)
Place of birth for the foreign-born population - France (%)
Place of birth for the foreign-born population - Germany (%)
Place of birth for the foreign-born population - Netherlands (%)
Place of birth for the foreign-born population - Switzerland (%)
Place of birth for the foreign-born population - Other Western Europe (%)
Place of birth for the foreign-born population - Greece (%)
Place of birth for the foreign-born population - Italy (%)
Place of birth for the foreign-born population - Portugal (%)
Place of birth for the foreign-born population - Spain (%)
Place of birth for the foreign-born population - Other Southern Europe (%)
Place of birth for the foreign-born population - Albania (%)
Place of birth for the foreign-born population - Belarus (%)
Place of birth for the foreign-born population - Bosnia and Herzegovina (%)
Place of birth for the foreign-born population - Bulgaria (%)
Place of birth for the foreign-born population - Croatia (%)
Place of birth for the foreign-born population - Czechoslovakia (%)
Place of birth for the foreign-born population - Hungary (%)
Place of birth for the foreign-born population - Latvia (%)
Place of birth for the foreign-born population - Lithuania (%)
Place of birth for the foreign-born population - North Macedonia (Macedonia) (%)
Place of birth for the foreign-born population - Moldova (%)
Place of birth for the foreign-born population - Poland (%)
Place of birth for the foreign-born population - Romania (%)
Place of birth for the foreign-born population - Russia (%)
Place of birth for the foreign-born population - Serbia (%)
Place of birth for the foreign-born population - Ukraine (%)
Place of birth for the foreign-born population - Other Eastern Europe (%)
Place of birth for the foreign-born population - China (%)
Place of birth for the foreign-born population - Hong Kong (%)
Place of birth for the foreign-born population - Taiwan (%)
Place of birth for the foreign-born population - Japan (%)
Place of birth for the foreign-born population - Korea (%)
Place of birth for the foreign-born population - Other Eastern Asia (%)
Place of birth for the foreign-born population - Afghanistan (%)
Place of birth for the foreign-born population - Bangladesh (%)
Place of birth for the foreign-born population - India (%)
Place of birth for the foreign-born population - Iran (%)
Place of birth for the foreign-born population - Kazakhstan (%)
Place of birth for the foreign-born population - Nepal (%)
Place of birth for the foreign-born population - Pakistan (%)
Place of birth for the foreign-born population - Sri Lanka (%)
Place of birth for the foreign-born population - Uzbekistan (%)
Place of birth for the foreign-born population - Other South Central Asia (%)
Place of birth for the foreign-born population - Burma (%)
Place of birth for the foreign-born population - Cambodia (%)
Place of birth for the foreign-born population - Indonesia (%)
Place of birth for the foreign-born population - Laos (%)
Place of birth for the foreign-born population - Malaysia (%)
Place of birth for the foreign-born population - Philippines (%)
Place of birth for the foreign-born population - Singapore (%)
Place of birth for the foreign-born population - Thailand (%)
Place of birth for the foreign-born population - Vietnam (%)
Place of birth for the foreign-born population - Other South Eastern Asia (%)
Place of birth for the foreign-born population - Armenia (%)
Place of birth for the foreign-born population - Iraq (%)
Place of birth for the foreign-born population - Israel (%)
Place of birth for the foreign-born population - Jordan (%)
Place of birth for the foreign-born population - Kuwait (%)
Place of birth for the foreign-born population - Lebanon (%)
Place of birth for the foreign-born population - Saudi Arabia (%)
Place of birth for the foreign-born population - Syria (%)
Place of birth for the foreign-born population - Turkey (%)
Place of birth for the foreign-born population - Yemen (%)
Place of birth for the foreign-born population - Other Western Asia (%)
Place of birth for the foreign-born population - Eritrea (%)
Place of birth for the foreign-born population - Ethiopia (%)
Place of birth for the foreign-born population - Kenya (%)
Place of birth for the foreign-born population - Somalia (%)
Place of birth for the foreign-born population - Uganda (%)
Place of birth for the foreign-born population - Zimbabwe (%)
Place of birth for the foreign-born population - Other Eastern Africa (%)
Place of birth for the foreign-born population - Cameroon (%)
Place of birth for the foreign-born population - Congo (%)
Place of birth for the foreign-born population - Democratic Republic of Congo (Zaire) (%)
Place of birth for the foreign-born population - Other Middle Africa (%)
Place of birth for the foreign-born population - Egypt (%)
Place of birth for the foreign-born population - Morocco (%)
Place of birth for the foreign-born population - Sudan (%)
Place of birth for the foreign-born population - Other Northern Africa (%)
Place of birth for the foreign-born population - South Africa (%)
Place of birth for the foreign-born population - Other Southern Africa (%)
Place of birth for the foreign-born population - Cabo Verde (%)
Place of birth for the foreign-born population - Ghana (%)
Place of birth for the foreign-born population - Liberia (%)
Place of birth for the foreign-born population - Nigeria (%)
Place of birth for the foreign-born population - Senegal (%)
Place of birth for the foreign-born population - Sierra Leone (%)
Place of birth for the foreign-born population - Other Western Africa (%)
Place of birth for the foreign-born population - Australia (%)
Place of birth for the foreign-born population - New Zealand (%)
Place of birth for the foreign-born population - Fiji (%)
Place of birth for the foreign-born population - Micronesia (%)
Place of birth for the foreign-born population - Bahamas (%)
Place of birth for the foreign-born population - Barbados (%)
Place of birth for the foreign-born population - Cuba (%)
Place of birth for the foreign-born population - Dominica (%)
Place of birth for the foreign-born population - Dominican Republic (%)
Place of birth for the foreign-born population - Grenada (%)
Place of birth for the foreign-born population - Haiti (%)
Place of birth for the foreign-born population - Jamaica (%)
Place of birth for the foreign-born population - St. Vincent and the Grenadines (%)
Place of birth for the foreign-born population - Trinidad and Tobago (%)
Place of birth for the foreign-born population - West Indies (%)
Place of birth for the foreign-born population - Other Caribbean (%)
Place of birth for the foreign-born population - Belize (%)
Place of birth for the foreign-born population - Costa Rica (%)
Place of birth for the foreign-born population - El Salvador (%)
Place of birth for the foreign-born population - Guatemala (%)
Place of birth for the foreign-born population - Honduras (%)
Place of birth for the foreign-born population - Mexico (%)
Place of birth for the foreign-born population - Nicaragua (%)
Place of birth for the foreign-born population - Panama (%)
Place of birth for the foreign-born population - Other Central America (%)
Place of birth for the foreign-born population - Argentina (%)
Place of birth for the foreign-born population - Bolivia (%)
Place of birth for the foreign-born population - Brazil (%)
Place of birth for the foreign-born population - Chile (%)
Place of birth for the foreign-born population - Colombia (%)
Place of birth for the foreign-born population - Ecuador (%)
Place of birth for the foreign-born population - Guyana (%)
Place of birth for the foreign-born population - Peru (%)
Place of birth for the foreign-born population - Uruguay (%)
Place of birth for the foreign-born population - Venezuela (%)
Place of birth for the foreign-born population - Other South America (%)
Place of birth for the foreign-born population - Canada (%)
Place of birth for the foreign-born population - Other Northern America (%)
Place of birth for the foreign-born population - Other (%)
Latest news about races in Lisle, IL collected exclusively by city-data.com from local newspapers, TV, and radio stations
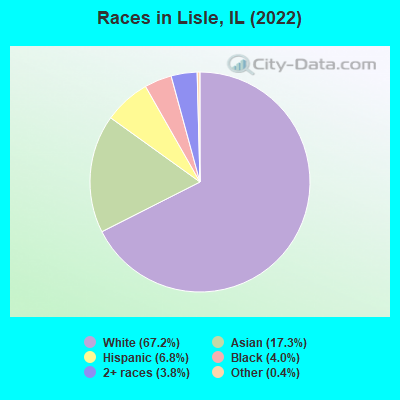
According to 2022 data, the most numerous races in Lisle, IL are White alone (15,635 residents), Hispanic (1,579 residents), and Black alone (941 residents). 79.1% of Lisle residents speak English at home. 16.4% of Lisle, IL residents are foreign-born (10.7% born in Asia, 3.1% born in Europe), which is 14.7% greater than the foreign-born rate of 14.0% across the entire state of Illinois.
Race distribution in Lisle
2000 2022
8,424,140 67.8% White alone 1,856,152 14.9% Black alone 1,530,262 12.3% Hispanic 419,916 3.4% Asian alone 153,996 1.2% Two or more races 13,479 0.1% Other race alone 18,232 0.1% American Indian alone 3,116 0.03% Native Hawaiian and Other
7,356,301 58.5% White alone 2,299,726 18.3% Hispanic 1,660,423 13.2% Black alone 747,296 5.9% Asian alone 458,599 3.6% Two or more races 45,386 0.4% Other race alone 10,405 0.08% American Indian alone 3,896 0.03% Native Hawaiian and Other
Income and house value in Lisle Median household income in 2022 $96,994 White non-Hispanic householders$74,079 Black householders$148,425 Asian householders$76,667 Some other race householders$100,566 Two or more races householders$77,881 Hispanic or Latino race householdersMedian 2022 house value $419,444 White Non-Hispanic householders$456,784 Black or African American householders$113,760 American Indian or Alaska Native householders $449,046 Asian householders$471,682 Some other race householders$540,170 Two or more races householders$515,986 Hispanic or Latino householders
Median age by race in Lisle
39.0 Median age for White residents38.3 39.9 29.6 Median age for Black or African American residents29.0 44.0 -699,421,964.6 Median age for American Indian / Alaska Native residents-721,943,047.9 -545,253,862.6 36.2 Median age for Asian residents33.5 40.2 -593,236,714.4 Median age for Native Hawaiian / Pacific Islander residents-658,536,584.7 -576,015,108.0 30.7 Median age for Other race residents21.9 50.7 33.9 Median age for Two or more races residents39.1 29.8 39.3 Median age for White alone residents38.3 40.1 26.8 Median age for Hispanic or Latino residents22.0 27.6
Owner/renter occupied households by race in Lisle
House owners and renters - White residents 4,374 62.5% Owner occupied2,629 37.5% Renter occupiedHouse owners and renters - Black or African American residents 49 15.8% Owner occupied261 84.2% Renter occupiedHouse owners and renters - Asian residents 1,038 65.1% Owner occupied557 34.9% Renter occupiedHouse owners and renters - Other race residents 111 36.9% Owner occupied190 63.1% Renter occupiedHouse owners and renters - Two or more races residents 312 54.5% Owner occupied260 45.5% Renter occupiedHouse owners and renters - White alone residents 4,323 61.0% Owner occupied2,761 39.0% Renter occupiedHouse owners and renters - Hispanic or Latino residents 321 54.2% Owner occupied271 45.8% Renter occupied
Language usage in Lisle
English speakers - Total 79.1% of residents of Lisle speak English at home.
4.3% of residents speak Spanish at home 682 72.6% Speak English very well257 27.4% Speak English less than very well16.2% of residents speak other language at home 2,755 77.8% Speak English very well786 22.2% Speak English less than very well
English speakers - Born in the United States 94.1% of residents of Lisle speak English at home.
3.1% of residents speak Spanish at home 109 76.2% Speak English very well34 23.8% Speak English less than very well2.5% of residents speak other language at home 84 72.4% Speak English very well32 27.6% Speak English less than very well
English speakers - Native, born elsewhere 74.8% of residents of Lisle speak English at home.
12.2% of residents speak Spanish at home 25 51.0% Speak English very well24 49.0% Speak English less than very well14.0% of residents speak other language at home 56 100.0% Speak English very well
English speakers - Foreign-born 18.5% of residents of Lisle speak English at home.
6.9% of residents speak Spanish at home 110 42.3% Speak English very well150 57.7% Speak English less than very well72.7% of residents speak other language at home 2,090 75.9% Speak English very well662 24.1% Speak English less than very well
White (Caucasian) - Speak only English Native:
97.0% (13,525)Foreign-born:
24.4% (218)
White (Caucasian) - Speak another language Native:
3.7% (519)Foreign-born:
76.5% (682)
Black or African American - Speak only English Native:
92.3% (846)Foreign-born:
39.7% (17)
Black or African American - Speak another language Native:
6.5% (60)Foreign-born:
100.0% (44)
Asian - Speak only English Native:
77.0% (1,042)Foreign-born:
16.6% (396)
Asian - Speak another language Native:
26.8% (363)Foreign-born:
82.2% (1,960)
Other race - Speak another language Native:
35.1% (119)Foreign-born:
100.0% (221)
Two or more races - Speak only English Native:
71.2% (914)Foreign-born:
42.5% (53)
Two or more races - Speak another language Native:
27.8% (356)Foreign-born:
51.1% (64)
White alone - Speak only English Native:
96.3% (13,387)Foreign-born:
21.5% (212)
White alone - Speak another language Native:
3.8% (522)Foreign-born:
78.7% (776)
Hispanic or Latino - Speak only English Native:
61.1% (652)Foreign-born:
18.4% (61)
Hispanic or Latino - Speak another language Native:
38.0% (405)Foreign-born:
79.9% (265)
Foreign-born residents in Lisle 3,817 residents are foreign born (10.7% Asia , 3.1% Europe ).
This city:
16.4%Illinois:
14.1%
Marital status for residents in Lisle Marital status - White (Caucasian) population 15 years and over
Males 38.5% Never married50.4% Now married0.5% Separated2.0% Widowed8.6% DivorcedFemales 29.6% Never married47.7% Now married0.6% Separated10.7% Widowed11.4% DivorcedWomen who gave birth in the past 12 months Now married:
65.9% (128)Unmarried:
34.1% (66)
Women who did not give birth in the past 12 months Now married:
40.3% (1,263)Unmarried:
59.7% (1,871)
Marital status - Black or African American population 15 years and over
Males 46.2% Never married36.3% Now married0.0% Separated8.0% Widowed9.4% DivorcedFemales 35.9% Never married41.3% Now married8.2% Separated3.2% Widowed11.4% DivorcedWomen who gave birth in the past 12 months Now married:
0.0% (0)Unmarried:
100.0% (22)
Women who did not give birth in the past 12 months Now married:
50.7% (143)Unmarried:
49.3% (138)
Marital status - Asian population 15 years and over
Males 28.6% Never married70.8% Now married0.0% Separated0.0% Widowed0.6% DivorcedFemales 19.1% Never married72.0% Now married0.0% Separated3.4% Widowed5.4% DivorcedWomen who gave birth in the past 12 months Now married:
100.0% (27)Unmarried:
0.0% (0)
Women who did not give birth in the past 12 months Now married:
74.2% (714)Unmarried:
25.8% (248)
Marital status - Other race population 15 years and over
Males 70.4% Never married0.0% Now married0.0% Separated0.0% Widowed29.6% DivorcedFemales 38.5% Never married38.5% Now married0.0% Separated3.0% Widowed20.0% DivorcedWomen who gave birth in the past 12 months Now married:
0.0% (0)Unmarried:
100.0% (75)
Women who did not give birth in the past 12 months Now married:
18.8% (36)Unmarried:
81.2% (156)
Marital status - Two or more races population 15 years and over
Males 40.4% Never married53.8% Now married2.2% Separated0.0% Widowed3.6% DivorcedFemales 40.9% Never married48.3% Now married0.0% Separated4.5% Widowed6.2% DivorcedWomen who did not give birth in the past 12 months Now married:
48.5% (229)Unmarried:
51.5% (244)
Marital status - White alone, not Hispanic / Latino population 15 years and over
Males 38.5% Never married50.1% Now married0.5% Separated2.1% Widowed8.9% DivorcedFemales 29.4% Never married47.6% Now married0.6% Separated11.0% Widowed11.5% DivorcedWomen who gave birth in the past 12 months Now married:
66.8% (129)Unmarried:
33.2% (64)
Women who did not give birth in the past 12 months Now married:
40.1% (1,308)Unmarried:
59.9% (1,952)
Marital status - Hispanic or Latino population 15 years and over
Males 43.2% Never married47.8% Now married2.1% Separated0.0% Widowed6.9% DivorcedFemales 38.2% Never married46.6% Now married0.0% Separated0.0% Widowed15.2% DivorcedWomen who gave birth in the past 12 months Now married:
11.6% (8)Unmarried:
88.4% (63)
Women who did not give birth in the past 12 months Now married:
38.1% (132)Unmarried:
61.9% (214)
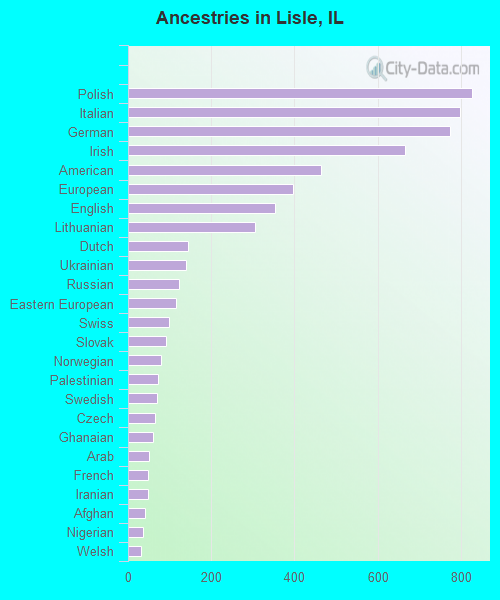
Ancestries in Lisle
826 7.7% Polish798 7.5% Italian774 7.2% German666 6.2% Irish464 4.3% American397 3.7% European352 3.3% English306 2.9% Lithuanian145 1.4% Dutch139 1.3% Ukrainian122 1.1% Russian115 1.1% Eastern European99 0.9% Swiss91 0.9% Slovak80 0.7% Norwegian73 0.7% Palestinian70 0.7% Swedish64 0.6% Czech60 0.6% Ghanaian50 0.5% Arab48 0.4% French47 0.4% Iranian40 0.4% Afghan37 0.3% Nigerian31 0.3% Welsh29 0.3% Greek28 0.3% Romanian26 0.2% Croatian25 0.2% Czechoslovakian24 0.2% Scottish23 0.2% Belgian21 0.2% Canadian21 0.2% Slovene20 0.2% Danish18 0.2% British17 0.2% African15 0.1% Jamaican14 0.1% Finnish12 0.1% Bulgarian12 0.1% Scotch-Irish12 0.1% Liberian9 0.08% Scandinavian8 0.07% Austrian8 0.07% Hungarian8 0.07% Lebanese6 0.06% Brazilian6 0.06% Serbian5 0.05% Egyptian
Geographical mobility in Lisle Same house 1 year ago 13,278 85.9% White (Caucasian)587 61.4% Black or African American3,306 81.8% Asian358 61.9% Other race1,310 85.8% Two or more races13,487 86.8% White alone, not Hispanic / Latino1,056 69.1% Hispanic or LatinoMoved within same county 749 4.8% White / Caucasian77 8.0% Black or African American178 4.4% Asian143 24.7% Other race92 6.0% Two or more races653 4.2% White alone, not Hispanic / Latino238 15.6% Hispanic or LatinoMoved within same state 1,106 7.2% White / Caucasian275 28.7% Black or African American337 8.3% Asian51 8.8% Other race112 7.3% Two or more races1,083 7.0% White alone, not Hispanic / Latino193 12.6% Hispanic or LatinoMoved from different state 333 2.2% White / Caucasian5 0.5% Black or African American146 3.6% Asian16 1.1% Two or more races346 2.2% White alone, not Hispanic / Latino20 1.3% Hispanic or LatinoMoved from abroad 7 0.0% White92 2.3% Asian4 0.0% White alone, not Hispanic / Latino4 0.3% Hispanic or Latino
Children Nativity (place of birth) in Lisle
Children under 6 years - Living with two parents Both parents native 855 99.9% Native1 0.1% Foreign-bornBoth parents foreign-born 290 93.7% Native20 6.3% Foreign-bornOne native, one foreign-born parent 204 100.0% NativeChildren under 6 years - Living with one parent Native parent 206 100.0% NativeChildren 6 to 17 years - Living with two parents Both parents native 1,504 100.0% NativeBoth parents foreign-born 342 60.0% Native228 40.0% Foreign-bornOne native, one foreign-born parent 91 100.0% NativeChildren 6 to 17 years - Living with one parent Native parent 614 100.0% NativeForeign-born parent 125 64.5% Native69 35.5% Foreign-born
Grandparents responsible for own grandchildren in Lisle
Grandparents (30 to 59 years) White / Caucasian 16 100.0% Not responsible for grandchildrenAsian 29 51.2% Responsible for grandchildren28 48.8% Not responsible for grandchildrenWhite alone, not Hispanic / Latino 18 100.0% Not responsible for grandchildrenGrandparents (60 years and over) White / Caucasian 18 31.1% Responsible for grandchildren41 68.9% Not responsible for grandchildrenWhite alone, not Hispanic / Latino 20 40.8% Responsible for grandchildren29 59.2% Not responsible for grandchildren