Races in Livonia, Michigan (MI) Detailed Stats
Data:
Races - White alone (%)
Races - White alone (% change since 2000)
Races - Black alone (%)
Races - Black alone (% change since 2000)
Races - American Indian alone (%)
Races - American Indian alone (% change since 2000)
Races - Asian alone (%)
Races - Asian alone (% change since 2000)
Races - Hispanic (%)
Races - Hispanic (% change since 2000)
Races - Native Hawaiian and Other Pacific Islander alone (%)
Races - Native Hawaiian and Other Pacific Islander alone (% change since 2000)
Races - Two or more races(%)
Races - Two or more races(% change since 2000)
Races - Other race alone (%)
Races - Other race alone (% change since 2000)
Racial diversity
Place of birth - Born in state of residence (%)
Place of birth - Born in state of residence (%) - White
Place of birth - Born in state of residence (%) - Black or African American
Place of birth - Born in state of residence (%) - Asian
Place of birth - Born in state of residence (%) - Hispanic or Latino
Place of birth - Born in state of residence (%) - American Indian and Alaska Native
Place of birth - Born in state of residence (%) - Multirace
Place of birth - Born in state of residence (%) - Other Race
Place of birth - Born in other state (%)
Place of birth - Born in other state (%) - White
Place of birth - Born in other state (%) - Black or African American
Place of birth - Born in other state (%) - Asian
Place of birth - Born in other state (%) - Hispanic or Latino
Place of birth - Born in other state (%) - American Indian and Alaska Native
Place of birth - Born in other state (%) - Multirace
Place of birth - Born in other state (%) - Other Race
Place of birth - Native, outside of US (%)
Place of birth - Native, outside of US (%) - White
Place of birth - Native, outside of US (%) - Black or African American
Place of birth - Native, outside of US (%) - Asian
Place of birth - Native, outside of US (%) - Hispanic or Latino
Place of birth - Native, outside of US (%) - American Indian and Alaska Native
Place of birth - Native, outside of US (%) - Multirace
Place of birth - Native, outside of US (%) - Other Race
Place of birth - Foreign born (%)
Place of birth - Foreign born (%) - White
Place of birth - Foreign born (%) - Black or African American
Place of birth - Foreign born (%) - Asian
Place of birth - Foreign born (%) - Hispanic or Latino
Place of birth - Foreign born (%) - American Indian and Alaska Native
Place of birth - Foreign born (%) - Multirace
Place of birth - Foreign born (%) - Other Race
Residents speaking English at home (%)
Residents speaking English at home - Born in the United States (%)
Residents speaking English at home - Native, born elsewhere (%)
Residents speaking English at home - Foreign born (%)
Residents speaking Spanish at home (%)
Residents speaking Spanish at home - Born in the United States (%)
Residents speaking Spanish at home - Native, born elsewhere (%)
Residents speaking Spanish at home - Foreign born (%)
Residents speaking other language at home (%)
Residents speaking other language at home - Born in the United States (%)
Residents speaking other language at home - Native, born elsewhere (%)
Residents speaking other language at home - Foreign born (%)
Marital status - Never married (%)
Marital status - Now married (%)
Marital status - Separated (%)
Marital status - Widowed (%)
Marital status - Divorced (%)
Ancestries Reported - Arab (%)
Ancestries Reported - Czech (%)
Ancestries Reported - Danish (%)
Ancestries Reported - Dutch (%)
Ancestries Reported - English (%)
Ancestries Reported - French (%)
Ancestries Reported - French Canadian (%)
Ancestries Reported - German (%)
Ancestries Reported - Greek (%)
Ancestries Reported - Hungarian (%)
Ancestries Reported - Irish (%)
Ancestries Reported - Italian (%)
Ancestries Reported - Lithuanian (%)
Ancestries Reported - Norwegian (%)
Ancestries Reported - Polish (%)
Ancestries Reported - Portuguese (%)
Ancestries Reported - Russian (%)
Ancestries Reported - Scotch-Irish (%)
Ancestries Reported - Scottish (%)
Ancestries Reported - Slovak (%)
Ancestries Reported - Subsaharan African (%)
Ancestries Reported - Swedish (%)
Ancestries Reported - Swiss (%)
Ancestries Reported - Ukrainian (%)
Ancestries Reported - United States (%)
Ancestries Reported - Welsh (%)
Ancestries Reported - West Indian (%)
Ancestries Reported - Other (%)
Geographical mobility - Same house 1 year ago (%)
Geographical mobility - Same house 1 year ago (%) - White
Geographical mobility - Same house 1 year ago (%) - Black or African American
Geographical mobility - Same house 1 year ago (%) - Asian
Geographical mobility - Same house 1 year ago (%) - Hispanic or Latino
Geographical mobility - Same house 1 year ago (%) - American Indian and Alaska Native
Geographical mobility - Same house 1 year ago (%) - Multirace
Geographical mobility - Same house 1 year ago (%) - Other Race
Geographical mobility - Moved within same county (%)
Geographical mobility - Moved within same county (%) - White
Geographical mobility - Moved within same county (%) - Black or African American
Geographical mobility - Moved within same county (%) - Asian
Geographical mobility - Moved within same county (%) - Hispanic or Latino
Geographical mobility - Moved within same county (%) - American Indian and Alaska Native
Geographical mobility - Moved within same county (%) - Multirace
Geographical mobility - Moved within same county (%) - Other Race
Geographical mobility - Moved from different county within same state (%)
Geographical mobility - Moved from different county within same state (%) - White
Geographical mobility - Moved from different county within same state (%) - Black or African American
Geographical mobility - Moved from different county within same state (%) - Asian
Geographical mobility - Moved from different county within same state (%) - Hispanic or Latino
Geographical mobility - Moved from different county within same state (%) - American Indian and Alaska Native
Geographical mobility - Moved from different county within same state (%) - Multirace
Geographical mobility - Moved from different county within same state (%) - Other Race
Geographical mobility - Moved from different state (%)
Geographical mobility - Moved from different state (%) - White
Geographical mobility - Moved from different state (%) - Black or African American
Geographical mobility - Moved from different state (%) - Asian
Geographical mobility - Moved from different state (%) - Hispanic or Latino
Geographical mobility - Moved from different state (%) - American Indian and Alaska Native
Geographical mobility - Moved from different state (%) - Multirace
Geographical mobility - Moved from different state (%) - Other Race
Geographical mobility - Moved from abroad (%)
Geographical mobility - Moved from abroad (%) - White
Geographical mobility - Moved from abroad (%) - Black or African American
Geographical mobility - Moved from abroad (%) - Asian
Geographical mobility - Moved from abroad (%) - Hispanic or Latino
Geographical mobility - Moved from abroad (%) - American Indian and Alaska Native
Geographical mobility - Moved from abroad (%) - Multirace
Geographical mobility - Moved from abroad (%) - Other Race
Place of birth for the foreign-born population - Ireland (%)
Place of birth for the foreign-born population - Denmark (%)
Place of birth for the foreign-born population - Norway (%)
Place of birth for the foreign-born population - Sweden (%)
Place of birth for the foreign-born population - United Kingdom (%)
Place of birth for the foreign-born population - England (%)
Place of birth for the foreign-born population - Scotland (%)
Place of birth for the foreign-born population - Other Northern Europe (%)
Place of birth for the foreign-born population - Austria (%)
Place of birth for the foreign-born population - Belgium (%)
Place of birth for the foreign-born population - France (%)
Place of birth for the foreign-born population - Germany (%)
Place of birth for the foreign-born population - Netherlands (%)
Place of birth for the foreign-born population - Switzerland (%)
Place of birth for the foreign-born population - Other Western Europe (%)
Place of birth for the foreign-born population - Greece (%)
Place of birth for the foreign-born population - Italy (%)
Place of birth for the foreign-born population - Portugal (%)
Place of birth for the foreign-born population - Spain (%)
Place of birth for the foreign-born population - Other Southern Europe (%)
Place of birth for the foreign-born population - Albania (%)
Place of birth for the foreign-born population - Belarus (%)
Place of birth for the foreign-born population - Bosnia and Herzegovina (%)
Place of birth for the foreign-born population - Bulgaria (%)
Place of birth for the foreign-born population - Croatia (%)
Place of birth for the foreign-born population - Czechoslovakia (%)
Place of birth for the foreign-born population - Hungary (%)
Place of birth for the foreign-born population - Latvia (%)
Place of birth for the foreign-born population - Lithuania (%)
Place of birth for the foreign-born population - North Macedonia (Macedonia) (%)
Place of birth for the foreign-born population - Moldova (%)
Place of birth for the foreign-born population - Poland (%)
Place of birth for the foreign-born population - Romania (%)
Place of birth for the foreign-born population - Russia (%)
Place of birth for the foreign-born population - Serbia (%)
Place of birth for the foreign-born population - Ukraine (%)
Place of birth for the foreign-born population - Other Eastern Europe (%)
Place of birth for the foreign-born population - China (%)
Place of birth for the foreign-born population - Hong Kong (%)
Place of birth for the foreign-born population - Taiwan (%)
Place of birth for the foreign-born population - Japan (%)
Place of birth for the foreign-born population - Korea (%)
Place of birth for the foreign-born population - Other Eastern Asia (%)
Place of birth for the foreign-born population - Afghanistan (%)
Place of birth for the foreign-born population - Bangladesh (%)
Place of birth for the foreign-born population - India (%)
Place of birth for the foreign-born population - Iran (%)
Place of birth for the foreign-born population - Kazakhstan (%)
Place of birth for the foreign-born population - Nepal (%)
Place of birth for the foreign-born population - Pakistan (%)
Place of birth for the foreign-born population - Sri Lanka (%)
Place of birth for the foreign-born population - Uzbekistan (%)
Place of birth for the foreign-born population - Other South Central Asia (%)
Place of birth for the foreign-born population - Burma (%)
Place of birth for the foreign-born population - Cambodia (%)
Place of birth for the foreign-born population - Indonesia (%)
Place of birth for the foreign-born population - Laos (%)
Place of birth for the foreign-born population - Malaysia (%)
Place of birth for the foreign-born population - Philippines (%)
Place of birth for the foreign-born population - Singapore (%)
Place of birth for the foreign-born population - Thailand (%)
Place of birth for the foreign-born population - Vietnam (%)
Place of birth for the foreign-born population - Other South Eastern Asia (%)
Place of birth for the foreign-born population - Armenia (%)
Place of birth for the foreign-born population - Iraq (%)
Place of birth for the foreign-born population - Israel (%)
Place of birth for the foreign-born population - Jordan (%)
Place of birth for the foreign-born population - Kuwait (%)
Place of birth for the foreign-born population - Lebanon (%)
Place of birth for the foreign-born population - Saudi Arabia (%)
Place of birth for the foreign-born population - Syria (%)
Place of birth for the foreign-born population - Turkey (%)
Place of birth for the foreign-born population - Yemen (%)
Place of birth for the foreign-born population - Other Western Asia (%)
Place of birth for the foreign-born population - Eritrea (%)
Place of birth for the foreign-born population - Ethiopia (%)
Place of birth for the foreign-born population - Kenya (%)
Place of birth for the foreign-born population - Somalia (%)
Place of birth for the foreign-born population - Uganda (%)
Place of birth for the foreign-born population - Zimbabwe (%)
Place of birth for the foreign-born population - Other Eastern Africa (%)
Place of birth for the foreign-born population - Cameroon (%)
Place of birth for the foreign-born population - Congo (%)
Place of birth for the foreign-born population - Democratic Republic of Congo (Zaire) (%)
Place of birth for the foreign-born population - Other Middle Africa (%)
Place of birth for the foreign-born population - Egypt (%)
Place of birth for the foreign-born population - Morocco (%)
Place of birth for the foreign-born population - Sudan (%)
Place of birth for the foreign-born population - Other Northern Africa (%)
Place of birth for the foreign-born population - South Africa (%)
Place of birth for the foreign-born population - Other Southern Africa (%)
Place of birth for the foreign-born population - Cabo Verde (%)
Place of birth for the foreign-born population - Ghana (%)
Place of birth for the foreign-born population - Liberia (%)
Place of birth for the foreign-born population - Nigeria (%)
Place of birth for the foreign-born population - Senegal (%)
Place of birth for the foreign-born population - Sierra Leone (%)
Place of birth for the foreign-born population - Other Western Africa (%)
Place of birth for the foreign-born population - Australia (%)
Place of birth for the foreign-born population - New Zealand (%)
Place of birth for the foreign-born population - Fiji (%)
Place of birth for the foreign-born population - Micronesia (%)
Place of birth for the foreign-born population - Bahamas (%)
Place of birth for the foreign-born population - Barbados (%)
Place of birth for the foreign-born population - Cuba (%)
Place of birth for the foreign-born population - Dominica (%)
Place of birth for the foreign-born population - Dominican Republic (%)
Place of birth for the foreign-born population - Grenada (%)
Place of birth for the foreign-born population - Haiti (%)
Place of birth for the foreign-born population - Jamaica (%)
Place of birth for the foreign-born population - St. Vincent and the Grenadines (%)
Place of birth for the foreign-born population - Trinidad and Tobago (%)
Place of birth for the foreign-born population - West Indies (%)
Place of birth for the foreign-born population - Other Caribbean (%)
Place of birth for the foreign-born population - Belize (%)
Place of birth for the foreign-born population - Costa Rica (%)
Place of birth for the foreign-born population - El Salvador (%)
Place of birth for the foreign-born population - Guatemala (%)
Place of birth for the foreign-born population - Honduras (%)
Place of birth for the foreign-born population - Mexico (%)
Place of birth for the foreign-born population - Nicaragua (%)
Place of birth for the foreign-born population - Panama (%)
Place of birth for the foreign-born population - Other Central America (%)
Place of birth for the foreign-born population - Argentina (%)
Place of birth for the foreign-born population - Bolivia (%)
Place of birth for the foreign-born population - Brazil (%)
Place of birth for the foreign-born population - Chile (%)
Place of birth for the foreign-born population - Colombia (%)
Place of birth for the foreign-born population - Ecuador (%)
Place of birth for the foreign-born population - Guyana (%)
Place of birth for the foreign-born population - Peru (%)
Place of birth for the foreign-born population - Uruguay (%)
Place of birth for the foreign-born population - Venezuela (%)
Place of birth for the foreign-born population - Other South America (%)
Place of birth for the foreign-born population - Canada (%)
Place of birth for the foreign-born population - Other Northern America (%)
Place of birth for the foreign-born population - Other (%)
Latest news about races in Livonia, MI collected exclusively by city-data.com from local newspapers, TV, and radio stations
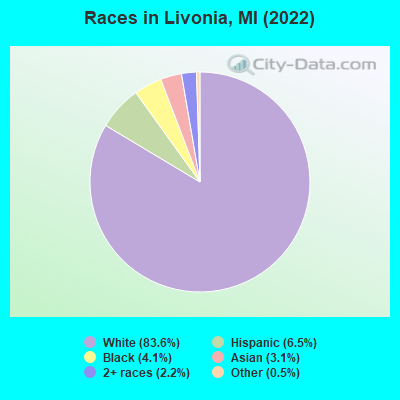
According to 2022 data, the most numerous races in Livonia, MI are White alone (78,408 residents), Black alone (3,800 residents), and Hispanic (6,085 residents). 88.4% of Livonia residents speak English at home. 8.2% of Livonia, MI residents are foreign-born (4.0% born in Asia, 2.5% born in Europe, 0.9% born in Latin America), which is 26.9% greater than the foreign-born rate of 6.0% across the entire state of Michigan.
Race distribution in Livonia
2000 2022
7,806,691 78.6% White alone 1,402,047 14.1% Black alone 323,877 3.3% Hispanic 175,311 1.8% Asian alone 163,487 1.6% Two or more races 53,421 0.5% American Indian alone 11,465 0.1% Other race alone 2,145 0.02% Native Hawaiian and Other
7,289,051 72.6% White alone 1,310,464 13.1% Black alone 572,405 5.7% Hispanic 450,031 4.5% Two or more races 335,732 3.3% Asian alone 45,217 0.5% Other race alone 29,011 0.3% American Indian alone 2,207 0.02% Native Hawaiian and Other
Income and house value in Livonia Median household income in 2022 $92,237 White non-Hispanic householders$60,707 Black householders$86,960 American Indian and Alaska Native householders$79,848 Asian householders$63,438 Some other race householders$123,109 Two or more races householders$81,480 Hispanic or Latino race householdersMedian 2022 house value $271,850 White Non-Hispanic householders$239,483 Black or African American householders$191,855 American Indian or Alaska Native householders $285,099 Asian householders$228,750 Some other race householders$213,657 Two or more races householders$238,142 Hispanic or Latino householders
Median age by race in Livonia
45.1 Median age for White residents44.4 46.1 48.9 Median age for Black or African American residents42.3 56.8 29.0 Median age for American Indian / Alaska Native residents38.2 22.8 54.2 Median age for Asian residents49.8 54.7 -666,666,666.0 Median age for Native Hawaiian / Pacific Islander residents-666,666,666.0 -666,666,666.0 19.7 Median age for Other race residents19.5 21.6 28.0 Median age for Two or more races residents24.6 35.5 46.8 Median age for White alone residents47.0 46.7 26.1 Median age for Hispanic or Latino residents19.5 31.3
Owner/renter occupied households by race in Livonia
House owners and renters - White residents 30,657 90.1% Owner occupied3,378 9.9% Renter occupiedHouse owners and renters - Black or African American residents 985 43.8% Owner occupied1,265 56.2% Renter occupiedHouse owners and renters - American Indian / Alaska Native residents 103 100.0% Owner occupiedHouse owners and renters - Asian residents 1,093 82.6% Owner occupied230 17.4% Renter occupiedHouse owners and renters - Other race residents 294 97.3% Owner occupied8 2.7% Renter occupiedHouse owners and renters - Two or more races residents 1,202 100.0% Owner occupiedHouse owners and renters - White alone residents 30,343 90.4% Owner occupied3,230 9.6% Renter occupiedHouse owners and renters - Hispanic or Latino residents 799 68.5% Owner occupied367 31.5% Renter occupied
Language usage in Livonia
English speakers - Total 88.4% of residents of Livonia speak English at home.
2.2% of residents speak Spanish at home 1,587 80.2% Speak English very well392 19.8% Speak English less than very well9.4% of residents speak other language at home 5,643 67.9% Speak English very well2,665 32.1% Speak English less than very well
English speakers - Born in the United States 89.6% of residents of Livonia speak English at home.
5.3% of residents speak Spanish at home 598 93.0% Speak English very well45 7.0% Speak English less than very well5.1% of residents speak other language at home 540 88.1% Speak English very well73 11.9% Speak English less than very well
English speakers - Native, born elsewhere 81.3% of residents of Livonia speak English at home.
18.7% of residents speak Spanish at home 29 37.7% Speak English very well48 62.3% Speak English less than very well
English speakers - Foreign-born 22.8% of residents of Livonia speak English at home.
7.0% of residents speak Spanish at home 249 45.4% Speak English very well299 54.6% Speak English less than very well70.2% of residents speak other language at home 3,159 57.5% Speak English very well2,337 42.5% Speak English less than very well
White (Caucasian) - Speak only English Native:
96.1% (68,462)Foreign-born:
26.2% (1,408)
White (Caucasian) - Speak another language Native:
3.9% (2,775)Foreign-born:
73.8% (3,972)
Black or African American - Speak only English Native:
100.0% (3,975)Foreign-born:
47.7% (31)
Black or African American - Speak another language Native:
0.2% (7)Foreign-born:
52.7% (35)
American Indian / Alaska Native - Speak only English Native:
65.1% (133)Foreign-born:
18.6% (12)
American Indian / Alaska Native - Speak another language Native:
32.4% (66)Foreign-born:
31.3% (21)
Asian - Speak only English Native:
53.6% (567)Foreign-born:
7.4% (140)
Asian - Speak another language Native:
46.4% (491)Foreign-born:
92.6% (1,748)
Other race - Speak only English Native:
74.8% (633)Foreign-born:
29.7% (91)
Other race - Speak another language Native:
16.6% (140)Foreign-born:
57.3% (176)
Two or more races - Speak only English Native:
86.2% (4,244)Foreign-born:
23.2% (113)
Two or more races - Speak another language Native:
13.2% (652)Foreign-born:
73.9% (360)
White alone - Speak only English Native:
96.3% (67,043)Foreign-born:
27.1% (1,378)
White alone - Speak another language Native:
3.7% (2,568)Foreign-born:
72.9% (3,701)
Hispanic or Latino - Speak only English Native:
76.0% (3,506)Foreign-born:
11.8% (73)
Hispanic or Latino - Speak another language Native:
24.0% (1,105)Foreign-born:
88.2% (548)
Foreign-born residents in Livonia 7,689 residents are foreign born (4.0% Asia , 2.5% Europe , 0.9% Latin America ).
This city:
8.2%Michigan:
6.9%
Marital status for residents in Livonia Marital status - White (Caucasian) population 15 years and over
Males 33.3% Never married51.4% Now married0.7% Separated4.4% Widowed10.2% DivorcedFemales 23.7% Never married51.3% Now married0.9% Separated11.3% Widowed12.8% DivorcedWomen who gave birth in the past 12 months Now married:
94.6% (1,049)Unmarried:
5.4% (60)
Women who did not give birth in the past 12 months Now married:
46.3% (7,163)Unmarried:
53.7% (8,296)
Marital status - Black or African American population 15 years and over
Males 43.1% Never married41.2% Now married0.0% Separated11.1% Widowed4.6% DivorcedFemales 27.5% Never married31.2% Now married2.8% Separated24.9% Widowed13.6% DivorcedWomen who gave birth in the past 12 months Now married:
20.0% (8)Unmarried:
80.0% (32)
Women who did not give birth in the past 12 months Now married:
54.3% (438)Unmarried:
45.7% (368)
Marital status - American Indian / Alaska Native population 15 years and over
Males 57.1% Never married32.3% Now married0.0% Separated0.0% Widowed10.5% DivorcedFemales 21.6% Never married65.7% Now married0.0% Separated5.9% Widowed6.9% DivorcedWomen who did not give birth in the past 12 months Now married:
34.1% (15)Unmarried:
65.9% (30)
Marital status - Asian population 15 years and over
Males 25.6% Never married70.6% Now married0.7% Separated0.7% Widowed2.4% DivorcedFemales 12.3% Never married73.6% Now married1.8% Separated7.9% Widowed4.5% DivorcedWomen who gave birth in the past 12 months Now married:
76.3% (44)Unmarried:
23.7% (14)
Women who did not give birth in the past 12 months Now married:
69.7% (399)Unmarried:
30.3% (174)
Marital status - Other race population 15 years and over
Males 47.2% Never married43.8% Now married0.0% Separated0.0% Widowed9.0% DivorcedFemales 50.1% Never married35.2% Now married0.0% Separated0.0% Widowed14.7% DivorcedWomen who gave birth in the past 12 months Now married:
100.0% (6)Unmarried:
0.0% (0)
Women who did not give birth in the past 12 months Now married:
30.5% (110)Unmarried:
69.5% (250)
Marital status - Two or more races population 15 years and over
Males 53.9% Never married39.1% Now married0.6% Separated2.0% Widowed4.5% DivorcedFemales 43.5% Never married44.9% Now married0.0% Separated4.4% Widowed7.1% DivorcedWomen who gave birth in the past 12 months Now married:
100.0% (24)Unmarried:
0.0% (0)
Women who did not give birth in the past 12 months Now married:
36.5% (460)Unmarried:
63.5% (800)
Marital status - White alone, not Hispanic / Latino population 15 years and over
Males 33.0% Never married51.6% Now married0.7% Separated4.5% Widowed10.2% DivorcedFemales 23.8% Never married51.3% Now married0.9% Separated11.2% Widowed12.8% DivorcedWomen who gave birth in the past 12 months Now married:
94.6% (1,049)Unmarried:
5.4% (60)
Women who did not give birth in the past 12 months Now married:
45.6% (6,795)Unmarried:
54.4% (8,115)
Marital status - Hispanic or Latino population 15 years and over
Males 45.5% Never married41.7% Now married0.5% Separated2.5% Widowed9.8% DivorcedFemales 41.1% Never married45.4% Now married0.0% Separated4.0% Widowed9.5% DivorcedWomen who gave birth in the past 12 months Now married:
100.0% (38)Unmarried:
0.0% (0)
Women who did not give birth in the past 12 months Now married:
39.2% (293)Unmarried:
60.8% (454)
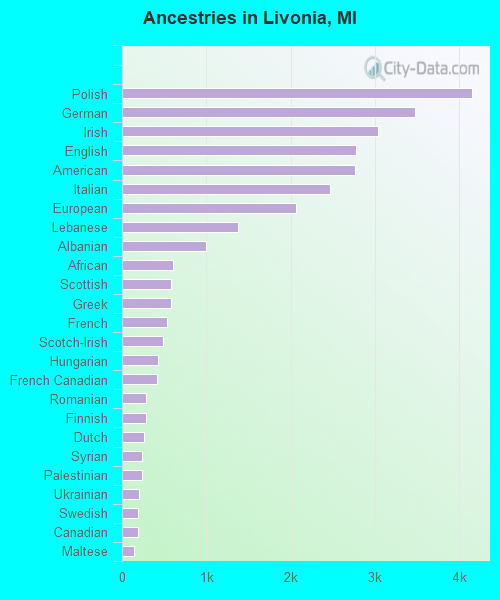
Ancestries in Livonia
4,145 10.7% Polish3,470 8.9% German3,032 7.8% Irish2,774 7.2% English2,766 7.1% American2,471 6.4% Italian2,069 5.3% European1,379 3.6% Lebanese994 2.6% Albanian606 1.6% African586 1.5% Scottish584 1.5% Greek538 1.4% French490 1.3% Scotch-Irish428 1.1% Hungarian411 1.1% French Canadian289 0.7% Romanian283 0.7% Finnish259 0.7% Dutch237 0.6% Syrian236 0.6% Palestinian198 0.5% Ukrainian190 0.5% Swedish186 0.5% Canadian138 0.4% Maltese131 0.3% Eastern European116 0.3% British113 0.3% Egyptian113 0.3% Czech111 0.3% Norwegian109 0.3% Armenian108 0.3% Serbian107 0.3% Slovak99 0.3% Welsh98 0.3% Arab87 0.2% Danish81 0.2% Lithuanian71 0.2% Brazilian66 0.2% Scandinavian58 0.1% Russian58 0.1% Portuguese48 0.1% Moroccan44 0.1% Jamaican39 0.1% Assyrian39 0.1% Macedonian34 0.09% Iraqi30 0.08% Croatian30 0.08% Bulgarian28 0.07% Yugoslavian27 0.07% Jordanian24 0.06% Czechoslovakian21 0.05% Icelander21 0.05% Afghan21 0.05% Latvian20 0.05% Slovene16 0.04% Slavic16 0.04% Ghanaian14 0.04% Belgian12 0.03% Northern European11 0.03% Austrian10 0.03% Belizean8 0.02% Nigerian7 0.02% New Zealander6 0.02% Cypriot5 0.01% Turkish4 0.01% Iranian
Geographical mobility in Livonia Same house 1 year ago 72,949 91.3% White (Caucasian)3,499 83.9% Black or African American190 65.4% American Indian / Alaska Native3,314 95.5% Asian952 82.5% Other race5,445 89.9% Two or more races71,300 91.7% White alone, not Hispanic / Latino3,524 85.0% Hispanic or LatinoMoved within same county 3,770 4.7% White / Caucasian342 8.2% Black or African American66 22.5% American Indian / Alaska Native35 1.0% Asian191 16.5% Other race277 4.6% Two or more races3,631 4.7% White alone, not Hispanic / Latino346 8.4% Hispanic or LatinoMoved within same state 2,161 2.7% White / Caucasian232 5.6% Black or African American18 6.3% American Indian / Alaska Native23 0.7% Asian199 3.3% Two or more races2,129 2.7% White alone, not Hispanic / Latino122 2.9% Hispanic or LatinoMoved from different state 1,008 1.3% White / Caucasian40 1.0% Black or African American46 1.3% Asian28 2.4% Other race70 1.2% Two or more races608 0.8% White alone, not Hispanic / Latino195 4.7% Hispanic or LatinoMoved from abroad 51 0.1% White3 0.1% Black or African American148 4.3% Asian51 0.1% White alone, not Hispanic / Latino
Children Nativity (place of birth) in Livonia
Children under 6 years - Living with two parents Both parents native 3,509 100.0% NativeBoth parents foreign-born 307 90.9% Native31 9.1% Foreign-bornOne native, one foreign-born parent 539 100.0% NativeChildren under 6 years - Living with one parent Native parent 813 100.0% NativeForeign-born parent 35 100.0% NativeChildren 6 to 17 years - Living with two parents Both parents native 7,152 98.8% Native84 1.2% Foreign-bornBoth parents foreign-born 390 63.2% Native228 36.8% Foreign-bornOne native, one foreign-born parent 650 95.6% Native30 4.4% Foreign-bornChildren 6 to 17 years - Living with one parent Native parent 2,732 98.1% Native53 1.9% Foreign-bornForeign-born parent 64 62.6% Native38 37.4% Foreign-born
Place of birth for residents in Livonia
Grandparents responsible for own grandchildren in Livonia
Grandparents (30 to 59 years) White / Caucasian 123 53.6% Responsible for grandchildren107 46.4% Not responsible for grandchildrenBlack or African American 10 100.0% Not responsible for grandchildrenOther race 15 100.0% Responsible for grandchildrenTwo or more races 61 100.0% Not responsible for grandchildrenWhite alone, not Hispanic / Latino 123 59.3% Responsible for grandchildren85 40.7% Not responsible for grandchildrenHispanic or Latino 4 2.3% Responsible for grandchildren152 97.7% Not responsible for grandchildrenGrandparents (60 years and over) White / Caucasian 97 24.6% Responsible for grandchildren299 75.4% Not responsible for grandchildrenBlack or African American 19 38.2% Responsible for grandchildren31 61.8% Not responsible for grandchildrenOther race 19 100.0% Not responsible for grandchildrenTwo or more races 13 52.0% Responsible for grandchildren12 48.0% Not responsible for grandchildrenWhite alone, not Hispanic / Latino 91 22.6% Responsible for grandchildren311 77.4% Not responsible for grandchildrenHispanic or Latino 7 34.3% Responsible for grandchildren14 65.7% Not responsible for grandchildren