Races in Lomita, California (CA) Detailed Stats
Data:
Races - White alone (%)
Races - White alone (% change since 2000)
Races - Black alone (%)
Races - Black alone (% change since 2000)
Races - American Indian alone (%)
Races - American Indian alone (% change since 2000)
Races - Asian alone (%)
Races - Asian alone (% change since 2000)
Races - Hispanic (%)
Races - Hispanic (% change since 2000)
Races - Native Hawaiian and Other Pacific Islander alone (%)
Races - Native Hawaiian and Other Pacific Islander alone (% change since 2000)
Races - Two or more races(%)
Races - Two or more races(% change since 2000)
Races - Other race alone (%)
Races - Other race alone (% change since 2000)
Racial diversity
Place of birth - Born in state of residence (%)
Place of birth - Born in state of residence (%) - White
Place of birth - Born in state of residence (%) - Black or African American
Place of birth - Born in state of residence (%) - Asian
Place of birth - Born in state of residence (%) - Hispanic or Latino
Place of birth - Born in state of residence (%) - American Indian and Alaska Native
Place of birth - Born in state of residence (%) - Multirace
Place of birth - Born in state of residence (%) - Other Race
Place of birth - Born in other state (%)
Place of birth - Born in other state (%) - White
Place of birth - Born in other state (%) - Black or African American
Place of birth - Born in other state (%) - Asian
Place of birth - Born in other state (%) - Hispanic or Latino
Place of birth - Born in other state (%) - American Indian and Alaska Native
Place of birth - Born in other state (%) - Multirace
Place of birth - Born in other state (%) - Other Race
Place of birth - Native, outside of US (%)
Place of birth - Native, outside of US (%) - White
Place of birth - Native, outside of US (%) - Black or African American
Place of birth - Native, outside of US (%) - Asian
Place of birth - Native, outside of US (%) - Hispanic or Latino
Place of birth - Native, outside of US (%) - American Indian and Alaska Native
Place of birth - Native, outside of US (%) - Multirace
Place of birth - Native, outside of US (%) - Other Race
Place of birth - Foreign born (%)
Place of birth - Foreign born (%) - White
Place of birth - Foreign born (%) - Black or African American
Place of birth - Foreign born (%) - Asian
Place of birth - Foreign born (%) - Hispanic or Latino
Place of birth - Foreign born (%) - American Indian and Alaska Native
Place of birth - Foreign born (%) - Multirace
Place of birth - Foreign born (%) - Other Race
Residents speaking English at home (%)
Residents speaking English at home - Born in the United States (%)
Residents speaking English at home - Native, born elsewhere (%)
Residents speaking English at home - Foreign born (%)
Residents speaking Spanish at home (%)
Residents speaking Spanish at home - Born in the United States (%)
Residents speaking Spanish at home - Native, born elsewhere (%)
Residents speaking Spanish at home - Foreign born (%)
Residents speaking other language at home (%)
Residents speaking other language at home - Born in the United States (%)
Residents speaking other language at home - Native, born elsewhere (%)
Residents speaking other language at home - Foreign born (%)
Marital status - Never married (%)
Marital status - Now married (%)
Marital status - Separated (%)
Marital status - Widowed (%)
Marital status - Divorced (%)
Ancestries Reported - Arab (%)
Ancestries Reported - Czech (%)
Ancestries Reported - Danish (%)
Ancestries Reported - Dutch (%)
Ancestries Reported - English (%)
Ancestries Reported - French (%)
Ancestries Reported - French Canadian (%)
Ancestries Reported - German (%)
Ancestries Reported - Greek (%)
Ancestries Reported - Hungarian (%)
Ancestries Reported - Irish (%)
Ancestries Reported - Italian (%)
Ancestries Reported - Lithuanian (%)
Ancestries Reported - Norwegian (%)
Ancestries Reported - Polish (%)
Ancestries Reported - Portuguese (%)
Ancestries Reported - Russian (%)
Ancestries Reported - Scotch-Irish (%)
Ancestries Reported - Scottish (%)
Ancestries Reported - Slovak (%)
Ancestries Reported - Subsaharan African (%)
Ancestries Reported - Swedish (%)
Ancestries Reported - Swiss (%)
Ancestries Reported - Ukrainian (%)
Ancestries Reported - United States (%)
Ancestries Reported - Welsh (%)
Ancestries Reported - West Indian (%)
Ancestries Reported - Other (%)
Geographical mobility - Same house 1 year ago (%)
Geographical mobility - Same house 1 year ago (%) - White
Geographical mobility - Same house 1 year ago (%) - Black or African American
Geographical mobility - Same house 1 year ago (%) - Asian
Geographical mobility - Same house 1 year ago (%) - Hispanic or Latino
Geographical mobility - Same house 1 year ago (%) - American Indian and Alaska Native
Geographical mobility - Same house 1 year ago (%) - Multirace
Geographical mobility - Same house 1 year ago (%) - Other Race
Geographical mobility - Moved within same county (%)
Geographical mobility - Moved within same county (%) - White
Geographical mobility - Moved within same county (%) - Black or African American
Geographical mobility - Moved within same county (%) - Asian
Geographical mobility - Moved within same county (%) - Hispanic or Latino
Geographical mobility - Moved within same county (%) - American Indian and Alaska Native
Geographical mobility - Moved within same county (%) - Multirace
Geographical mobility - Moved within same county (%) - Other Race
Geographical mobility - Moved from different county within same state (%)
Geographical mobility - Moved from different county within same state (%) - White
Geographical mobility - Moved from different county within same state (%) - Black or African American
Geographical mobility - Moved from different county within same state (%) - Asian
Geographical mobility - Moved from different county within same state (%) - Hispanic or Latino
Geographical mobility - Moved from different county within same state (%) - American Indian and Alaska Native
Geographical mobility - Moved from different county within same state (%) - Multirace
Geographical mobility - Moved from different county within same state (%) - Other Race
Geographical mobility - Moved from different state (%)
Geographical mobility - Moved from different state (%) - White
Geographical mobility - Moved from different state (%) - Black or African American
Geographical mobility - Moved from different state (%) - Asian
Geographical mobility - Moved from different state (%) - Hispanic or Latino
Geographical mobility - Moved from different state (%) - American Indian and Alaska Native
Geographical mobility - Moved from different state (%) - Multirace
Geographical mobility - Moved from different state (%) - Other Race
Geographical mobility - Moved from abroad (%)
Geographical mobility - Moved from abroad (%) - White
Geographical mobility - Moved from abroad (%) - Black or African American
Geographical mobility - Moved from abroad (%) - Asian
Geographical mobility - Moved from abroad (%) - Hispanic or Latino
Geographical mobility - Moved from abroad (%) - American Indian and Alaska Native
Geographical mobility - Moved from abroad (%) - Multirace
Geographical mobility - Moved from abroad (%) - Other Race
Place of birth for the foreign-born population - Ireland (%)
Place of birth for the foreign-born population - Denmark (%)
Place of birth for the foreign-born population - Norway (%)
Place of birth for the foreign-born population - Sweden (%)
Place of birth for the foreign-born population - United Kingdom (%)
Place of birth for the foreign-born population - England (%)
Place of birth for the foreign-born population - Scotland (%)
Place of birth for the foreign-born population - Other Northern Europe (%)
Place of birth for the foreign-born population - Austria (%)
Place of birth for the foreign-born population - Belgium (%)
Place of birth for the foreign-born population - France (%)
Place of birth for the foreign-born population - Germany (%)
Place of birth for the foreign-born population - Netherlands (%)
Place of birth for the foreign-born population - Switzerland (%)
Place of birth for the foreign-born population - Other Western Europe (%)
Place of birth for the foreign-born population - Greece (%)
Place of birth for the foreign-born population - Italy (%)
Place of birth for the foreign-born population - Portugal (%)
Place of birth for the foreign-born population - Spain (%)
Place of birth for the foreign-born population - Other Southern Europe (%)
Place of birth for the foreign-born population - Albania (%)
Place of birth for the foreign-born population - Belarus (%)
Place of birth for the foreign-born population - Bosnia and Herzegovina (%)
Place of birth for the foreign-born population - Bulgaria (%)
Place of birth for the foreign-born population - Croatia (%)
Place of birth for the foreign-born population - Czechoslovakia (%)
Place of birth for the foreign-born population - Hungary (%)
Place of birth for the foreign-born population - Latvia (%)
Place of birth for the foreign-born population - Lithuania (%)
Place of birth for the foreign-born population - North Macedonia (Macedonia) (%)
Place of birth for the foreign-born population - Moldova (%)
Place of birth for the foreign-born population - Poland (%)
Place of birth for the foreign-born population - Romania (%)
Place of birth for the foreign-born population - Russia (%)
Place of birth for the foreign-born population - Serbia (%)
Place of birth for the foreign-born population - Ukraine (%)
Place of birth for the foreign-born population - Other Eastern Europe (%)
Place of birth for the foreign-born population - China (%)
Place of birth for the foreign-born population - Hong Kong (%)
Place of birth for the foreign-born population - Taiwan (%)
Place of birth for the foreign-born population - Japan (%)
Place of birth for the foreign-born population - Korea (%)
Place of birth for the foreign-born population - Other Eastern Asia (%)
Place of birth for the foreign-born population - Afghanistan (%)
Place of birth for the foreign-born population - Bangladesh (%)
Place of birth for the foreign-born population - India (%)
Place of birth for the foreign-born population - Iran (%)
Place of birth for the foreign-born population - Kazakhstan (%)
Place of birth for the foreign-born population - Nepal (%)
Place of birth for the foreign-born population - Pakistan (%)
Place of birth for the foreign-born population - Sri Lanka (%)
Place of birth for the foreign-born population - Uzbekistan (%)
Place of birth for the foreign-born population - Other South Central Asia (%)
Place of birth for the foreign-born population - Burma (%)
Place of birth for the foreign-born population - Cambodia (%)
Place of birth for the foreign-born population - Indonesia (%)
Place of birth for the foreign-born population - Laos (%)
Place of birth for the foreign-born population - Malaysia (%)
Place of birth for the foreign-born population - Philippines (%)
Place of birth for the foreign-born population - Singapore (%)
Place of birth for the foreign-born population - Thailand (%)
Place of birth for the foreign-born population - Vietnam (%)
Place of birth for the foreign-born population - Other South Eastern Asia (%)
Place of birth for the foreign-born population - Armenia (%)
Place of birth for the foreign-born population - Iraq (%)
Place of birth for the foreign-born population - Israel (%)
Place of birth for the foreign-born population - Jordan (%)
Place of birth for the foreign-born population - Kuwait (%)
Place of birth for the foreign-born population - Lebanon (%)
Place of birth for the foreign-born population - Saudi Arabia (%)
Place of birth for the foreign-born population - Syria (%)
Place of birth for the foreign-born population - Turkey (%)
Place of birth for the foreign-born population - Yemen (%)
Place of birth for the foreign-born population - Other Western Asia (%)
Place of birth for the foreign-born population - Eritrea (%)
Place of birth for the foreign-born population - Ethiopia (%)
Place of birth for the foreign-born population - Kenya (%)
Place of birth for the foreign-born population - Somalia (%)
Place of birth for the foreign-born population - Uganda (%)
Place of birth for the foreign-born population - Zimbabwe (%)
Place of birth for the foreign-born population - Other Eastern Africa (%)
Place of birth for the foreign-born population - Cameroon (%)
Place of birth for the foreign-born population - Congo (%)
Place of birth for the foreign-born population - Democratic Republic of Congo (Zaire) (%)
Place of birth for the foreign-born population - Other Middle Africa (%)
Place of birth for the foreign-born population - Egypt (%)
Place of birth for the foreign-born population - Morocco (%)
Place of birth for the foreign-born population - Sudan (%)
Place of birth for the foreign-born population - Other Northern Africa (%)
Place of birth for the foreign-born population - South Africa (%)
Place of birth for the foreign-born population - Other Southern Africa (%)
Place of birth for the foreign-born population - Cabo Verde (%)
Place of birth for the foreign-born population - Ghana (%)
Place of birth for the foreign-born population - Liberia (%)
Place of birth for the foreign-born population - Nigeria (%)
Place of birth for the foreign-born population - Senegal (%)
Place of birth for the foreign-born population - Sierra Leone (%)
Place of birth for the foreign-born population - Other Western Africa (%)
Place of birth for the foreign-born population - Australia (%)
Place of birth for the foreign-born population - New Zealand (%)
Place of birth for the foreign-born population - Fiji (%)
Place of birth for the foreign-born population - Micronesia (%)
Place of birth for the foreign-born population - Bahamas (%)
Place of birth for the foreign-born population - Barbados (%)
Place of birth for the foreign-born population - Cuba (%)
Place of birth for the foreign-born population - Dominica (%)
Place of birth for the foreign-born population - Dominican Republic (%)
Place of birth for the foreign-born population - Grenada (%)
Place of birth for the foreign-born population - Haiti (%)
Place of birth for the foreign-born population - Jamaica (%)
Place of birth for the foreign-born population - St. Vincent and the Grenadines (%)
Place of birth for the foreign-born population - Trinidad and Tobago (%)
Place of birth for the foreign-born population - West Indies (%)
Place of birth for the foreign-born population - Other Caribbean (%)
Place of birth for the foreign-born population - Belize (%)
Place of birth for the foreign-born population - Costa Rica (%)
Place of birth for the foreign-born population - El Salvador (%)
Place of birth for the foreign-born population - Guatemala (%)
Place of birth for the foreign-born population - Honduras (%)
Place of birth for the foreign-born population - Mexico (%)
Place of birth for the foreign-born population - Nicaragua (%)
Place of birth for the foreign-born population - Panama (%)
Place of birth for the foreign-born population - Other Central America (%)
Place of birth for the foreign-born population - Argentina (%)
Place of birth for the foreign-born population - Bolivia (%)
Place of birth for the foreign-born population - Brazil (%)
Place of birth for the foreign-born population - Chile (%)
Place of birth for the foreign-born population - Colombia (%)
Place of birth for the foreign-born population - Ecuador (%)
Place of birth for the foreign-born population - Guyana (%)
Place of birth for the foreign-born population - Peru (%)
Place of birth for the foreign-born population - Uruguay (%)
Place of birth for the foreign-born population - Venezuela (%)
Place of birth for the foreign-born population - Other South America (%)
Place of birth for the foreign-born population - Canada (%)
Place of birth for the foreign-born population - Other Northern America (%)
Place of birth for the foreign-born population - Other (%)
Latest news about races in Lomita, CA collected exclusively by city-data.com from local newspapers, TV, and radio stations
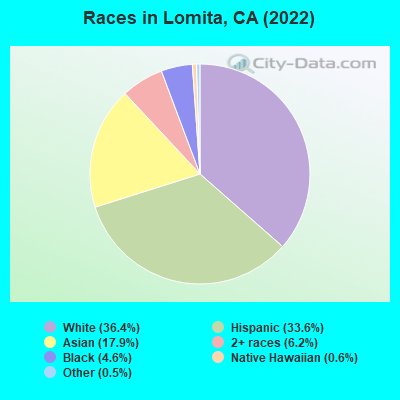
According to 2022 data, the most numerous races in Lomita, CA are Hispanic (6,965 residents), White alone (7,547 residents), and Asian alone (3,405 residents). 65.5% of Lomita residents speak English at home. 20.4% of Lomita, CA residents are foreign-born (9.5% born in Asia, 7.6% born in Latin America), which is 27.2% less than the foreign-born rate of 26.0% across the entire state of California.
Race distribution in Lomita
2000 2022
15,816,790 46.7% White alone 10,966,556 32.4% Hispanic 3,648,860 10.8% Asian alone 2,181,926 6.4% Black alone 903,115 2.7% Two or more races 178,984 0.5% American Indian alone 103,736 0.3% Native Hawaiian and Other 71,681 0.2% Other race alone
15,732,184 40.3% Hispanic 13,160,426 33.7% White alone 5,957,867 15.3% Asian alone 2,025,218 5.2% Black alone 1,663,222 4.3% Two or more races 251,618 0.6% Other race alone 135,777 0.3% Native Hawaiian and Other 103,030 0.3% American Indian alone
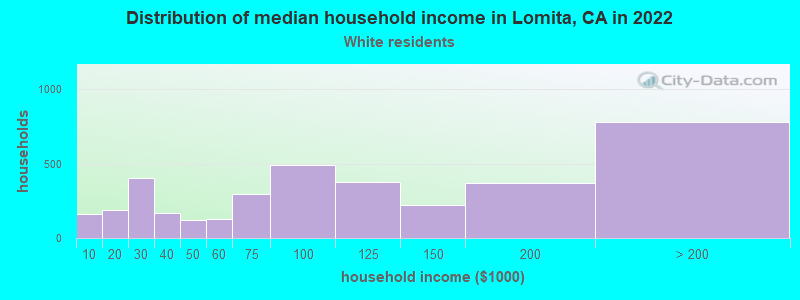
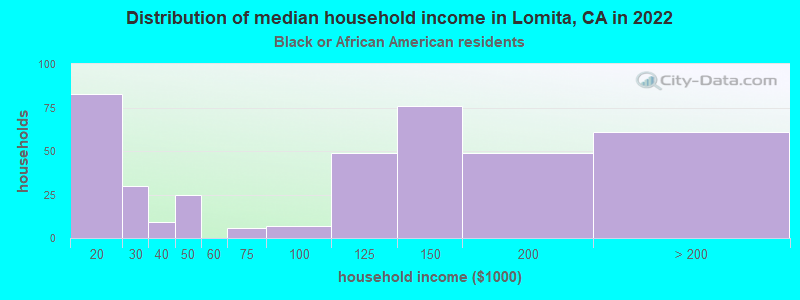
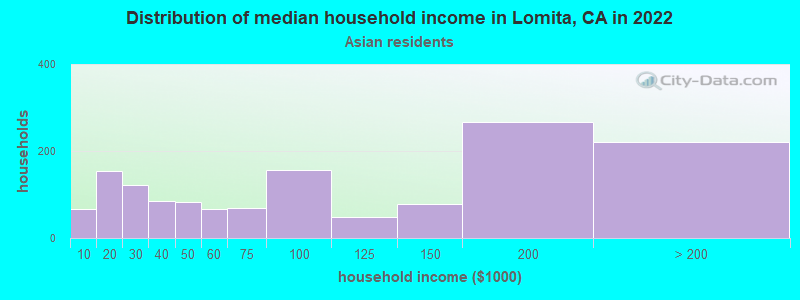
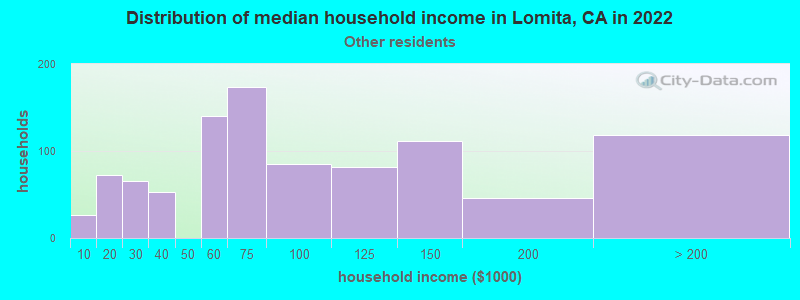
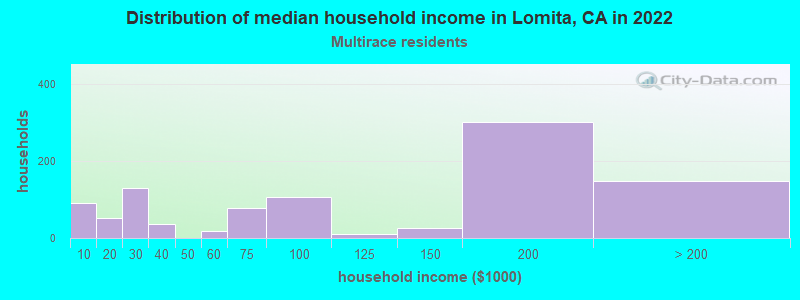
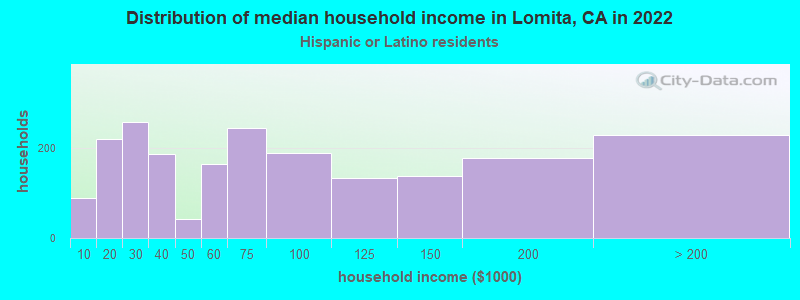
Income and house value in Lomita Median household income in 2022 $103,762 White non-Hispanic householders$50,198 Black householders$130,310 American Indian and Alaska Native householders$93,843 Asian householdersover $200,000 Native Hawaiian and other Pacific Islander householders$80,306 Some other race householders$90,224 Two or more races householders$89,146 Hispanic or Latino race householdersMedian 2022 house value $953,093 White Non-Hispanic householdersover $1,000,000 Black or African American householders$889,746 American Indian or Alaska Native householders $999,164 Asian householders$841,515 Some other race householders$868,510 Two or more races householders$868,150 Hispanic or Latino householders
Median age by race in Lomita
48.6 Median age for White residents48.4 48.5 32.2 Median age for Black or African American residents25.9 32.3 25.0 Median age for American Indian / Alaska Native residents54.6 24.4 50.0 Median age for Asian residents51.5 48.8 51.9 Median age for Native Hawaiian / Pacific Islander residents32.7 Median age for Other race residents35.8 27.9 24.7 Median age for Two or more races residents24.9 19.9 51.7 Median age for White alone residents49.9 52.6 30.1 Median age for Hispanic or Latino residents32.2 28.4
Owner/renter occupied households by race in Lomita
House owners and renters - White residents 2,404 55.5% Owner occupied1,927 44.5% Renter occupiedHouse owners and renters - Black or African American residents 102 22.6% Owner occupied348 77.4% Renter occupiedHouse owners and renters - American Indian / Alaska Native residents 29 100.0% Renter occupiedHouse owners and renters - Asian residents 674 45.9% Owner occupied793 54.1% Renter occupiedHouse owners and renters - Native Hawaiian / Pacific Islander residents 28 63.8% Owner occupied16 36.2% Renter occupiedHouse owners and renters - Other race residents 186 21.8% Owner occupied668 78.2% Renter occupiedHouse owners and renters - Two or more races residents 834 51.6% Owner occupied782 48.4% Renter occupiedHouse owners and renters - White alone residents 2,114 59.2% Owner occupied1,457 40.8% Renter occupiedHouse owners and renters - Hispanic or Latino residents 732 33.5% Owner occupied1,449 66.5% Renter occupied
Language usage in Lomita
English speakers - Total 65.5% of residents of Lomita speak English at home.
20.1% of residents speak Spanish at home 2,909 76.0% Speak English very well919 24.0% Speak English less than very well14.7% of residents speak other language at home 1,572 56.0% Speak English very well1,233 44.0% Speak English less than very well
English speakers - Born in the United States 89.0% of residents of Lomita speak English at home.
5.8% of residents speak Spanish at home 144 77.0% Speak English very well43 23.0% Speak English less than very well5.3% of residents speak other language at home 125 72.7% Speak English very well47 27.3% Speak English less than very well
English speakers - Native, born elsewhere 60.5% of residents of Lomita speak English at home.
30.0% of residents speak Spanish at home 99 98.0% Speak English very well2 2.0% Speak English less than very well9.8% of residents speak other language at home 20 60.6% Speak English very well13 39.4% Speak English less than very well
English speakers - Foreign-born 14.5% of residents of Lomita speak English at home.
34.9% of residents speak Spanish at home 680 48.6% Speak English very well720 51.4% Speak English less than very well51.5% of residents speak other language at home 949 45.9% Speak English very well1,118 54.1% Speak English less than very well
White (Caucasian) - Speak only English Native:
90.6% (7,359)Foreign-born:
24.6% (221)
White (Caucasian) - Speak another language Native:
10.3% (840)Foreign-born:
77.0% (692)
Black or African American - Speak only English Native:
91.9% (1,036)Foreign-born:
87.5% (42)
American Indian / Alaska Native - Speak another language Native:
36.6% (57)Foreign-born:
99.6% (97)
Asian - Speak only English Native:
74.5% (1,192)Foreign-born:
13.5% (240)
Asian - Speak another language Native:
26.7% (426)Foreign-born:
86.8% (1,540)
Other race - Speak only English Native:
29.1% (555)Foreign-born:
1.6% (13)
Other race - Speak another language Native:
70.6% (1,345)Foreign-born:
97.3% (764)
Two or more races - Speak only English Native:
67.6% (1,890)Foreign-born:
9.3% (40)
Two or more races - Speak another language Native:
25.6% (715)Foreign-born:
90.8% (394)
White alone - Speak only English Native:
95.3% (6,123)Foreign-born:
33.4% (213)
White alone - Speak another language Native:
4.6% (297)Foreign-born:
66.1% (421)
Hispanic or Latino - Speak only English Native:
53.6% (2,703)Foreign-born:
3.2% (46)
Hispanic or Latino - Speak another language Native:
47.6% (2,399)Foreign-born:
96.2% (1,363)
Foreign-born residents in Lomita 4,184 residents are foreign born (9.5% Asia , 7.6% Latin America ).
This city:
20.4%California:
100.0%
Marital status for residents in Lomita Marital status - White (Caucasian) population 15 years and over
Males 28.4% Never married49.5% Now married0.7% Separated3.4% Widowed18.0% DivorcedFemales 28.1% Never married47.6% Now married1.3% Separated7.0% Widowed16.1% DivorcedWomen who gave birth in the past 12 months Now married:
77.0% (175)Unmarried:
23.0% (52)
Women who did not give birth in the past 12 months Now married:
46.0% (733)Unmarried:
54.0% (860)
Marital status - Black or African American population 15 years and over
Males 68.9% Never married21.9% Now married3.1% Separated0.3% Widowed5.8% DivorcedFemales 55.2% Never married11.6% Now married2.6% Separated4.3% Widowed26.3% DivorcedWomen who did not give birth in the past 12 months Now married:
17.6% (55)Unmarried:
82.4% (255)
Marital status - American Indian / Alaska Native population 15 years and over
Males 42.9% Never married57.1% Now married0.0% Separated0.0% Widowed0.0% DivorcedFemales 78.0% Never married22.0% Now married0.0% Separated0.0% Widowed0.0% DivorcedWomen who did not give birth in the past 12 months Now married:
0.0% (0)Unmarried:
100.0% (144)
Marital status - Asian population 15 years and over
Males 17.2% Never married60.8% Now married1.6% Separated5.4% Widowed15.0% DivorcedFemales 24.3% Never married52.2% Now married3.4% Separated10.6% Widowed9.5% DivorcedWomen who gave birth in the past 12 months Now married:
100.0% (29)Unmarried:
0.0% (0)
Women who did not give birth in the past 12 months Now married:
53.6% (443)Unmarried:
46.4% (383)
Marital status - Native Hawaiian / Pacific Islander population 15 years and over
Males 0.0% Never married100.0% Now married0.0% Separated0.0% Widowed0.0% DivorcedFemales 63.6% Never married36.4% Now married0.0% Separated0.0% Widowed0.0% DivorcedWomen who did not give birth in the past 12 months Now married:
0.0% (0)Unmarried:
100.0% (34)
Marital status - Other race population 15 years and over
Males 32.3% Never married59.8% Now married0.0% Separated1.7% Widowed6.2% DivorcedFemales 39.9% Never married35.2% Now married5.7% Separated0.2% Widowed19.1% DivorcedWomen who gave birth in the past 12 months Now married:
100.0% (82)Unmarried:
0.0% (0)
Women who did not give birth in the past 12 months Now married:
39.9% (408)Unmarried:
60.1% (614)
Marital status - Two or more races population 15 years and over
Males 59.7% Never married20.9% Now married3.1% Separated2.9% Widowed13.5% DivorcedFemales 22.4% Never married54.4% Now married0.0% Separated3.8% Widowed19.4% DivorcedWomen who gave birth in the past 12 months Now married:
100.0% (53)Unmarried:
0.0% (0)
Women who did not give birth in the past 12 months Now married:
62.2% (368)Unmarried:
37.8% (224)
Marital status - White alone, not Hispanic / Latino population 15 years and over
Males 23.8% Never married51.7% Now married0.8% Separated4.0% Widowed19.7% DivorcedFemales 18.9% Never married53.4% Now married0.8% Separated8.7% Widowed18.3% DivorcedWomen who gave birth in the past 12 months Now married:
89.7% (197)Unmarried:
10.3% (23)
Women who did not give birth in the past 12 months Now married:
57.5% (527)Unmarried:
42.5% (390)
Marital status - Hispanic or Latino population 15 years and over
Males 41.3% Never married47.9% Now married0.1% Separated2.0% Widowed8.7% DivorcedFemales 43.8% Never married37.6% Now married3.9% Separated2.1% Widowed12.5% DivorcedWomen who gave birth in the past 12 months Now married:
66.4% (83)Unmarried:
33.6% (42)
Women who did not give birth in the past 12 months Now married:
39.2% (830)Unmarried:
60.8% (1,286)
Ancestries in Lomita
414 3.4% American329 2.7% English316 2.6% Irish267 2.2% German260 2.1% Italian202 1.7% European123 1.0% Scottish115 0.9% Czech103 0.9% Polish99 0.8% Syrian92 0.8% Palestinian91 0.8% Norwegian82 0.7% French60 0.5% Scandinavian52 0.4% Russian35 0.3% African35 0.3% Welsh35 0.3% Belizean34 0.3% Croatian28 0.2% Scotch-Irish27 0.2% British26 0.2% Moroccan23 0.2% Northern European20 0.2% Swedish19 0.2% South African17 0.1% Lebanese16 0.1% Canadian16 0.1% Swiss14 0.1% Czechoslovakian13 0.1% Turkish13 0.1% Romanian12 0.10% Haitian11 0.09% Hungarian11 0.09% Finnish11 0.09% Serbian11 0.09% Danish8 0.07% Slovak7 0.06% Dutch7 0.06% Yugoslavian4 0.03% Lithuanian1 0.01% Iranian
Geographical mobility in Lomita Same house 1 year ago 8,431 91.0% White (Caucasian)1,173 95.1% Black or African American93 37.7% American Indian / Alaska Native3,264 94.5% Asian70 100.0% Native Hawaiian / Pacific Islander2,773 100.0% Other race3,370 83.6% Two or more races6,737 89.8% White alone, not Hispanic / Latino6,253 93.0% Hispanic or LatinoMoved within same county 705 7.6% White / Caucasian64 5.2% Black or African American112 45.2% American Indian / Alaska Native126 3.7% Asian11 0.4% Other race547 13.6% Two or more races677 9.0% White alone, not Hispanic / Latino418 6.2% Hispanic or LatinoMoved within same state 29 0.3% White / Caucasian14 0.4% Asian9 0.1% White alone, not Hispanic / Latino29 0.4% Hispanic or LatinoMoved from different state 56 0.6% White / Caucasian21 0.6% Asian12 0.3% Two or more races52 0.7% White alone, not Hispanic / Latino8 0.1% Hispanic or LatinoMoved from abroad 27 0.3% White45 1.3% Asian20 0.5% Two or more races20 0.3% White alone, not Hispanic / Latino26 0.4% Hispanic or Latino
Children Nativity (place of birth) in Lomita
Children under 6 years - Living with two parents Both parents native 938 100.0% Native0 0.0% Foreign-bornBoth parents foreign-born 233 87.8% Native32 12.2% Foreign-bornOne native, one foreign-born parent 103 100.0% NativeChildren under 6 years - Living with one parent Native parent 283 93.0% Native21 7.0% Foreign-bornChildren 6 to 17 years - Living with two parents Both parents native 833 99.1% Native7 0.9% Foreign-bornBoth parents foreign-born 331 96.6% Native12 3.4% Foreign-bornOne native, one foreign-born parent 253 100.0% NativeChildren 6 to 17 years - Living with one parent Native parent 730 100.0% NativeForeign-born parent 169 51.9% Native157 48.1% Foreign-born
Grandparents responsible for own grandchildren in Lomita
Grandparents (30 to 59 years) White / Caucasian 29 67.8% Responsible for grandchildren14 32.2% Not responsible for grandchildrenBlack or African American 23 100.0% Not responsible for grandchildrenOther race 41 66.4% Responsible for grandchildren21 33.6% Not responsible for grandchildrenTwo or more races 60 100.0% Responsible for grandchildrenWhite alone, not Hispanic / Latino 32 70.7% Responsible for grandchildren13 29.3% Not responsible for grandchildrenHispanic or Latino 33 62.9% Responsible for grandchildren19 37.1% Not responsible for grandchildrenGrandparents (60 years and over) White / Caucasian 31 30.8% Responsible for grandchildren70 69.2% Not responsible for grandchildrenWhite alone, not Hispanic / Latino 38 37.4% Responsible for grandchildren64 62.6% Not responsible for grandchildrenHispanic or Latino 31 100.0% Not responsible for grandchildren