Races in Loudoun Valley Estates, Virginia (VA) Detailed Stats
Data:
Races - White alone (%)
Races - White alone (% change since 2000)
Races - Black alone (%)
Races - Black alone (% change since 2000)
Races - American Indian alone (%)
Races - American Indian alone (% change since 2000)
Races - Asian alone (%)
Races - Asian alone (% change since 2000)
Races - Hispanic (%)
Races - Hispanic (% change since 2000)
Races - Native Hawaiian and Other Pacific Islander alone (%)
Races - Native Hawaiian and Other Pacific Islander alone (% change since 2000)
Races - Two or more races(%)
Races - Two or more races(% change since 2000)
Races - Other race alone (%)
Races - Other race alone (% change since 2000)
Racial diversity
Place of birth - Born in state of residence (%)
Place of birth - Born in state of residence (%) - White
Place of birth - Born in state of residence (%) - Black or African American
Place of birth - Born in state of residence (%) - Asian
Place of birth - Born in state of residence (%) - Hispanic or Latino
Place of birth - Born in state of residence (%) - American Indian and Alaska Native
Place of birth - Born in state of residence (%) - Multirace
Place of birth - Born in state of residence (%) - Other Race
Place of birth - Born in other state (%)
Place of birth - Born in other state (%) - White
Place of birth - Born in other state (%) - Black or African American
Place of birth - Born in other state (%) - Asian
Place of birth - Born in other state (%) - Hispanic or Latino
Place of birth - Born in other state (%) - American Indian and Alaska Native
Place of birth - Born in other state (%) - Multirace
Place of birth - Born in other state (%) - Other Race
Place of birth - Native, outside of US (%)
Place of birth - Native, outside of US (%) - White
Place of birth - Native, outside of US (%) - Black or African American
Place of birth - Native, outside of US (%) - Asian
Place of birth - Native, outside of US (%) - Hispanic or Latino
Place of birth - Native, outside of US (%) - American Indian and Alaska Native
Place of birth - Native, outside of US (%) - Multirace
Place of birth - Native, outside of US (%) - Other Race
Place of birth - Foreign born (%)
Place of birth - Foreign born (%) - White
Place of birth - Foreign born (%) - Black or African American
Place of birth - Foreign born (%) - Asian
Place of birth - Foreign born (%) - Hispanic or Latino
Place of birth - Foreign born (%) - American Indian and Alaska Native
Place of birth - Foreign born (%) - Multirace
Place of birth - Foreign born (%) - Other Race
Residents speaking English at home (%)
Residents speaking English at home - Born in the United States (%)
Residents speaking English at home - Native, born elsewhere (%)
Residents speaking English at home - Foreign born (%)
Residents speaking Spanish at home (%)
Residents speaking Spanish at home - Born in the United States (%)
Residents speaking Spanish at home - Native, born elsewhere (%)
Residents speaking Spanish at home - Foreign born (%)
Residents speaking other language at home (%)
Residents speaking other language at home - Born in the United States (%)
Residents speaking other language at home - Native, born elsewhere (%)
Residents speaking other language at home - Foreign born (%)
Marital status - Never married (%)
Marital status - Now married (%)
Marital status - Separated (%)
Marital status - Widowed (%)
Marital status - Divorced (%)
Ancestries Reported - Arab (%)
Ancestries Reported - Czech (%)
Ancestries Reported - Danish (%)
Ancestries Reported - Dutch (%)
Ancestries Reported - English (%)
Ancestries Reported - French (%)
Ancestries Reported - French Canadian (%)
Ancestries Reported - German (%)
Ancestries Reported - Greek (%)
Ancestries Reported - Hungarian (%)
Ancestries Reported - Irish (%)
Ancestries Reported - Italian (%)
Ancestries Reported - Lithuanian (%)
Ancestries Reported - Norwegian (%)
Ancestries Reported - Polish (%)
Ancestries Reported - Portuguese (%)
Ancestries Reported - Russian (%)
Ancestries Reported - Scotch-Irish (%)
Ancestries Reported - Scottish (%)
Ancestries Reported - Slovak (%)
Ancestries Reported - Subsaharan African (%)
Ancestries Reported - Swedish (%)
Ancestries Reported - Swiss (%)
Ancestries Reported - Ukrainian (%)
Ancestries Reported - United States (%)
Ancestries Reported - Welsh (%)
Ancestries Reported - West Indian (%)
Ancestries Reported - Other (%)
Geographical mobility - Same house 1 year ago (%)
Geographical mobility - Same house 1 year ago (%) - White
Geographical mobility - Same house 1 year ago (%) - Black or African American
Geographical mobility - Same house 1 year ago (%) - Asian
Geographical mobility - Same house 1 year ago (%) - Hispanic or Latino
Geographical mobility - Same house 1 year ago (%) - American Indian and Alaska Native
Geographical mobility - Same house 1 year ago (%) - Multirace
Geographical mobility - Same house 1 year ago (%) - Other Race
Geographical mobility - Moved within same county (%)
Geographical mobility - Moved within same county (%) - White
Geographical mobility - Moved within same county (%) - Black or African American
Geographical mobility - Moved within same county (%) - Asian
Geographical mobility - Moved within same county (%) - Hispanic or Latino
Geographical mobility - Moved within same county (%) - American Indian and Alaska Native
Geographical mobility - Moved within same county (%) - Multirace
Geographical mobility - Moved within same county (%) - Other Race
Geographical mobility - Moved from different county within same state (%)
Geographical mobility - Moved from different county within same state (%) - White
Geographical mobility - Moved from different county within same state (%) - Black or African American
Geographical mobility - Moved from different county within same state (%) - Asian
Geographical mobility - Moved from different county within same state (%) - Hispanic or Latino
Geographical mobility - Moved from different county within same state (%) - American Indian and Alaska Native
Geographical mobility - Moved from different county within same state (%) - Multirace
Geographical mobility - Moved from different county within same state (%) - Other Race
Geographical mobility - Moved from different state (%)
Geographical mobility - Moved from different state (%) - White
Geographical mobility - Moved from different state (%) - Black or African American
Geographical mobility - Moved from different state (%) - Asian
Geographical mobility - Moved from different state (%) - Hispanic or Latino
Geographical mobility - Moved from different state (%) - American Indian and Alaska Native
Geographical mobility - Moved from different state (%) - Multirace
Geographical mobility - Moved from different state (%) - Other Race
Geographical mobility - Moved from abroad (%)
Geographical mobility - Moved from abroad (%) - White
Geographical mobility - Moved from abroad (%) - Black or African American
Geographical mobility - Moved from abroad (%) - Asian
Geographical mobility - Moved from abroad (%) - Hispanic or Latino
Geographical mobility - Moved from abroad (%) - American Indian and Alaska Native
Geographical mobility - Moved from abroad (%) - Multirace
Geographical mobility - Moved from abroad (%) - Other Race
Place of birth for the foreign-born population - Ireland (%)
Place of birth for the foreign-born population - Denmark (%)
Place of birth for the foreign-born population - Norway (%)
Place of birth for the foreign-born population - Sweden (%)
Place of birth for the foreign-born population - United Kingdom (%)
Place of birth for the foreign-born population - England (%)
Place of birth for the foreign-born population - Scotland (%)
Place of birth for the foreign-born population - Other Northern Europe (%)
Place of birth for the foreign-born population - Austria (%)
Place of birth for the foreign-born population - Belgium (%)
Place of birth for the foreign-born population - France (%)
Place of birth for the foreign-born population - Germany (%)
Place of birth for the foreign-born population - Netherlands (%)
Place of birth for the foreign-born population - Switzerland (%)
Place of birth for the foreign-born population - Other Western Europe (%)
Place of birth for the foreign-born population - Greece (%)
Place of birth for the foreign-born population - Italy (%)
Place of birth for the foreign-born population - Portugal (%)
Place of birth for the foreign-born population - Spain (%)
Place of birth for the foreign-born population - Other Southern Europe (%)
Place of birth for the foreign-born population - Albania (%)
Place of birth for the foreign-born population - Belarus (%)
Place of birth for the foreign-born population - Bosnia and Herzegovina (%)
Place of birth for the foreign-born population - Bulgaria (%)
Place of birth for the foreign-born population - Croatia (%)
Place of birth for the foreign-born population - Czechoslovakia (%)
Place of birth for the foreign-born population - Hungary (%)
Place of birth for the foreign-born population - Latvia (%)
Place of birth for the foreign-born population - Lithuania (%)
Place of birth for the foreign-born population - North Macedonia (Macedonia) (%)
Place of birth for the foreign-born population - Moldova (%)
Place of birth for the foreign-born population - Poland (%)
Place of birth for the foreign-born population - Romania (%)
Place of birth for the foreign-born population - Russia (%)
Place of birth for the foreign-born population - Serbia (%)
Place of birth for the foreign-born population - Ukraine (%)
Place of birth for the foreign-born population - Other Eastern Europe (%)
Place of birth for the foreign-born population - China (%)
Place of birth for the foreign-born population - Hong Kong (%)
Place of birth for the foreign-born population - Taiwan (%)
Place of birth for the foreign-born population - Japan (%)
Place of birth for the foreign-born population - Korea (%)
Place of birth for the foreign-born population - Other Eastern Asia (%)
Place of birth for the foreign-born population - Afghanistan (%)
Place of birth for the foreign-born population - Bangladesh (%)
Place of birth for the foreign-born population - India (%)
Place of birth for the foreign-born population - Iran (%)
Place of birth for the foreign-born population - Kazakhstan (%)
Place of birth for the foreign-born population - Nepal (%)
Place of birth for the foreign-born population - Pakistan (%)
Place of birth for the foreign-born population - Sri Lanka (%)
Place of birth for the foreign-born population - Uzbekistan (%)
Place of birth for the foreign-born population - Other South Central Asia (%)
Place of birth for the foreign-born population - Burma (%)
Place of birth for the foreign-born population - Cambodia (%)
Place of birth for the foreign-born population - Indonesia (%)
Place of birth for the foreign-born population - Laos (%)
Place of birth for the foreign-born population - Malaysia (%)
Place of birth for the foreign-born population - Philippines (%)
Place of birth for the foreign-born population - Singapore (%)
Place of birth for the foreign-born population - Thailand (%)
Place of birth for the foreign-born population - Vietnam (%)
Place of birth for the foreign-born population - Other South Eastern Asia (%)
Place of birth for the foreign-born population - Armenia (%)
Place of birth for the foreign-born population - Iraq (%)
Place of birth for the foreign-born population - Israel (%)
Place of birth for the foreign-born population - Jordan (%)
Place of birth for the foreign-born population - Kuwait (%)
Place of birth for the foreign-born population - Lebanon (%)
Place of birth for the foreign-born population - Saudi Arabia (%)
Place of birth for the foreign-born population - Syria (%)
Place of birth for the foreign-born population - Turkey (%)
Place of birth for the foreign-born population - Yemen (%)
Place of birth for the foreign-born population - Other Western Asia (%)
Place of birth for the foreign-born population - Eritrea (%)
Place of birth for the foreign-born population - Ethiopia (%)
Place of birth for the foreign-born population - Kenya (%)
Place of birth for the foreign-born population - Somalia (%)
Place of birth for the foreign-born population - Uganda (%)
Place of birth for the foreign-born population - Zimbabwe (%)
Place of birth for the foreign-born population - Other Eastern Africa (%)
Place of birth for the foreign-born population - Cameroon (%)
Place of birth for the foreign-born population - Congo (%)
Place of birth for the foreign-born population - Democratic Republic of Congo (Zaire) (%)
Place of birth for the foreign-born population - Other Middle Africa (%)
Place of birth for the foreign-born population - Egypt (%)
Place of birth for the foreign-born population - Morocco (%)
Place of birth for the foreign-born population - Sudan (%)
Place of birth for the foreign-born population - Other Northern Africa (%)
Place of birth for the foreign-born population - South Africa (%)
Place of birth for the foreign-born population - Other Southern Africa (%)
Place of birth for the foreign-born population - Cabo Verde (%)
Place of birth for the foreign-born population - Ghana (%)
Place of birth for the foreign-born population - Liberia (%)
Place of birth for the foreign-born population - Nigeria (%)
Place of birth for the foreign-born population - Senegal (%)
Place of birth for the foreign-born population - Sierra Leone (%)
Place of birth for the foreign-born population - Other Western Africa (%)
Place of birth for the foreign-born population - Australia (%)
Place of birth for the foreign-born population - New Zealand (%)
Place of birth for the foreign-born population - Fiji (%)
Place of birth for the foreign-born population - Micronesia (%)
Place of birth for the foreign-born population - Bahamas (%)
Place of birth for the foreign-born population - Barbados (%)
Place of birth for the foreign-born population - Cuba (%)
Place of birth for the foreign-born population - Dominica (%)
Place of birth for the foreign-born population - Dominican Republic (%)
Place of birth for the foreign-born population - Grenada (%)
Place of birth for the foreign-born population - Haiti (%)
Place of birth for the foreign-born population - Jamaica (%)
Place of birth for the foreign-born population - St. Vincent and the Grenadines (%)
Place of birth for the foreign-born population - Trinidad and Tobago (%)
Place of birth for the foreign-born population - West Indies (%)
Place of birth for the foreign-born population - Other Caribbean (%)
Place of birth for the foreign-born population - Belize (%)
Place of birth for the foreign-born population - Costa Rica (%)
Place of birth for the foreign-born population - El Salvador (%)
Place of birth for the foreign-born population - Guatemala (%)
Place of birth for the foreign-born population - Honduras (%)
Place of birth for the foreign-born population - Mexico (%)
Place of birth for the foreign-born population - Nicaragua (%)
Place of birth for the foreign-born population - Panama (%)
Place of birth for the foreign-born population - Other Central America (%)
Place of birth for the foreign-born population - Argentina (%)
Place of birth for the foreign-born population - Bolivia (%)
Place of birth for the foreign-born population - Brazil (%)
Place of birth for the foreign-born population - Chile (%)
Place of birth for the foreign-born population - Colombia (%)
Place of birth for the foreign-born population - Ecuador (%)
Place of birth for the foreign-born population - Guyana (%)
Place of birth for the foreign-born population - Peru (%)
Place of birth for the foreign-born population - Uruguay (%)
Place of birth for the foreign-born population - Venezuela (%)
Place of birth for the foreign-born population - Other South America (%)
Place of birth for the foreign-born population - Canada (%)
Place of birth for the foreign-born population - Other Northern America (%)
Place of birth for the foreign-born population - Other (%)
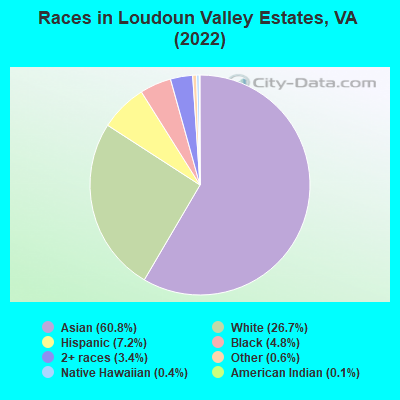
According to 2022 data, the most numerous races in Loudoun Valley Estates, VA are White alone (2,883 residents), Black alone (513 residents), and Hispanic (772 residents). 44.0% of Loudoun Valley Estates residents speak English at home.
Race distribution in Loudoun Valley Estates 6,559 60.8% Asian alone 2,883 26.7% White alone 772 7.2% Hispanic 513 4.8% Black alone 365 3.4% Two or more races 68 0.6% Other race alone 38 0.4% Native Hawaiian and Other 14 0.1% American Indian alone
2000 2022
4,965,637 70.2% White alone 1,376,378 19.4% Black alone 329,540 4.7% Hispanic 259,277 3.7% Asian alone 114,022 1.6% Two or more races 18,596 0.3% American Indian alone 11,685 0.2% Other race alone 3,380 0.05% Native Hawaiian and Other
5,095,130 58.7% White alone 1,594,785 18.4% Black alone 905,750 10.4% Hispanic 602,881 6.9% Asian alone 406,047 4.7% Two or more races 60,419 0.7% Other race alone 11,738 0.1% American Indian alone 6,869 0.08% Native Hawaiian and Other
Income and house value in Loudoun Valley Estates Median household income in 2022 over $200,000 White non-Hispanic householders$154,768 Black householdersover $200,000 Asian householdersover $200,000 Native Hawaiian and other Pacific Islander householders$188,873 Some other race householdersover $200,000 Two or more races householdersover $200,000 Hispanic or Latino race householders
Median age by race in Loudoun Valley Estates
38.3 Median age for White residents43.2 32.0 50.0 Median age for Black or African American residents43.6 51.1 -792,063,491.3 Median age for American Indian / Alaska Native residents-862,921,347.5 -673,154,906.1 38.2 Median age for Asian residents40.3 37.4 79.5 Median age for Native Hawaiian / Pacific Islander residents35.3 50.8 34.2 Median age for Other race residents46.0 29.2 34.7 Median age for Two or more races residents33.9 36.4 37.8 Median age for White alone residents41.2 31.8 42.1 Median age for Hispanic or Latino residents42.3 39.0
Owner/renter occupied households by race in Loudoun Valley Estates
House owners and renters - White residents 905 87.9% Owner occupied124 12.1% Renter occupiedHouse owners and renters - Black or African American residents 92 40.3% Owner occupied136 59.7% Renter occupiedHouse owners and renters - American Indian / Alaska Native residents 23 100.0% Owner occupiedHouse owners and renters - Asian residents 2,124 100.0% Owner occupiedHouse owners and renters - Native Hawaiian / Pacific Islander residents 23 100.0% Owner occupiedHouse owners and renters - Other race residents 136 100.0% Owner occupiedHouse owners and renters - Two or more races residents 275 90.4% Owner occupied29 9.6% Renter occupiedHouse owners and renters - White alone residents 855 87.0% Owner occupied128 13.0% Renter occupiedHouse owners and renters - Hispanic or Latino residents 299 92.8% Owner occupied23 7.2% Renter occupied
Language usage in Loudoun Valley Estates
English speakers - Total 44.0% of residents of Loudoun Valley Estates speak English at home.
6.3% of residents speak Spanish at home 524 80.9% Speak English very well124 19.1% Speak English less than very well53.3% of residents speak other language at home 4,559 83.5% Speak English very well900 16.5% Speak English less than very well
English speakers - Born in the United States 89.1% of residents of Loudoun Valley Estates speak English at home.
2.0% of residents speak Spanish at home 50 100.0% Speak English very well9.7% of residents speak other language at home 242 100.0% Speak English very well
English speakers - Native, born elsewhere 9.4% of residents of Loudoun Valley Estates speak English at home.
51.6% of residents speak Spanish at home 66 100.0% Speak English very well75.8% of residents speak other language at home 97 100.0% Speak English very well
English speakers - Foreign-born 7.6% of residents of Loudoun Valley Estates speak English at home.
8.0% of residents speak Spanish at home 281 69.4% Speak English very well124 30.6% Speak English less than very well86.1% of residents speak other language at home 3,529 80.7% Speak English very well843 19.3% Speak English less than very well
White (Caucasian) - Speak only English Native:
90.3% (2,227)Foreign-born:
15.8% (51)
White (Caucasian) - Speak another language Native:
9.7% (240)Foreign-born:
84.8% (274)
Asian - Speak only English Native:
55.7% (1,028)Foreign-born:
8.3% (359)
Asian - Speak another language Native:
43.4% (802)Foreign-born:
91.6% (3,936)
Native Hawaiian / Pacific Islander - Speak another language Native:
100.0% (30)Foreign-born:
49.7% (21)
Other race - Speak another language Native:
51.3% (85)Foreign-born:
100.0% (286)
Two or more races - Speak only English Native:
76.1% (405)Foreign-born:
11.6% (19)
Two or more races - Speak another language Native:
20.9% (111)Foreign-born:
88.7% (145)
White alone - Speak only English Native:
90.4% (2,227)Foreign-born:
16.7% (51)
White alone - Speak another language Native:
10.9% (268)Foreign-born:
85.4% (263)
Hispanic or Latino - Speak another language Native:
41.8% (129)Foreign-born:
99.2% (385)
Foreign-born residents in Loudoun Valley Estates
Marital status for residents in Loudoun Valley Estates Marital status - White (Caucasian) population 15 years and over
Males 24.6% Never married68.1% Now married0.0% Separated0.0% Widowed7.3% DivorcedFemales 34.7% Never married61.6% Now married0.0% Separated1.8% Widowed1.9% DivorcedWomen who gave birth in the past 12 months Now married:
100.0% (29)Unmarried:
0.0% (0)
Women who did not give birth in the past 12 months Now married:
47.1% (354)Unmarried:
52.9% (398)
Marital status - Black or African American population 15 years and over
Males 39.7% Never married55.1% Now married0.0% Separated0.0% Widowed5.1% DivorcedFemales 19.1% Never married67.6% Now married0.0% Separated0.0% Widowed13.2% DivorcedWomen who did not give birth in the past 12 months Now married:
59.0% (45)Unmarried:
41.0% (32)
Marital status - American Indian / Alaska Native population 15 years and over
Males 0.0% Never married100.0% Now married0.0% Separated0.0% Widowed0.0% DivorcedFemales 0.0% Never married0.0% Now married0.0% Separated0.0% Widowed100.0% DivorcedWomen who did not give birth in the past 12 months Now married:
0.0% (0)Unmarried:
100.0% (11)
Marital status - Asian population 15 years and over
Males 16.0% Never married80.7% Now married0.5% Separated1.0% Widowed1.9% DivorcedFemales 14.3% Never married79.2% Now married6.1% Separated0.0% Widowed0.3% DivorcedWomen who gave birth in the past 12 months Now married:
100.0% (173)Unmarried:
0.0% (0)
Women who did not give birth in the past 12 months Now married:
80.6% (1,431)Unmarried:
19.4% (345)
Marital status - Native Hawaiian / Pacific Islander population 15 years and over
Males 0.0% Never married66.7% Now married0.0% Separated0.0% Widowed33.3% DivorcedFemales 0.0% Never married75.9% Now married0.0% Separated0.0% Widowed24.1% DivorcedWomen who did not give birth in the past 12 months Now married:
63.2% (13)Unmarried:
36.8% (7)
Marital status - Other race population 15 years and over
Males 43.4% Never married56.6% Now married0.0% Separated0.0% Widowed0.0% DivorcedFemales 8.8% Never married59.6% Now married0.0% Separated0.0% Widowed31.6% DivorcedWomen who did not give birth in the past 12 months Now married:
59.4% (51)Unmarried:
40.6% (35)
Marital status - Two or more races population 15 years and over
Males 34.2% Never married20.6% Now married8.5% Separated0.0% Widowed36.7% DivorcedFemales 51.9% Never married30.3% Now married0.0% Separated0.0% Widowed17.8% DivorcedWomen who did not give birth in the past 12 months Now married:
36.9% (93)Unmarried:
63.1% (160)
Marital status - White alone, not Hispanic / Latino population 15 years and over
Males 26.2% Never married66.0% Now married0.0% Separated0.0% Widowed7.8% DivorcedFemales 36.4% Never married60.3% Now married0.0% Separated1.4% Widowed2.0% DivorcedWomen who did not give birth in the past 12 months Now married:
45.9% (355)Unmarried:
54.1% (419)
Marital status - Hispanic or Latino population 15 years and over
Males 20.2% Never married56.4% Now married0.0% Separated0.0% Widowed23.4% DivorcedFemales 14.2% Never married69.6% Now married0.0% Separated2.3% Widowed13.8% DivorcedWomen who gave birth in the past 12 months Now married:
100.0% (33)Unmarried:
0.0% (0)
Women who did not give birth in the past 12 months Now married:
68.9% (125)Unmarried:
31.1% (56)
Ancestries in Loudoun Valley Estates
370 4.9% American216 2.8% English116 1.5% Italian100 1.3% Portuguese79 1.0% Jordanian62 0.8% Polish55 0.7% German50 0.7% Iranian42 0.6% Egyptian40 0.5% Nigerian39 0.5% Irish34 0.4% Hungarian32 0.4% Turkish29 0.4% Scottish28 0.4% African24 0.3% European20 0.3% Ukrainian18 0.2% Scandinavian17 0.2% British12 0.2% Russian10 0.1% Austrian10 0.1% Swiss9 0.1% Eastern European9 0.1% Scotch-Irish2 0.03% Jamaican
Children Nativity (place of birth) in Loudoun Valley Estates
Children under 6 years - Living with two parents Both parents foreign-born 482 100.0% NativeOne native, one foreign-born parent 136 100.0% NativeChildren under 6 years - Living with one parent Foreign-born parent 23 100.0% NativeChildren 6 to 17 years - Living with two parents Both parents native 437 100.0% NativeBoth parents foreign-born 1,405 96.5% Native51 3.5% Foreign-bornOne native, one foreign-born parent 187 100.0% NativeChildren 6 to 17 years - Living with one parent Native parent 189 100.0% NativeForeign-born parent 9 48.3% Native10 51.7% Foreign-born
Grandparents responsible for own grandchildren in Loudoun Valley Estates
Grandparents (30 to 59 years) White / Caucasian 10 100.0% Responsible for grandchildrenWhite alone, not Hispanic / Latino 11 100.0% Responsible for grandchildren
Grandparents (60 years and over) White / Caucasian 15 100.0% Responsible for grandchildrenWhite alone, not Hispanic / Latino 15 100.0% Responsible for grandchildren