Races in Madison Heights, Michigan (MI) Detailed Stats
Data:
Races - White alone (%)
Races - White alone (% change since 2000)
Races - Black alone (%)
Races - Black alone (% change since 2000)
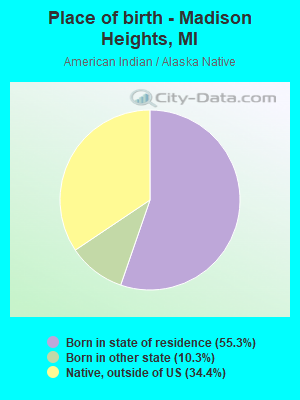
Races - American Indian alone (%)
Races - American Indian alone (% change since 2000)
Races - Asian alone (%)
Races - Asian alone (% change since 2000)
Races - Hispanic (%)
Races - Hispanic (% change since 2000)
Races - Native Hawaiian and Other Pacific Islander alone (%)
Races - Native Hawaiian and Other Pacific Islander alone (% change since 2000)
Races - Two or more races(%)
Races - Two or more races(% change since 2000)
Races - Other race alone (%)
Races - Other race alone (% change since 2000)
Racial diversity
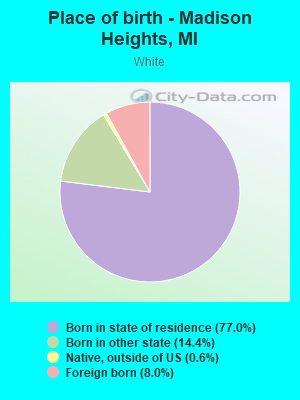
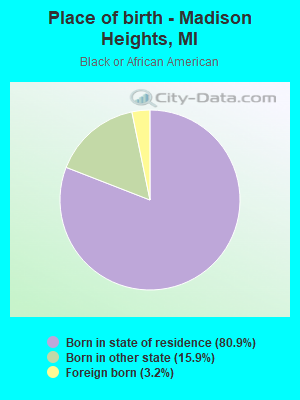
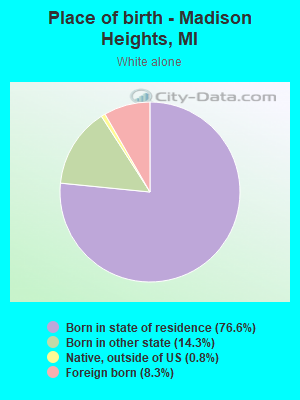
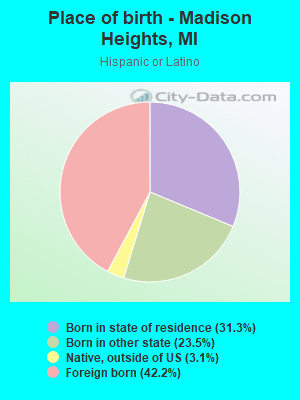
Place of birth - Born in state of residence (%)
Place of birth - Born in state of residence (%) - White
Place of birth - Born in state of residence (%) - Black or African American
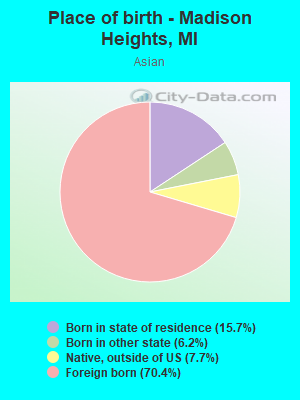
Place of birth - Born in state of residence (%) - Asian
Place of birth - Born in state of residence (%) - Hispanic or Latino
Place of birth - Born in state of residence (%) - American Indian and Alaska Native
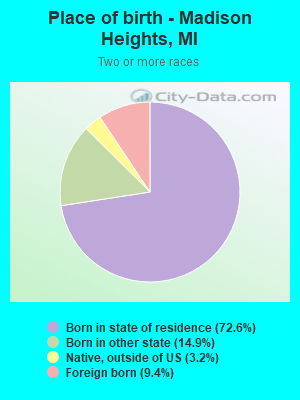
Place of birth - Born in state of residence (%) - Multirace
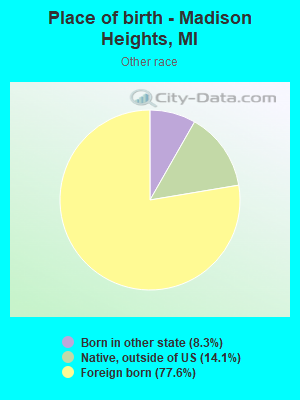
Place of birth - Born in state of residence (%) - Other Race
Place of birth - Born in other state (%)
Place of birth - Born in other state (%) - White
Place of birth - Born in other state (%) - Black or African American
Place of birth - Born in other state (%) - Asian
Place of birth - Born in other state (%) - Hispanic or Latino
Place of birth - Born in other state (%) - American Indian and Alaska Native
Place of birth - Born in other state (%) - Multirace
Place of birth - Born in other state (%) - Other Race
Place of birth - Native, outside of US (%)
Place of birth - Native, outside of US (%) - White
Place of birth - Native, outside of US (%) - Black or African American
Place of birth - Native, outside of US (%) - Asian
Place of birth - Native, outside of US (%) - Hispanic or Latino
Place of birth - Native, outside of US (%) - American Indian and Alaska Native
Place of birth - Native, outside of US (%) - Multirace
Place of birth - Native, outside of US (%) - Other Race
Place of birth - Foreign born (%)
Place of birth - Foreign born (%) - White
Place of birth - Foreign born (%) - Black or African American
Place of birth - Foreign born (%) - Asian
Place of birth - Foreign born (%) - Hispanic or Latino
Place of birth - Foreign born (%) - American Indian and Alaska Native
Place of birth - Foreign born (%) - Multirace
Place of birth - Foreign born (%) - Other Race
Residents speaking English at home (%)
Residents speaking English at home - Born in the United States (%)
Residents speaking English at home - Native, born elsewhere (%)
Residents speaking English at home - Foreign born (%)
Residents speaking Spanish at home (%)
Residents speaking Spanish at home - Born in the United States (%)
Residents speaking Spanish at home - Native, born elsewhere (%)
Residents speaking Spanish at home - Foreign born (%)
Residents speaking other language at home (%)
Residents speaking other language at home - Born in the United States (%)
Residents speaking other language at home - Native, born elsewhere (%)
Residents speaking other language at home - Foreign born (%)
Marital status - Never married (%)
Marital status - Now married (%)
Marital status - Separated (%)
Marital status - Widowed (%)
Marital status - Divorced (%)
Ancestries Reported - Arab (%)
Ancestries Reported - Czech (%)
Ancestries Reported - Danish (%)
Ancestries Reported - Dutch (%)
Ancestries Reported - English (%)
Ancestries Reported - French (%)
Ancestries Reported - French Canadian (%)
Ancestries Reported - German (%)
Ancestries Reported - Greek (%)
Ancestries Reported - Hungarian (%)
Ancestries Reported - Irish (%)
Ancestries Reported - Italian (%)
Ancestries Reported - Lithuanian (%)
Ancestries Reported - Norwegian (%)
Ancestries Reported - Polish (%)
Ancestries Reported - Portuguese (%)
Ancestries Reported - Russian (%)
Ancestries Reported - Scotch-Irish (%)
Ancestries Reported - Scottish (%)
Ancestries Reported - Slovak (%)
Ancestries Reported - Subsaharan African (%)
Ancestries Reported - Swedish (%)
Ancestries Reported - Swiss (%)
Ancestries Reported - Ukrainian (%)
Ancestries Reported - United States (%)
Ancestries Reported - Welsh (%)
Ancestries Reported - West Indian (%)
Ancestries Reported - Other (%)
Geographical mobility - Same house 1 year ago (%)
Geographical mobility - Same house 1 year ago (%) - White
Geographical mobility - Same house 1 year ago (%) - Black or African American
Geographical mobility - Same house 1 year ago (%) - Asian
Geographical mobility - Same house 1 year ago (%) - Hispanic or Latino
Geographical mobility - Same house 1 year ago (%) - American Indian and Alaska Native
Geographical mobility - Same house 1 year ago (%) - Multirace
Geographical mobility - Same house 1 year ago (%) - Other Race
Geographical mobility - Moved within same county (%)
Geographical mobility - Moved within same county (%) - White
Geographical mobility - Moved within same county (%) - Black or African American
Geographical mobility - Moved within same county (%) - Asian
Geographical mobility - Moved within same county (%) - Hispanic or Latino
Geographical mobility - Moved within same county (%) - American Indian and Alaska Native
Geographical mobility - Moved within same county (%) - Multirace
Geographical mobility - Moved within same county (%) - Other Race
Geographical mobility - Moved from different county within same state (%)
Geographical mobility - Moved from different county within same state (%) - White
Geographical mobility - Moved from different county within same state (%) - Black or African American
Geographical mobility - Moved from different county within same state (%) - Asian
Geographical mobility - Moved from different county within same state (%) - Hispanic or Latino
Geographical mobility - Moved from different county within same state (%) - American Indian and Alaska Native
Geographical mobility - Moved from different county within same state (%) - Multirace
Geographical mobility - Moved from different county within same state (%) - Other Race
Geographical mobility - Moved from different state (%)
Geographical mobility - Moved from different state (%) - White
Geographical mobility - Moved from different state (%) - Black or African American
Geographical mobility - Moved from different state (%) - Asian
Geographical mobility - Moved from different state (%) - Hispanic or Latino
Geographical mobility - Moved from different state (%) - American Indian and Alaska Native
Geographical mobility - Moved from different state (%) - Multirace
Geographical mobility - Moved from different state (%) - Other Race
Geographical mobility - Moved from abroad (%)
Geographical mobility - Moved from abroad (%) - White
Geographical mobility - Moved from abroad (%) - Black or African American
Geographical mobility - Moved from abroad (%) - Asian
Geographical mobility - Moved from abroad (%) - Hispanic or Latino
Geographical mobility - Moved from abroad (%) - American Indian and Alaska Native
Geographical mobility - Moved from abroad (%) - Multirace
Geographical mobility - Moved from abroad (%) - Other Race
Place of birth for the foreign-born population - Ireland (%)
Place of birth for the foreign-born population - Denmark (%)
Place of birth for the foreign-born population - Norway (%)
Place of birth for the foreign-born population - Sweden (%)
Place of birth for the foreign-born population - United Kingdom (%)
Place of birth for the foreign-born population - England (%)
Place of birth for the foreign-born population - Scotland (%)
Place of birth for the foreign-born population - Other Northern Europe (%)
Place of birth for the foreign-born population - Austria (%)
Place of birth for the foreign-born population - Belgium (%)
Place of birth for the foreign-born population - France (%)
Place of birth for the foreign-born population - Germany (%)
Place of birth for the foreign-born population - Netherlands (%)
Place of birth for the foreign-born population - Switzerland (%)
Place of birth for the foreign-born population - Other Western Europe (%)
Place of birth for the foreign-born population - Greece (%)
Place of birth for the foreign-born population - Italy (%)
Place of birth for the foreign-born population - Portugal (%)
Place of birth for the foreign-born population - Spain (%)
Place of birth for the foreign-born population - Other Southern Europe (%)
Place of birth for the foreign-born population - Albania (%)
Place of birth for the foreign-born population - Belarus (%)
Place of birth for the foreign-born population - Bosnia and Herzegovina (%)
Place of birth for the foreign-born population - Bulgaria (%)
Place of birth for the foreign-born population - Croatia (%)
Place of birth for the foreign-born population - Czechoslovakia (%)
Place of birth for the foreign-born population - Hungary (%)
Place of birth for the foreign-born population - Latvia (%)
Place of birth for the foreign-born population - Lithuania (%)
Place of birth for the foreign-born population - North Macedonia (Macedonia) (%)
Place of birth for the foreign-born population - Moldova (%)
Place of birth for the foreign-born population - Poland (%)
Place of birth for the foreign-born population - Romania (%)
Place of birth for the foreign-born population - Russia (%)
Place of birth for the foreign-born population - Serbia (%)
Place of birth for the foreign-born population - Ukraine (%)
Place of birth for the foreign-born population - Other Eastern Europe (%)
Place of birth for the foreign-born population - China (%)
Place of birth for the foreign-born population - Hong Kong (%)
Place of birth for the foreign-born population - Taiwan (%)
Place of birth for the foreign-born population - Japan (%)
Place of birth for the foreign-born population - Korea (%)
Place of birth for the foreign-born population - Other Eastern Asia (%)
Place of birth for the foreign-born population - Afghanistan (%)
Place of birth for the foreign-born population - Bangladesh (%)
Place of birth for the foreign-born population - India (%)
Place of birth for the foreign-born population - Iran (%)
Place of birth for the foreign-born population - Kazakhstan (%)
Place of birth for the foreign-born population - Nepal (%)
Place of birth for the foreign-born population - Pakistan (%)
Place of birth for the foreign-born population - Sri Lanka (%)
Place of birth for the foreign-born population - Uzbekistan (%)
Place of birth for the foreign-born population - Other South Central Asia (%)
Place of birth for the foreign-born population - Burma (%)
Place of birth for the foreign-born population - Cambodia (%)
Place of birth for the foreign-born population - Indonesia (%)
Place of birth for the foreign-born population - Laos (%)
Place of birth for the foreign-born population - Malaysia (%)
Place of birth for the foreign-born population - Philippines (%)
Place of birth for the foreign-born population - Singapore (%)
Place of birth for the foreign-born population - Thailand (%)
Place of birth for the foreign-born population - Vietnam (%)
Place of birth for the foreign-born population - Other South Eastern Asia (%)
Place of birth for the foreign-born population - Armenia (%)
Place of birth for the foreign-born population - Iraq (%)
Place of birth for the foreign-born population - Israel (%)
Place of birth for the foreign-born population - Jordan (%)
Place of birth for the foreign-born population - Kuwait (%)
Place of birth for the foreign-born population - Lebanon (%)
Place of birth for the foreign-born population - Saudi Arabia (%)
Place of birth for the foreign-born population - Syria (%)
Place of birth for the foreign-born population - Turkey (%)
Place of birth for the foreign-born population - Yemen (%)
Place of birth for the foreign-born population - Other Western Asia (%)
Place of birth for the foreign-born population - Eritrea (%)
Place of birth for the foreign-born population - Ethiopia (%)
Place of birth for the foreign-born population - Kenya (%)
Place of birth for the foreign-born population - Somalia (%)
Place of birth for the foreign-born population - Uganda (%)
Place of birth for the foreign-born population - Zimbabwe (%)
Place of birth for the foreign-born population - Other Eastern Africa (%)
Place of birth for the foreign-born population - Cameroon (%)
Place of birth for the foreign-born population - Congo (%)
Place of birth for the foreign-born population - Democratic Republic of Congo (Zaire) (%)
Place of birth for the foreign-born population - Other Middle Africa (%)
Place of birth for the foreign-born population - Egypt (%)
Place of birth for the foreign-born population - Morocco (%)
Place of birth for the foreign-born population - Sudan (%)
Place of birth for the foreign-born population - Other Northern Africa (%)
Place of birth for the foreign-born population - South Africa (%)
Place of birth for the foreign-born population - Other Southern Africa (%)
Place of birth for the foreign-born population - Cabo Verde (%)
Place of birth for the foreign-born population - Ghana (%)
Place of birth for the foreign-born population - Liberia (%)
Place of birth for the foreign-born population - Nigeria (%)
Place of birth for the foreign-born population - Senegal (%)
Place of birth for the foreign-born population - Sierra Leone (%)
Place of birth for the foreign-born population - Other Western Africa (%)
Place of birth for the foreign-born population - Australia (%)
Place of birth for the foreign-born population - New Zealand (%)
Place of birth for the foreign-born population - Fiji (%)
Place of birth for the foreign-born population - Micronesia (%)
Place of birth for the foreign-born population - Bahamas (%)
Place of birth for the foreign-born population - Barbados (%)
Place of birth for the foreign-born population - Cuba (%)
Place of birth for the foreign-born population - Dominica (%)
Place of birth for the foreign-born population - Dominican Republic (%)
Place of birth for the foreign-born population - Grenada (%)
Place of birth for the foreign-born population - Haiti (%)
Place of birth for the foreign-born population - Jamaica (%)
Place of birth for the foreign-born population - St. Vincent and the Grenadines (%)
Place of birth for the foreign-born population - Trinidad and Tobago (%)
Place of birth for the foreign-born population - West Indies (%)
Place of birth for the foreign-born population - Other Caribbean (%)
Place of birth for the foreign-born population - Belize (%)
Place of birth for the foreign-born population - Costa Rica (%)
Place of birth for the foreign-born population - El Salvador (%)
Place of birth for the foreign-born population - Guatemala (%)
Place of birth for the foreign-born population - Honduras (%)
Place of birth for the foreign-born population - Mexico (%)
Place of birth for the foreign-born population - Nicaragua (%)
Place of birth for the foreign-born population - Panama (%)
Place of birth for the foreign-born population - Other Central America (%)
Place of birth for the foreign-born population - Argentina (%)
Place of birth for the foreign-born population - Bolivia (%)
Place of birth for the foreign-born population - Brazil (%)
Place of birth for the foreign-born population - Chile (%)
Place of birth for the foreign-born population - Colombia (%)
Place of birth for the foreign-born population - Ecuador (%)
Place of birth for the foreign-born population - Guyana (%)
Place of birth for the foreign-born population - Peru (%)
Place of birth for the foreign-born population - Uruguay (%)
Place of birth for the foreign-born population - Venezuela (%)
Place of birth for the foreign-born population - Other South America (%)
Place of birth for the foreign-born population - Canada (%)
Place of birth for the foreign-born population - Other Northern America (%)
Place of birth for the foreign-born population - Other (%)
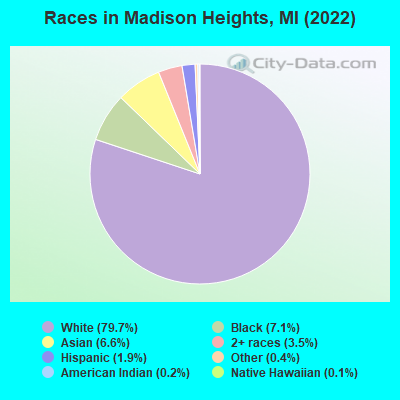
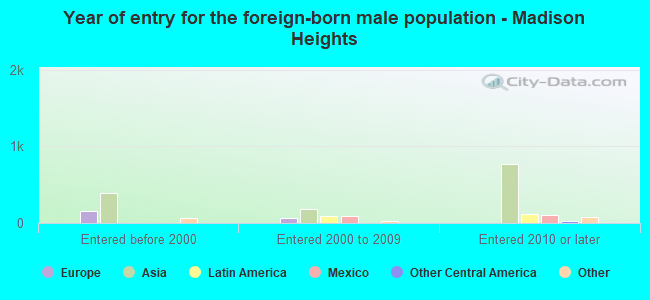
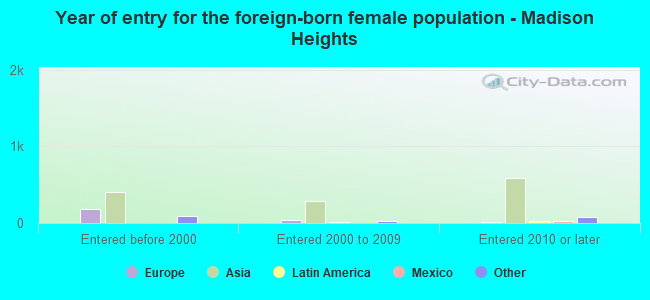
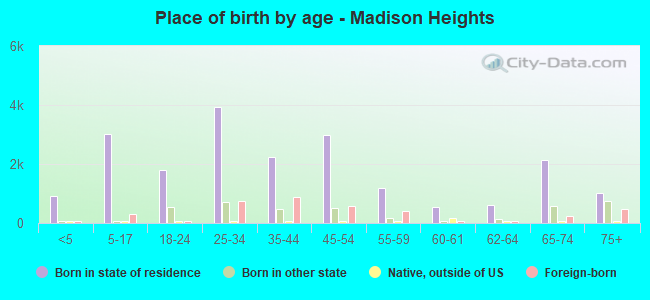
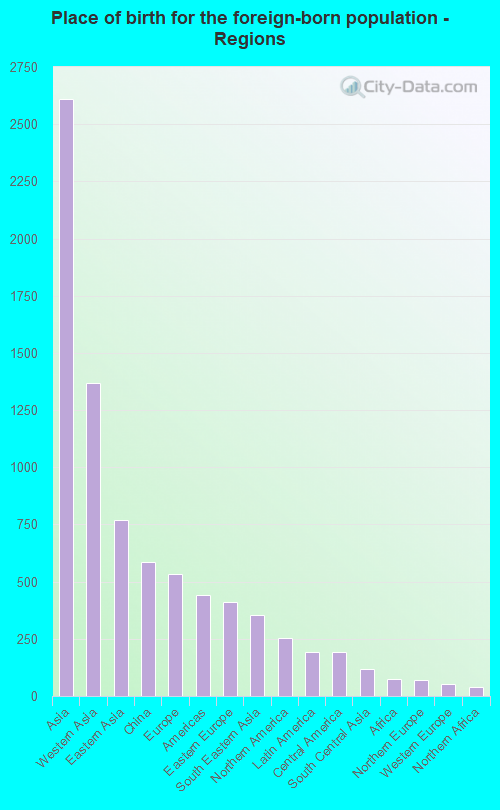
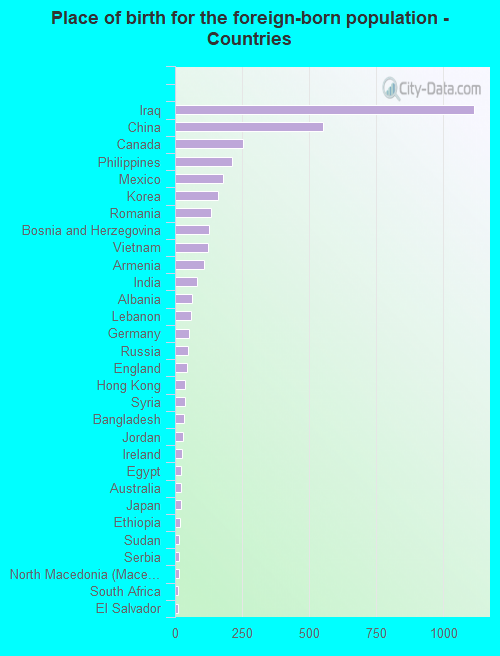
According to 2022 data, the most numerous races in Madison Heights, MI are White alone (22,672 residents), Black alone (2,028 residents), and Hispanic (551 residents). 85.0% of Madison Heights residents speak English at home. 12.9% of Madison Heights, MI residents are foreign-born (9.1% born in Asia, 1.9% born in Europe), which is 53.6% greater than the foreign-born rate of 6.0% across the entire state of Michigan.
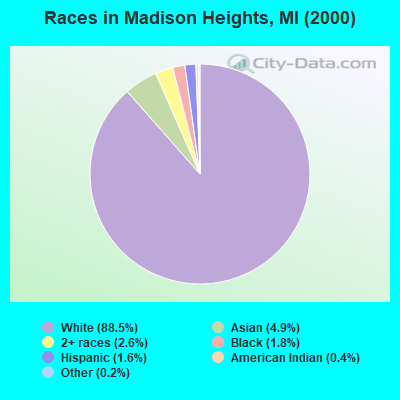
Race distribution in Madison Heights
2000 2022
7,806,691 78.6% White alone 1,402,047 14.1% Black alone 323,877 3.3% Hispanic 175,311 1.8% Asian alone 163,487 1.6% Two or more races 53,421 0.5% American Indian alone 11,465 0.1% Other race alone 2,145 0.02% Native Hawaiian and Other
7,289,051 72.6% White alone 1,310,464 13.1% Black alone 572,405 5.7% Hispanic 450,031 4.5% Two or more races 335,732 3.3% Asian alone 45,217 0.5% Other race alone 29,011 0.3% American Indian alone 2,207 0.02% Native Hawaiian and Other
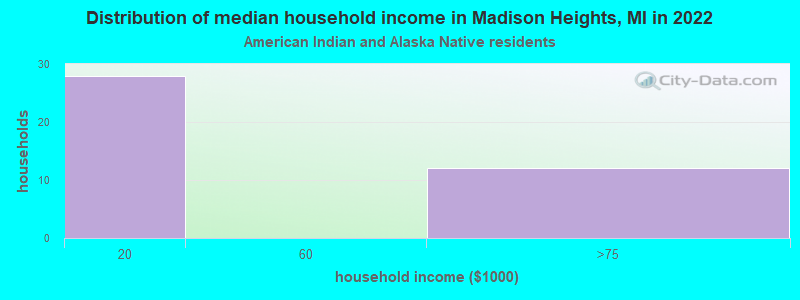
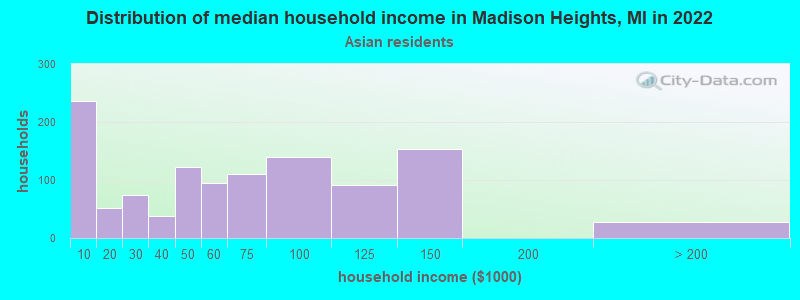
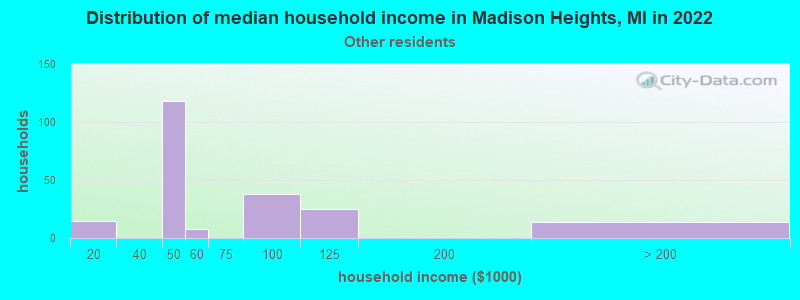
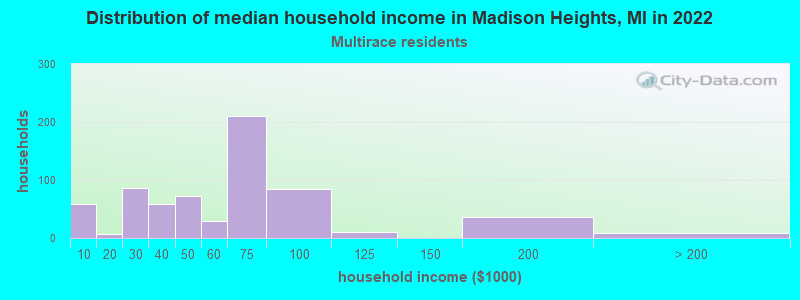
Income and house value in Madison Heights Median household income in 2022 $66,443 White non-Hispanic householders$50,527 Black householders$67,153 Asian householders$43,939 Two or more races householders$43,338 Hispanic or Latino race householdersMedian 2022 house value $191,395 White Non-Hispanic householders$209,929 Black or African American householders$187,585 American Indian or Alaska Native householders $201,268 Asian householders$195,552 Some other race householders$144,975 Two or more races householders$234,005 Hispanic or Latino householders
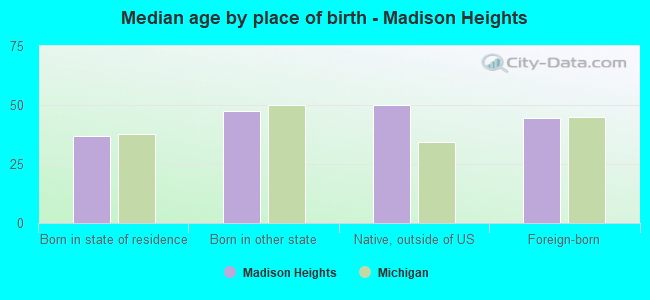
Median age by race in Madison Heights
42.2 Median age for White residents41.7 42.6 34.5 Median age for Black or African American residents33.8 46.3 35.2 Median age for American Indian / Alaska Native residents19.2 48.2 43.9 Median age for Asian residents32.3 50.3 -670,531,400.3 Median age for Native Hawaiian / Pacific Islander residents-674,772,035.8 -699,588,476.7 31.0 Median age for Other race residents35.4 27.2 28.5 Median age for Two or more races residents27.7 35.1 42.2 Median age for White alone residents41.7 42.7 32.5 Median age for Hispanic or Latino residents32.5 31.5
Owner/renter occupied households by race in Madison Heights
House owners and renters - White residents 7,400 71.4% Owner occupied2,968 28.6% Renter occupiedHouse owners and renters - Black or African American residents 126 11.3% Owner occupied986 88.7% Renter occupiedHouse owners and renters - American Indian / Alaska Native residents 20 58.6% Owner occupied14 41.4% Renter occupiedHouse owners and renters - Asian residents 589 53.9% Owner occupied503 46.1% Renter occupiedHouse owners and renters - Native Hawaiian / Pacific Islander residents 12 100.0% Owner occupiedHouse owners and renters - Other race residents 40 21.1% Owner occupied150 78.9% Renter occupiedHouse owners and renters - Two or more races residents 294 43.0% Owner occupied390 57.0% Renter occupiedHouse owners and renters - White alone residents 7,406 71.4% Owner occupied2,961 28.6% Renter occupiedHouse owners and renters - Hispanic or Latino residents 79 26.1% Owner occupied225 73.9% Renter occupied
Language usage in Madison Heights
English speakers - Total 85.0% of residents of Madison Heights speak English at home.
1.6% of residents speak Spanish at home 308 69.5% Speak English very well135 30.5% Speak English less than very well13.1% of residents speak other language at home 1,789 49.8% Speak English very well1,806 50.2% Speak English less than very well
English speakers - Born in the United States 96.8% of residents of Madison Heights speak English at home.
1.8% of residents speak Spanish at home 71 100.0% Speak English very well1.3% of residents speak other language at home 47 90.4% Speak English very well5 9.6% Speak English less than very well
English speakers - Native, born elsewhere 62.2% of residents of Madison Heights speak English at home.
8.0% of residents speak Spanish at home 29 100.0% Speak English very well42.3% of residents speak other language at home 153 100.0% Speak English less than very well
English speakers - Foreign-born 17.5% of residents of Madison Heights speak English at home.
6.7% of residents speak Spanish at home 106 42.6% Speak English very well143 57.4% Speak English less than very well73.6% of residents speak other language at home 1,252 45.8% Speak English very well1,481 54.2% Speak English less than very well
White (Caucasian) - Speak only English Native:
97.6% (19,510)Foreign-born:
25.3% (457)
White (Caucasian) - Speak another language Native:
2.5% (500)Foreign-born:
74.2% (1,340)
Black or African American - Speak only English Native:
100.0% (1,910)Foreign-born:
16.3% (11)
Asian - Speak only English Native:
31.5% (176)Foreign-born:
8.5% (111)
Asian - Speak another language Native:
67.3% (376)Foreign-born:
91.4% (1,197)
Other race - Speak only English Native:
34.3% (25)Foreign-born:
11.7% (34)
Other race - Speak another language Native:
70.6% (52)Foreign-born:
79.3% (233)
Two or more races - Speak another language Native:
8.2% (76)Foreign-born:
100.0% (111)
White alone - Speak only English Native:
97.3% (19,464)Foreign-born:
24.6% (462)
White alone - Speak another language Native:
2.6% (524)Foreign-born:
75.0% (1,409)
Hispanic or Latino - Speak another language Native:
30.3% (92)Foreign-born:
100.0% (243)
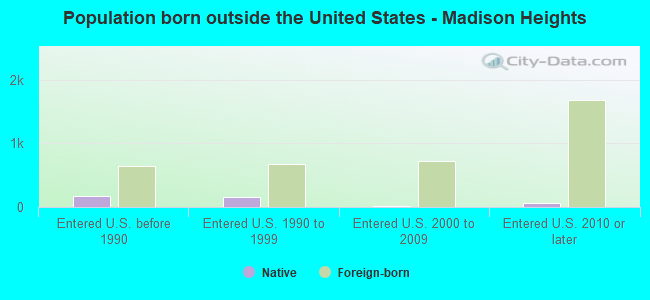
Foreign-born residents in Madison Heights 3,681 residents are foreign born (9.1% Asia , 1.9% Europe ).
This city:
12.9%Michigan:
6.9%
Marital status for residents in Madison Heights Marital status - White (Caucasian) population 15 years and over
Males 43.8% Never married43.9% Now married0.6% Separated3.9% Widowed7.8% DivorcedFemales 34.6% Never married40.2% Now married1.0% Separated9.4% Widowed14.8% DivorcedWomen who gave birth in the past 12 months Now married:
42.1% (117)Unmarried:
57.9% (161)
Women who did not give birth in the past 12 months Now married:
34.7% (1,797)Unmarried:
65.3% (3,379)
Marital status - Black or African American population 15 years and over
Males 64.6% Never married26.3% Now married0.0% Separated1.5% Widowed7.6% DivorcedFemales 54.3% Never married14.8% Now married0.0% Separated16.2% Widowed14.6% DivorcedWomen who gave birth in the past 12 months Now married:
6.9% (5)Unmarried:
93.1% (62)
Women who did not give birth in the past 12 months Now married:
22.8% (113)Unmarried:
77.2% (382)
Marital status - American Indian / Alaska Native population 15 years and over
Males 71.4% Never married28.6% Now married0.0% Separated0.0% Widowed0.0% DivorcedFemales 6.7% Never married53.3% Now married0.0% Separated0.0% Widowed40.0% DivorcedWomen who did not give birth in the past 12 months Now married:
53.3% (25)Unmarried:
46.7% (22)
Marital status - Asian population 15 years and over
Males 44.2% Never married44.8% Now married0.0% Separated4.0% Widowed7.0% DivorcedFemales 41.2% Never married39.0% Now married0.8% Separated10.7% Widowed8.3% DivorcedWomen who did not give birth in the past 12 months Now married:
53.8% (226)Unmarried:
46.2% (194)
Marital status - Other race population 15 years and over
Males 23.4% Never married44.9% Now married0.0% Separated10.3% Widowed21.5% DivorcedFemales 50.0% Never married50.0% Now married0.0% Separated0.0% Widowed0.0% DivorcedWomen who did not give birth in the past 12 months Now married:
64.3% (40)Unmarried:
35.7% (22)
Marital status - Two or more races population 15 years and over
Males 74.2% Never married14.7% Now married0.0% Separated0.0% Widowed11.1% DivorcedFemales 10.6% Never married38.5% Now married0.0% Separated8.0% Widowed42.9% DivorcedWomen who did not give birth in the past 12 months Now married:
53.1% (84)Unmarried:
46.9% (74)
Marital status - White alone, not Hispanic / Latino population 15 years and over
Males 43.4% Never married44.1% Now married0.6% Separated4.0% Widowed7.9% DivorcedFemales 34.4% Never married40.3% Now married1.1% Separated9.4% Widowed14.8% DivorcedWomen who gave birth in the past 12 months Now married:
42.1% (119)Unmarried:
57.9% (164)
Women who did not give birth in the past 12 months Now married:
35.1% (1,818)Unmarried:
64.9% (3,358)
Marital status - Hispanic or Latino population 15 years and over
Males 63.2% Never married36.8% Now married0.0% Separated0.0% Widowed0.0% DivorcedFemales 38.5% Never married32.9% Now married0.0% Separated3.8% Widowed24.9% DivorcedWomen who did not give birth in the past 12 months Now married:
29.0% (51)Unmarried:
71.0% (125)
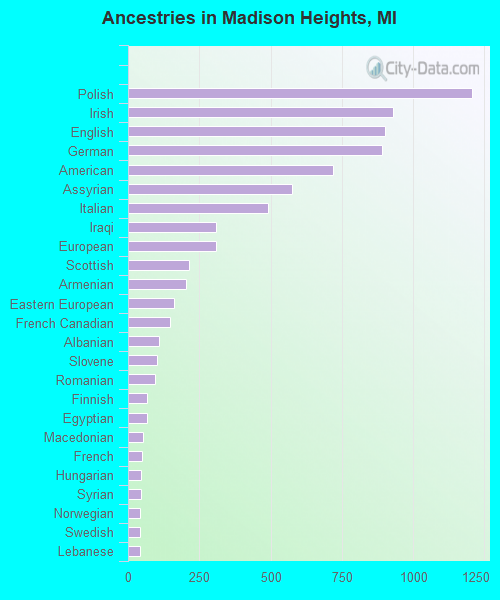
Ancestries in Madison Heights
1,206 9.9% Polish929 7.6% Irish901 7.4% English892 7.3% German719 5.9% American574 4.7% Assyrian491 4.0% Italian310 2.5% Iraqi307 2.5% European213 1.7% Scottish205 1.7% Armenian161 1.3% Eastern European148 1.2% French Canadian110 0.9% Albanian101 0.8% Slovene93 0.8% Romanian67 0.5% Finnish65 0.5% Egyptian51 0.4% Macedonian48 0.4% French47 0.4% Hungarian47 0.4% Syrian43 0.4% Norwegian43 0.4% Swedish42 0.3% Lebanese37 0.3% Scotch-Irish30 0.2% British29 0.2% Russian28 0.2% Canadian25 0.2% Arab25 0.2% African22 0.2% Dutch21 0.2% Ukrainian19 0.2% Greek16 0.1% Yugoslavian15 0.1% Cajun15 0.1% Scandinavian8 0.07% Danish8 0.07% Belgian
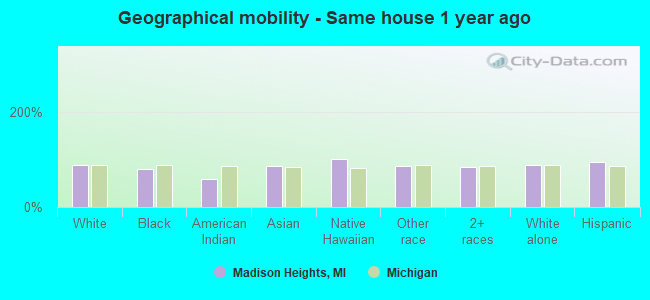
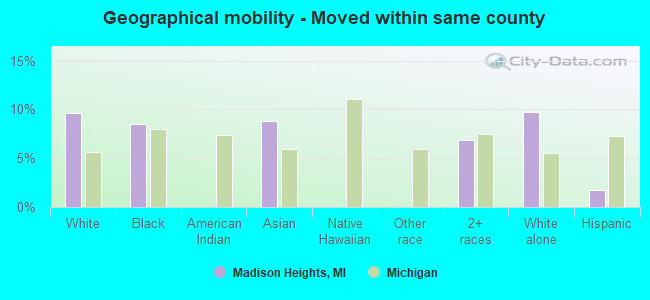
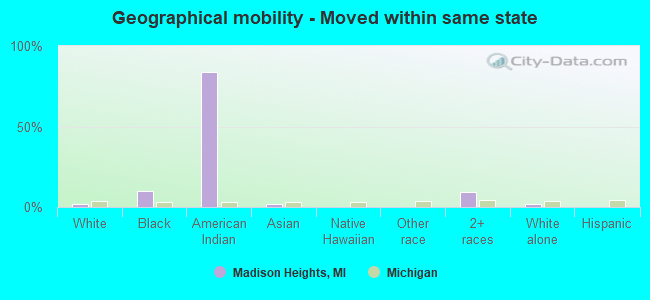
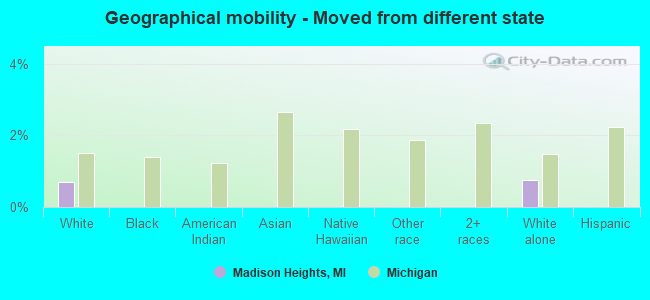
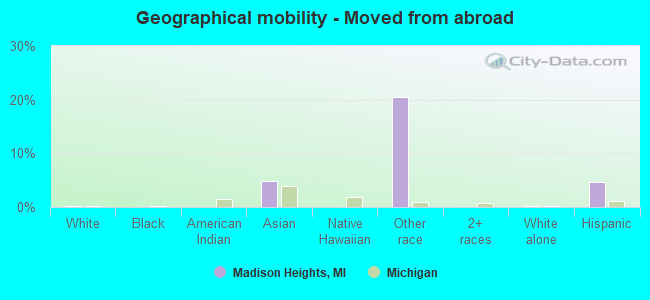
Geographical mobility in Madison Heights Same house 1 year ago 19,642 87.8% White (Caucasian)1,610 79.2% Black or African American40 58.3% American Indian / Alaska Native1,613 84.7% Asian21 100.0% Native Hawaiian / Pacific Islander305 84.7% Other race999 84.1% Two or more races19,668 87.7% White alone, not Hispanic / Latino516 94.3% Hispanic or LatinoMoved within same county 2,147 9.6% White / Caucasian173 8.5% Black or African American168 8.8% Asian82 6.9% Two or more races2,178 9.7% White alone, not Hispanic / Latino9 1.7% Hispanic or LatinoMoved within same state 405 1.8% White / Caucasian196 9.6% Black or African American57 84.1% American Indian / Alaska Native39 2.0% Asian107 9.0% Two or more races400 1.8% White alone, not Hispanic / LatinoMoved from different state 157 0.7% White / Caucasian167 0.7% White alone, not Hispanic / LatinoMoved from abroad 29 0.1% White94 4.9% Asian74 20.4% Other race38 0.2% White alone, not Hispanic / Latino26 4.7% Hispanic or Latino
Children Nativity (place of birth) in Madison Heights
Children under 6 years - Living with two parents Both parents native 636 100.0% NativeBoth parents foreign-born 79 100.0% NativeOne native, one foreign-born parent 98 100.0% NativeChildren under 6 years - Living with one parent Native parent 335 100.0% NativeForeign-born parent 24 60.1% Native16 39.9% Foreign-bornChildren 6 to 17 years - Living with two parents Both parents native 1,194 100.0% NativeBoth parents foreign-born 263 70.2% Native112 29.8% Foreign-bornOne native, one foreign-born parent 117 100.0% NativeChildren 6 to 17 years - Living with one parent Native parent 675 100.0% NativeForeign-born parent 479 63.3% Native278 36.7% Foreign-born
Grandparents responsible for own grandchildren in Madison Heights
Grandparents (30 to 59 years) White / Caucasian 8 3.2% Responsible for grandchildren242 96.8% Not responsible for grandchildrenWhite alone, not Hispanic / Latino 8 3.3% Responsible for grandchildren247 96.7% Not responsible for grandchildrenGrandparents (60 years and over) White / Caucasian 54 14.3% Responsible for grandchildren322 85.7% Not responsible for grandchildrenWhite alone, not Hispanic / Latino 56 14.7% Responsible for grandchildren325 85.3% Not responsible for grandchildren