Races in Madison, Mississippi (MS) Detailed Stats
Data:
Races - White alone (%)
Races - White alone (% change since 2000)
Races - Black alone (%)
Races - Black alone (% change since 2000)
Races - American Indian alone (%)
Races - American Indian alone (% change since 2000)
Races - Asian alone (%)
Races - Asian alone (% change since 2000)
Races - Hispanic (%)
Races - Hispanic (% change since 2000)
Races - Native Hawaiian and Other Pacific Islander alone (%)
Races - Native Hawaiian and Other Pacific Islander alone (% change since 2000)
Races - Two or more races(%)
Races - Two or more races(% change since 2000)
Races - Other race alone (%)
Races - Other race alone (% change since 2000)
Racial diversity
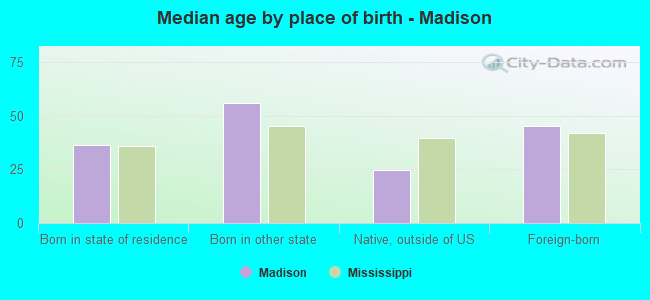
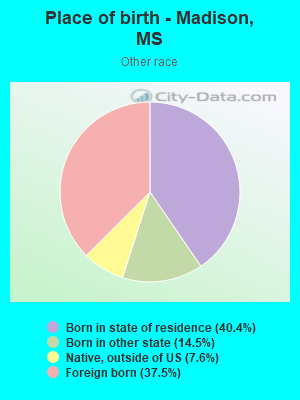
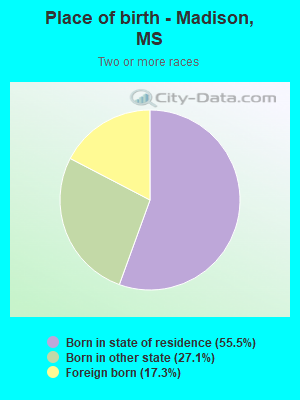
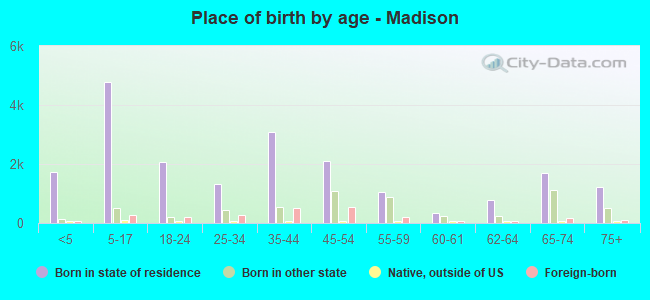
Place of birth - Born in state of residence (%)
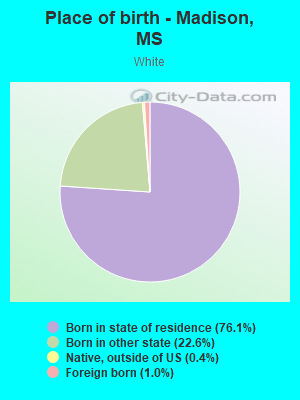
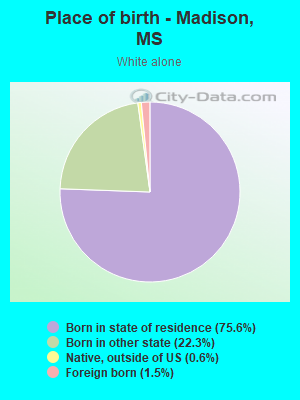
Place of birth - Born in state of residence (%) - White
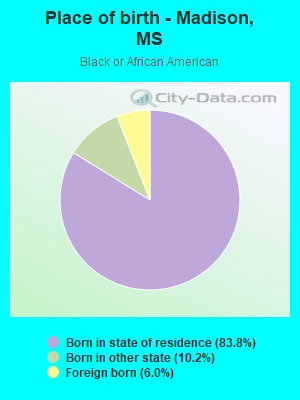
Place of birth - Born in state of residence (%) - Black or African American
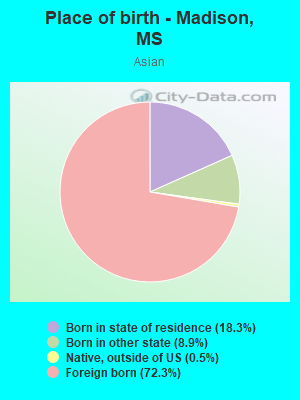
Place of birth - Born in state of residence (%) - Asian
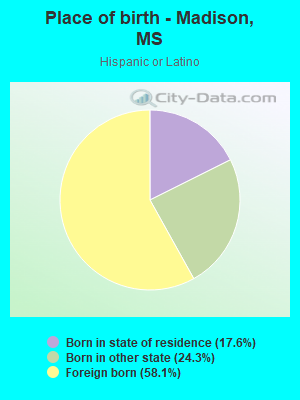
Place of birth - Born in state of residence (%) - Hispanic or Latino
Place of birth - Born in state of residence (%) - American Indian and Alaska Native
Place of birth - Born in state of residence (%) - Multirace
Place of birth - Born in state of residence (%) - Other Race
Place of birth - Born in other state (%)
Place of birth - Born in other state (%) - White
Place of birth - Born in other state (%) - Black or African American
Place of birth - Born in other state (%) - Asian
Place of birth - Born in other state (%) - Hispanic or Latino
Place of birth - Born in other state (%) - American Indian and Alaska Native
Place of birth - Born in other state (%) - Multirace
Place of birth - Born in other state (%) - Other Race
Place of birth - Native, outside of US (%)
Place of birth - Native, outside of US (%) - White
Place of birth - Native, outside of US (%) - Black or African American
Place of birth - Native, outside of US (%) - Asian
Place of birth - Native, outside of US (%) - Hispanic or Latino
Place of birth - Native, outside of US (%) - American Indian and Alaska Native
Place of birth - Native, outside of US (%) - Multirace
Place of birth - Native, outside of US (%) - Other Race
Place of birth - Foreign born (%)
Place of birth - Foreign born (%) - White
Place of birth - Foreign born (%) - Black or African American
Place of birth - Foreign born (%) - Asian
Place of birth - Foreign born (%) - Hispanic or Latino
Place of birth - Foreign born (%) - American Indian and Alaska Native
Place of birth - Foreign born (%) - Multirace
Place of birth - Foreign born (%) - Other Race
Residents speaking English at home (%)
Residents speaking English at home - Born in the United States (%)
Residents speaking English at home - Native, born elsewhere (%)
Residents speaking English at home - Foreign born (%)
Residents speaking Spanish at home (%)
Residents speaking Spanish at home - Born in the United States (%)
Residents speaking Spanish at home - Native, born elsewhere (%)
Residents speaking Spanish at home - Foreign born (%)
Residents speaking other language at home (%)
Residents speaking other language at home - Born in the United States (%)
Residents speaking other language at home - Native, born elsewhere (%)
Residents speaking other language at home - Foreign born (%)
Marital status - Never married (%)
Marital status - Now married (%)
Marital status - Separated (%)
Marital status - Widowed (%)
Marital status - Divorced (%)
Ancestries Reported - Arab (%)
Ancestries Reported - Czech (%)
Ancestries Reported - Danish (%)
Ancestries Reported - Dutch (%)
Ancestries Reported - English (%)
Ancestries Reported - French (%)
Ancestries Reported - French Canadian (%)
Ancestries Reported - German (%)
Ancestries Reported - Greek (%)
Ancestries Reported - Hungarian (%)
Ancestries Reported - Irish (%)
Ancestries Reported - Italian (%)
Ancestries Reported - Lithuanian (%)
Ancestries Reported - Norwegian (%)
Ancestries Reported - Polish (%)
Ancestries Reported - Portuguese (%)
Ancestries Reported - Russian (%)
Ancestries Reported - Scotch-Irish (%)
Ancestries Reported - Scottish (%)
Ancestries Reported - Slovak (%)
Ancestries Reported - Subsaharan African (%)
Ancestries Reported - Swedish (%)
Ancestries Reported - Swiss (%)
Ancestries Reported - Ukrainian (%)
Ancestries Reported - United States (%)
Ancestries Reported - Welsh (%)
Ancestries Reported - West Indian (%)
Ancestries Reported - Other (%)
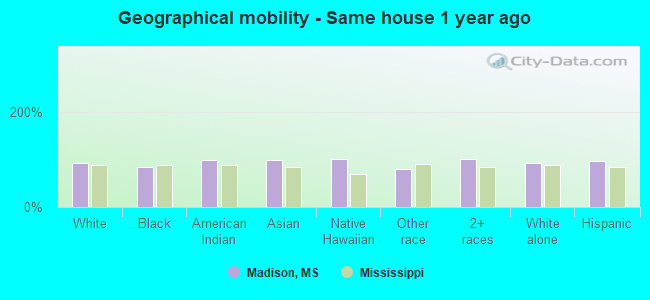
Geographical mobility - Same house 1 year ago (%)
Geographical mobility - Same house 1 year ago (%) - White
Geographical mobility - Same house 1 year ago (%) - Black or African American
Geographical mobility - Same house 1 year ago (%) - Asian
Geographical mobility - Same house 1 year ago (%) - Hispanic or Latino
Geographical mobility - Same house 1 year ago (%) - American Indian and Alaska Native
Geographical mobility - Same house 1 year ago (%) - Multirace
Geographical mobility - Same house 1 year ago (%) - Other Race
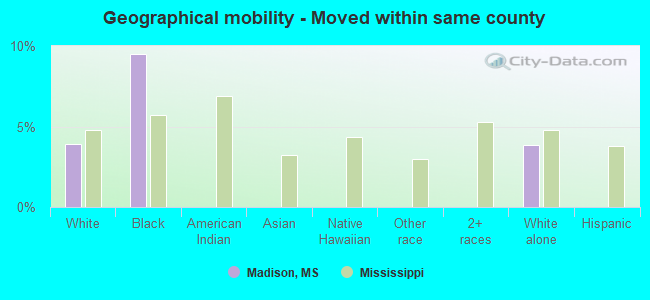
Geographical mobility - Moved within same county (%)
Geographical mobility - Moved within same county (%) - White
Geographical mobility - Moved within same county (%) - Black or African American
Geographical mobility - Moved within same county (%) - Asian
Geographical mobility - Moved within same county (%) - Hispanic or Latino
Geographical mobility - Moved within same county (%) - American Indian and Alaska Native
Geographical mobility - Moved within same county (%) - Multirace
Geographical mobility - Moved within same county (%) - Other Race
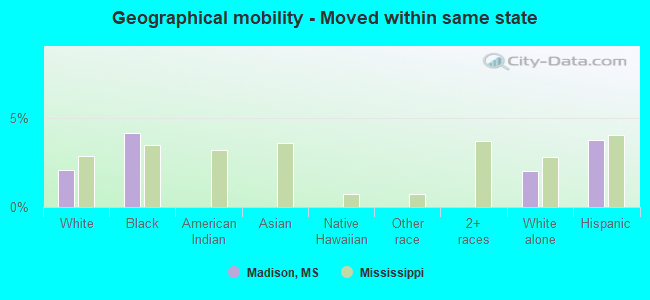
Geographical mobility - Moved from different county within same state (%)
Geographical mobility - Moved from different county within same state (%) - White
Geographical mobility - Moved from different county within same state (%) - Black or African American
Geographical mobility - Moved from different county within same state (%) - Asian
Geographical mobility - Moved from different county within same state (%) - Hispanic or Latino
Geographical mobility - Moved from different county within same state (%) - American Indian and Alaska Native
Geographical mobility - Moved from different county within same state (%) - Multirace
Geographical mobility - Moved from different county within same state (%) - Other Race
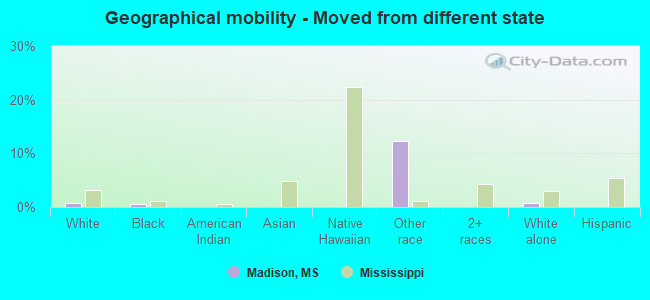
Geographical mobility - Moved from different state (%)
Geographical mobility - Moved from different state (%) - White
Geographical mobility - Moved from different state (%) - Black or African American
Geographical mobility - Moved from different state (%) - Asian
Geographical mobility - Moved from different state (%) - Hispanic or Latino
Geographical mobility - Moved from different state (%) - American Indian and Alaska Native
Geographical mobility - Moved from different state (%) - Multirace
Geographical mobility - Moved from different state (%) - Other Race
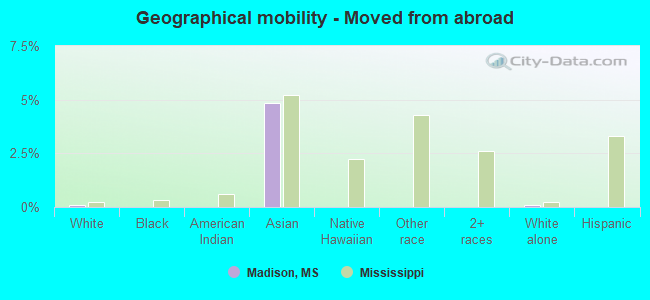
Geographical mobility - Moved from abroad (%)
Geographical mobility - Moved from abroad (%) - White
Geographical mobility - Moved from abroad (%) - Black or African American
Geographical mobility - Moved from abroad (%) - Asian
Geographical mobility - Moved from abroad (%) - Hispanic or Latino
Geographical mobility - Moved from abroad (%) - American Indian and Alaska Native
Geographical mobility - Moved from abroad (%) - Multirace
Geographical mobility - Moved from abroad (%) - Other Race
Place of birth for the foreign-born population - Ireland (%)
Place of birth for the foreign-born population - Denmark (%)
Place of birth for the foreign-born population - Norway (%)
Place of birth for the foreign-born population - Sweden (%)
Place of birth for the foreign-born population - United Kingdom (%)
Place of birth for the foreign-born population - England (%)
Place of birth for the foreign-born population - Scotland (%)
Place of birth for the foreign-born population - Other Northern Europe (%)
Place of birth for the foreign-born population - Austria (%)
Place of birth for the foreign-born population - Belgium (%)
Place of birth for the foreign-born population - France (%)
Place of birth for the foreign-born population - Germany (%)
Place of birth for the foreign-born population - Netherlands (%)
Place of birth for the foreign-born population - Switzerland (%)
Place of birth for the foreign-born population - Other Western Europe (%)
Place of birth for the foreign-born population - Greece (%)
Place of birth for the foreign-born population - Italy (%)
Place of birth for the foreign-born population - Portugal (%)
Place of birth for the foreign-born population - Spain (%)
Place of birth for the foreign-born population - Other Southern Europe (%)
Place of birth for the foreign-born population - Albania (%)
Place of birth for the foreign-born population - Belarus (%)
Place of birth for the foreign-born population - Bosnia and Herzegovina (%)
Place of birth for the foreign-born population - Bulgaria (%)
Place of birth for the foreign-born population - Croatia (%)
Place of birth for the foreign-born population - Czechoslovakia (%)
Place of birth for the foreign-born population - Hungary (%)
Place of birth for the foreign-born population - Latvia (%)
Place of birth for the foreign-born population - Lithuania (%)
Place of birth for the foreign-born population - North Macedonia (Macedonia) (%)
Place of birth for the foreign-born population - Moldova (%)
Place of birth for the foreign-born population - Poland (%)
Place of birth for the foreign-born population - Romania (%)
Place of birth for the foreign-born population - Russia (%)
Place of birth for the foreign-born population - Serbia (%)
Place of birth for the foreign-born population - Ukraine (%)
Place of birth for the foreign-born population - Other Eastern Europe (%)
Place of birth for the foreign-born population - China (%)
Place of birth for the foreign-born population - Hong Kong (%)
Place of birth for the foreign-born population - Taiwan (%)
Place of birth for the foreign-born population - Japan (%)
Place of birth for the foreign-born population - Korea (%)
Place of birth for the foreign-born population - Other Eastern Asia (%)
Place of birth for the foreign-born population - Afghanistan (%)
Place of birth for the foreign-born population - Bangladesh (%)
Place of birth for the foreign-born population - India (%)
Place of birth for the foreign-born population - Iran (%)
Place of birth for the foreign-born population - Kazakhstan (%)
Place of birth for the foreign-born population - Nepal (%)
Place of birth for the foreign-born population - Pakistan (%)
Place of birth for the foreign-born population - Sri Lanka (%)
Place of birth for the foreign-born population - Uzbekistan (%)
Place of birth for the foreign-born population - Other South Central Asia (%)
Place of birth for the foreign-born population - Burma (%)
Place of birth for the foreign-born population - Cambodia (%)
Place of birth for the foreign-born population - Indonesia (%)
Place of birth for the foreign-born population - Laos (%)
Place of birth for the foreign-born population - Malaysia (%)
Place of birth for the foreign-born population - Philippines (%)
Place of birth for the foreign-born population - Singapore (%)
Place of birth for the foreign-born population - Thailand (%)
Place of birth for the foreign-born population - Vietnam (%)
Place of birth for the foreign-born population - Other South Eastern Asia (%)
Place of birth for the foreign-born population - Armenia (%)
Place of birth for the foreign-born population - Iraq (%)
Place of birth for the foreign-born population - Israel (%)
Place of birth for the foreign-born population - Jordan (%)
Place of birth for the foreign-born population - Kuwait (%)
Place of birth for the foreign-born population - Lebanon (%)
Place of birth for the foreign-born population - Saudi Arabia (%)
Place of birth for the foreign-born population - Syria (%)
Place of birth for the foreign-born population - Turkey (%)
Place of birth for the foreign-born population - Yemen (%)
Place of birth for the foreign-born population - Other Western Asia (%)
Place of birth for the foreign-born population - Eritrea (%)
Place of birth for the foreign-born population - Ethiopia (%)
Place of birth for the foreign-born population - Kenya (%)
Place of birth for the foreign-born population - Somalia (%)
Place of birth for the foreign-born population - Uganda (%)
Place of birth for the foreign-born population - Zimbabwe (%)
Place of birth for the foreign-born population - Other Eastern Africa (%)
Place of birth for the foreign-born population - Cameroon (%)
Place of birth for the foreign-born population - Congo (%)
Place of birth for the foreign-born population - Democratic Republic of Congo (Zaire) (%)
Place of birth for the foreign-born population - Other Middle Africa (%)
Place of birth for the foreign-born population - Egypt (%)
Place of birth for the foreign-born population - Morocco (%)
Place of birth for the foreign-born population - Sudan (%)
Place of birth for the foreign-born population - Other Northern Africa (%)
Place of birth for the foreign-born population - South Africa (%)
Place of birth for the foreign-born population - Other Southern Africa (%)
Place of birth for the foreign-born population - Cabo Verde (%)
Place of birth for the foreign-born population - Ghana (%)
Place of birth for the foreign-born population - Liberia (%)
Place of birth for the foreign-born population - Nigeria (%)
Place of birth for the foreign-born population - Senegal (%)
Place of birth for the foreign-born population - Sierra Leone (%)
Place of birth for the foreign-born population - Other Western Africa (%)
Place of birth for the foreign-born population - Australia (%)
Place of birth for the foreign-born population - New Zealand (%)
Place of birth for the foreign-born population - Fiji (%)
Place of birth for the foreign-born population - Micronesia (%)
Place of birth for the foreign-born population - Bahamas (%)
Place of birth for the foreign-born population - Barbados (%)
Place of birth for the foreign-born population - Cuba (%)
Place of birth for the foreign-born population - Dominica (%)
Place of birth for the foreign-born population - Dominican Republic (%)
Place of birth for the foreign-born population - Grenada (%)
Place of birth for the foreign-born population - Haiti (%)
Place of birth for the foreign-born population - Jamaica (%)
Place of birth for the foreign-born population - St. Vincent and the Grenadines (%)
Place of birth for the foreign-born population - Trinidad and Tobago (%)
Place of birth for the foreign-born population - West Indies (%)
Place of birth for the foreign-born population - Other Caribbean (%)
Place of birth for the foreign-born population - Belize (%)
Place of birth for the foreign-born population - Costa Rica (%)
Place of birth for the foreign-born population - El Salvador (%)
Place of birth for the foreign-born population - Guatemala (%)
Place of birth for the foreign-born population - Honduras (%)
Place of birth for the foreign-born population - Mexico (%)
Place of birth for the foreign-born population - Nicaragua (%)
Place of birth for the foreign-born population - Panama (%)
Place of birth for the foreign-born population - Other Central America (%)
Place of birth for the foreign-born population - Argentina (%)
Place of birth for the foreign-born population - Bolivia (%)
Place of birth for the foreign-born population - Brazil (%)
Place of birth for the foreign-born population - Chile (%)
Place of birth for the foreign-born population - Colombia (%)
Place of birth for the foreign-born population - Ecuador (%)
Place of birth for the foreign-born population - Guyana (%)
Place of birth for the foreign-born population - Peru (%)
Place of birth for the foreign-born population - Uruguay (%)
Place of birth for the foreign-born population - Venezuela (%)
Place of birth for the foreign-born population - Other South America (%)
Place of birth for the foreign-born population - Canada (%)
Place of birth for the foreign-born population - Other Northern America (%)
Place of birth for the foreign-born population - Other (%)
Latest news about races in Madison, MS collected exclusively by city-data.com from local newspapers, TV, and radio stations
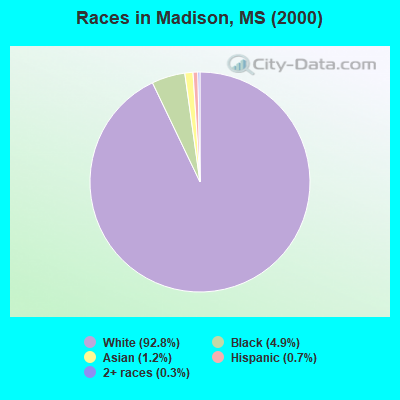
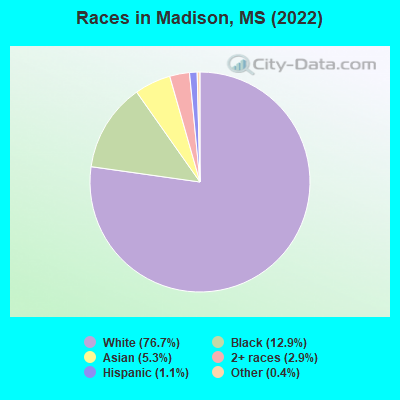
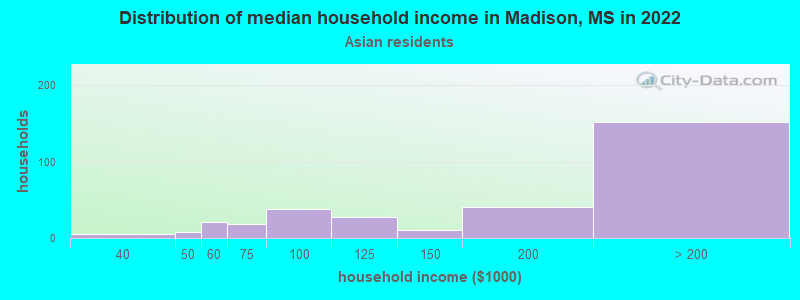
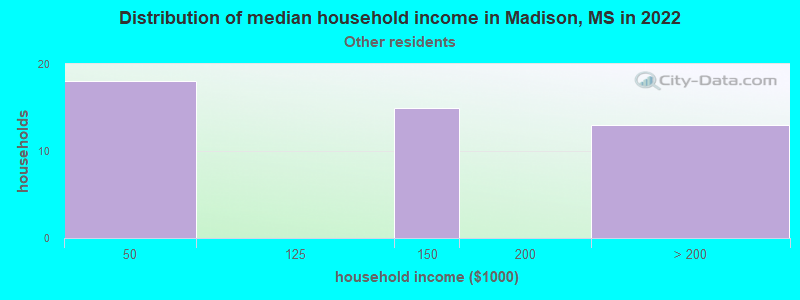
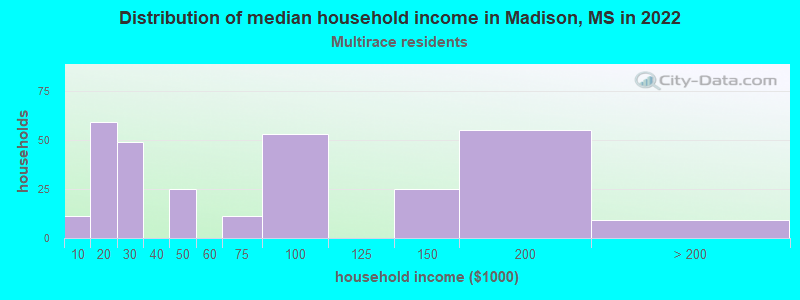
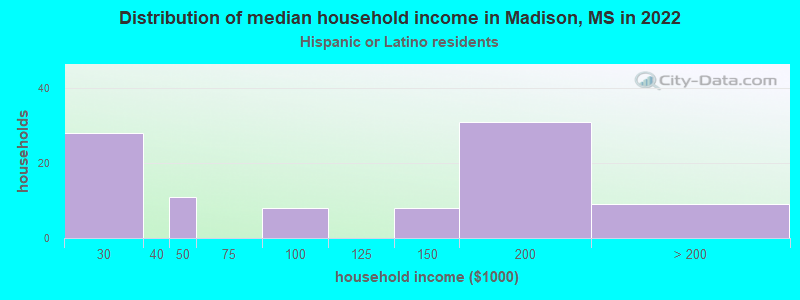
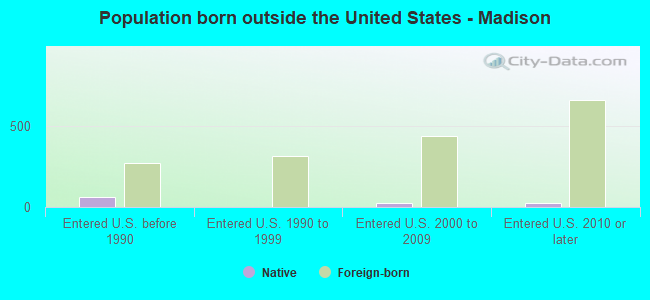
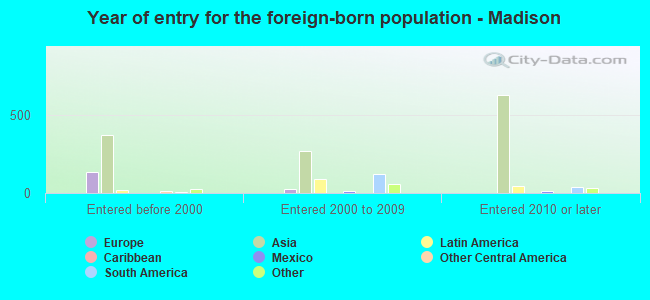
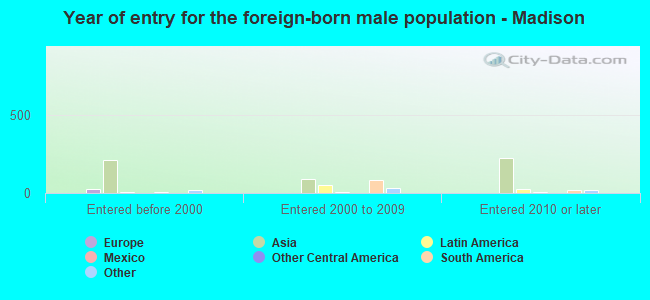
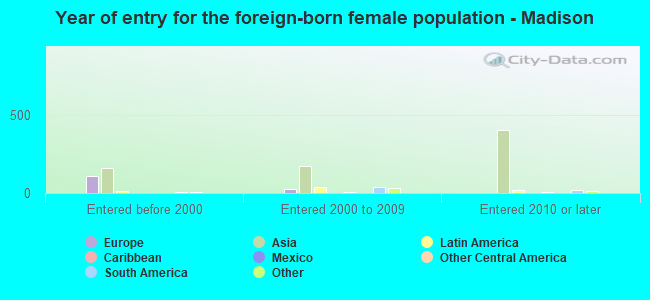
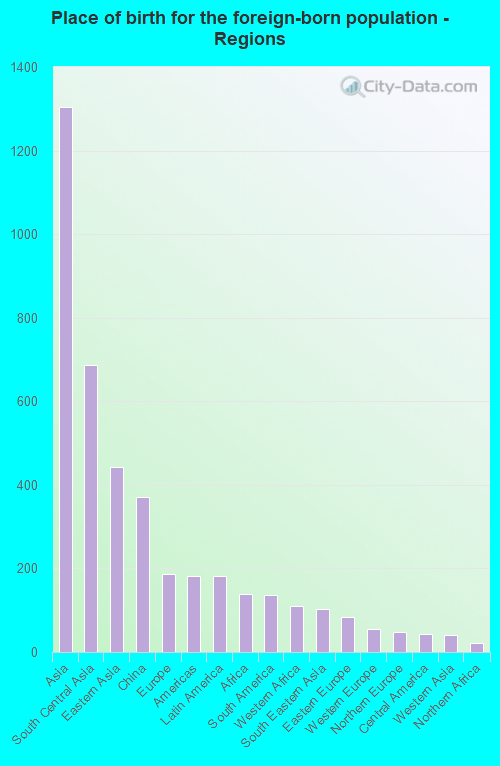
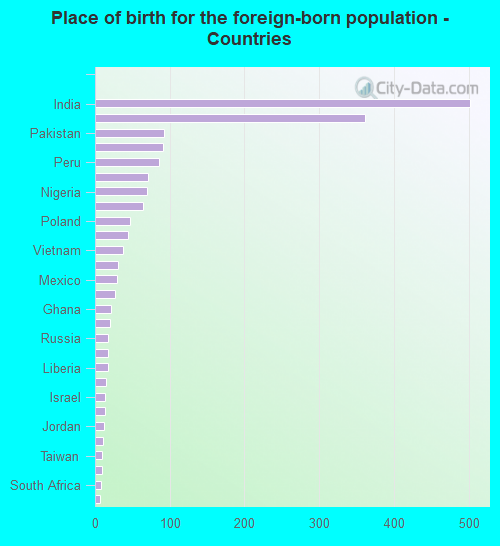
According to 2022 data, the most numerous races in Madison, MS are White alone (21,024 residents), Black alone (3,547 residents), and Hispanic (297 residents). 90.0% of Madison residents speak English at home. 6.5% of Madison, MS residents are foreign-born (4.6% born in Asia, 0.7% born in Europe, 0.7% born in Latin America), which is 69.1% greater than the foreign-born rate of 2.0% across the entire state of Mississippi.
Race distribution in Madison
2000 2022
1,727,908 60.7% White alone 1,028,473 36.2% Black alone 39,569 1.4% Hispanic 17,272 0.6% Two or more races 18,349 0.6% Asian alone 11,224 0.4% American Indian alone 1,294 0.05% Other race alone 569 0.02% Native Hawaiian and Other
1,625,979 55.3% White alone 1,072,962 36.5% Black alone 97,177 3.3% Hispanic 96,367 3.3% Two or more races 25,217 0.9% Asian alone 12,457 0.4% American Indian alone 9,501 0.3% Other race alone 397 0.01% Native Hawaiian and Other
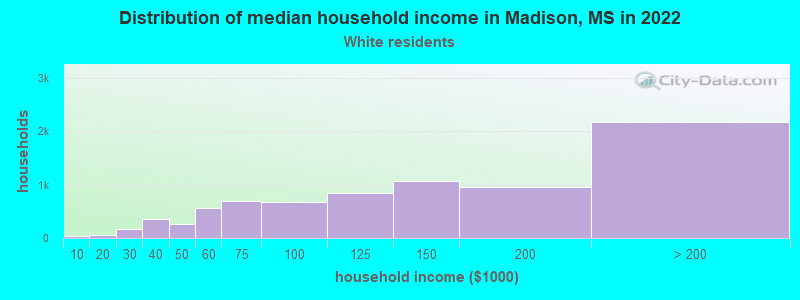
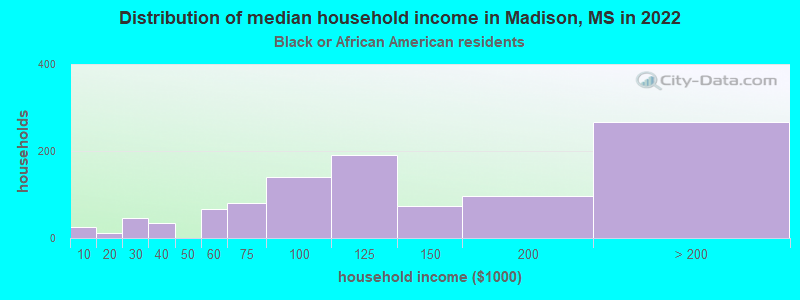
Income and house value in Madison Median household income in 2022 $128,469 White non-Hispanic householders$92,702 Black householders$167,170 Asian householders$151,367 Some other race householdersMedian 2022 house value $330,990 White Non-Hispanic householders$272,033 Black or African American householders$120,849 American Indian or Alaska Native householders $410,740 Asian householders$298,209 Hispanic or Latino householders
Median age by race in Madison
42.2 Median age for White residents40.5 43.5 39.2 Median age for Black or African American residents41.7 38.2 -703,818,368.7 Median age for American Indian / Alaska Native residents-666,666,666.0 -666,666,666.0 43.0 Median age for Asian residents45.3 42.3 -666,666,666.0 Median age for Native Hawaiian / Pacific Islander residents-666,666,666.0 -666,666,666.0 25.4 Median age for Other race residents33.7 26.7 30.7 Median age for Two or more races residents21.1 51.0 41.7 Median age for White alone residents40.1 42.5 45.2 Median age for Hispanic or Latino residents21.5 38.4
Owner/renter occupied households by race in Madison
House owners and renters - White residents 7,253 94.1% Owner occupied459 5.9% Renter occupiedHouse owners and renters - Black or African American residents 1,008 91.1% Owner occupied98 8.9% Renter occupiedHouse owners and renters - American Indian / Alaska Native residents 21 100.0% Owner occupiedHouse owners and renters - Asian residents 291 93.4% Owner occupied21 6.6% Renter occupiedHouse owners and renters - Other race residents 38 83.0% Owner occupied8 17.0% Renter occupiedHouse owners and renters - Two or more races residents 282 98.2% Owner occupied5 1.8% Renter occupiedHouse owners and renters - White alone residents 7,330 93.9% Owner occupied478 6.1% Renter occupiedHouse owners and renters - Hispanic or Latino residents 123 95.4% Owner occupied6 4.6% Renter occupied
Language usage in Madison
English speakers - Total 90.0% of residents of Madison speak English at home.
1.6% of residents speak Spanish at home 186 44.6% Speak English very well231 55.4% Speak English less than very well9.7% of residents speak other language at home 2,043 80.3% Speak English very well500 19.7% Speak English less than very well
English speakers - Born in the United States 98.6% of residents of Madison speak English at home.
2.2% of residents speak other language at home 117 95.1% Speak English very well6 4.9% Speak English less than very well
All residents speak only English at home
English speakers - Foreign-born 8.5% of residents of Madison speak English at home.
7.1% of residents speak Spanish at home 110 68.8% Speak English very well50 31.2% Speak English less than very well78.6% of residents speak other language at home 1,286 72.3% Speak English very well493 27.7% Speak English less than very well
White (Caucasian) - Speak only English Native:
99.0% (19,249)Foreign-born:
36.1% (87)
White (Caucasian) - Speak another language Native:
1.0% (194)Foreign-born:
61.5% (149)
Black or African American - Speak only English Native:
98.5% (2,965)Foreign-born:
8.6% (10)
Black or African American - Speak another language Native:
1.5% (46)Foreign-born:
95.7% (114)
Asian - Speak only English Native:
69.7% (165)Foreign-born:
6.3% (87)
Asian - Speak another language Native:
34.0% (81)Foreign-born:
77.5% (1,066)
Other race - Speak another language Native:
49.7% (73)Foreign-born:
100.0% (87)
White alone - Speak only English Native:
98.6% (19,297)Foreign-born:
21.6% (75)
White alone - Speak another language Native:
1.4% (271)Foreign-born:
82.0% (285)
Hispanic or Latino - Speak only English Native:
90.5% (98)Foreign-born:
9.1% (18)
Hispanic or Latino - Speak another language Native:
33.4% (36)Foreign-born:
97.3% (193)
Foreign-born residents in Madison 1,815 residents are foreign born (4.6% Asia , 0.7% Europe , 0.7% Latin America ).
This city:
6.5%Mississippi:
2.3%
Marital status for residents in Madison Marital status - White (Caucasian) population 15 years and over
Males 25.8% Never married67.5% Now married0.1% Separated2.1% Widowed4.5% DivorcedFemales 19.7% Never married63.9% Now married0.8% Separated7.8% Widowed7.8% DivorcedWomen who gave birth in the past 12 months Now married:
81.4% (269)Unmarried:
18.6% (61)
Women who did not give birth in the past 12 months Now married:
61.8% (2,534)Unmarried:
38.2% (1,569)
Marital status - Black or African American population 15 years and over
Males 29.0% Never married63.9% Now married0.0% Separated5.9% Widowed1.2% DivorcedFemales 29.2% Never married56.3% Now married2.2% Separated7.5% Widowed4.8% DivorcedWomen who gave birth in the past 12 months Now married:
100.0% (28)Unmarried:
0.0% (0)
Women who did not give birth in the past 12 months Now married:
49.6% (477)Unmarried:
50.4% (484)
Marital status - American Indian / Alaska Native population 15 years and over
Males 0.0% Never married100.0% Now married0.0% Separated0.0% Widowed0.0% DivorcedFemales 0.0% Never married100.0% Now married0.0% Separated0.0% Widowed0.0% DivorcedMarital status - Asian population 15 years and over
Males 6.1% Never married84.4% Now married2.6% Separated0.0% Widowed6.9% DivorcedFemales 13.5% Never married84.6% Now married0.0% Separated1.9% Widowed0.0% DivorcedWomen who gave birth in the past 12 months Now married:
100.0% (26)Unmarried:
0.0% (0)
Women who did not give birth in the past 12 months Now married:
81.6% (345)Unmarried:
18.4% (78)
Marital status - Other race population 15 years and over
Males 41.5% Never married58.5% Now married0.0% Separated0.0% Widowed0.0% DivorcedFemales 44.4% Never married55.6% Now married0.0% Separated0.0% Widowed0.0% DivorcedWomen who did not give birth in the past 12 months Now married:
55.6% (50)Unmarried:
44.4% (40)
Marital status - Two or more races population 15 years and over
Males 24.7% Never married75.3% Now married0.0% Separated0.0% Widowed0.0% DivorcedFemales 23.8% Never married63.8% Now married0.0% Separated12.5% Widowed0.0% DivorcedWomen who did not give birth in the past 12 months Now married:
100.0% (173)Unmarried:
0.0% (0)
Marital status - White alone, not Hispanic / Latino population 15 years and over
Males 25.8% Never married67.5% Now married0.1% Separated2.1% Widowed4.5% DivorcedFemales 19.6% Never married64.0% Now married0.8% Separated7.8% Widowed7.8% DivorcedWomen who gave birth in the past 12 months Now married:
83.4% (276)Unmarried:
16.6% (55)
Women who did not give birth in the past 12 months Now married:
61.9% (2,605)Unmarried:
38.1% (1,606)
Marital status - Hispanic or Latino population 15 years and over
Males 9.0% Never married91.0% Now married0.0% Separated0.0% Widowed0.0% DivorcedFemales 31.2% Never married68.8% Now married0.0% Separated0.0% Widowed0.0% DivorcedWomen who gave birth in the past 12 months Now married:
0.0% (0)Unmarried:
100.0% (9)
Women who did not give birth in the past 12 months Now married:
74.0% (83)Unmarried:
26.0% (29)
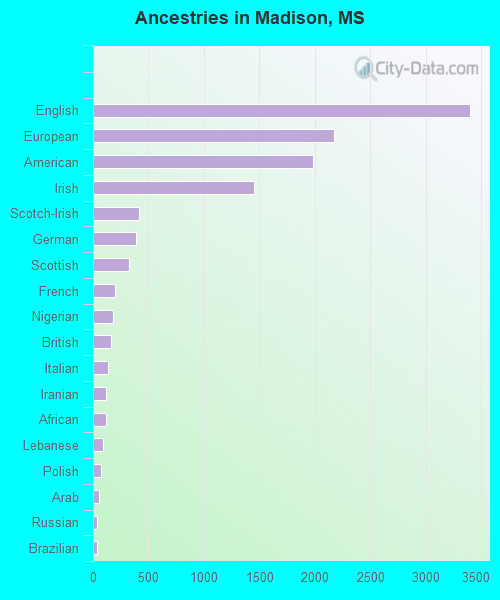
Ancestries in Madison
3,402 19.5% English2,172 12.5% European1,984 11.4% American1,449 8.3% Irish413 2.4% Scotch-Irish384 2.2% German324 1.9% Scottish202 1.2% French182 1.0% Nigerian158 0.9% British136 0.8% Italian120 0.7% Iranian118 0.7% African92 0.5% Lebanese68 0.4% Polish53 0.3% Arab40 0.2% Russian33 0.2% Brazilian30 0.2% Norwegian30 0.2% Scandinavian26 0.1% Welsh25 0.1% Northern European24 0.1% Ghanaian21 0.1% Jordanian21 0.1% French Canadian19 0.1% Dutch17 0.10% Palestinian15 0.09% Cajun13 0.07% Ukrainian11 0.06% South African10 0.06% Swiss9 0.05% Greek8 0.05% Austrian8 0.05% Danish6 0.03% Portuguese2 0.01% West Indian
Geographical mobility in Madison Same house 1 year ago 19,419 93.1% White (Caucasian)3,119 84.1% Black or African American17 99.4% American Indian / Alaska Native1,419 97.9% Asian19 100.0% Native Hawaiian / Pacific Islander186 79.1% Other race1,038 100.0% Two or more races19,949 93.3% White alone, not Hispanic / Latino283 96.1% Hispanic or LatinoMoved within same county 810 3.9% White / Caucasian353 9.5% Black or African American825 3.9% White alone, not Hispanic / LatinoMoved within same state 431 2.1% White / Caucasian153 4.1% Black or African American434 2.0% White alone, not Hispanic / Latino11 3.7% Hispanic or LatinoMoved from different state 153 0.7% White / Caucasian19 0.5% Black or African American29 12.3% Other race154 0.7% White alone, not Hispanic / LatinoMoved from abroad 22 0.1% White70 4.8% Asian22 0.1% White alone, not Hispanic / Latino
Children Nativity (place of birth) in Madison
Children under 6 years - Living with two parents Both parents native 1,516 100.0% NativeBoth parents foreign-born 128 88.4% Native17 11.6% Foreign-bornOne native, one foreign-born parent 112 100.0% NativeChildren under 6 years - Living with one parent Native parent 219 100.0% NativeForeign-born parent 11 100.0% NativeChildren 6 to 17 years - Living with two parents Both parents native 4,051 99.7% Native12 0.3% Foreign-bornBoth parents foreign-born 259 74.7% Native88 25.3% Foreign-bornOne native, one foreign-born parent 217 100.0% NativeChildren 6 to 17 years - Living with one parent Native parent 582 100.0% NativeForeign-born parent 35 46.3% Native41 53.7% Foreign-born
Grandparents responsible for own grandchildren in Madison
Grandparents (30 to 59 years) White / Caucasian 53 100.0% Responsible for grandchildrenBlack or African American 91 100.0% Not responsible for grandchildrenTwo or more races 25 100.0% Responsible for grandchildrenWhite alone, not Hispanic / Latino 53 100.0% Responsible for grandchildrenGrandparents (60 years and over) White / Caucasian 88 59.7% Responsible for grandchildren59 40.3% Not responsible for grandchildrenBlack or African American 75 100.0% Not responsible for grandchildrenWhite alone, not Hispanic / Latino 89 59.6% Responsible for grandchildren60 40.4% Not responsible for grandchildren