Races in Malta, New York (NY) Detailed Stats
Ancestries, Foreign-born residents, place of birth

Recent posts about races in Malta, New York on our local forum with over 2,400,000 registered users:
 | How is Saratoga Springs? (174 replies) |
| Thinking of Moving to the Saratoga Region (11 replies) |
| Good/Bad Parts of Albany? (34 replies) |
| Help fellow upstaters (21 replies) |
| Saratoga Springs is NOT sophisticated (74 replies) |
| Move to Saratoga/Saratoga Springs from LI (43 replies) |
Latest news about races in Malta, NY collected exclusively by city-data.com from local newspapers, TV, and radio stations
3.2% of Malta, NY residents are foreign-born (1.2% born in Europe, 1.1% born in Asia, 0.4% born in Latin America, 0.3% born in North America), which is 586.1% less than the foreign-born rate of 22.0% across the entire state of New York.
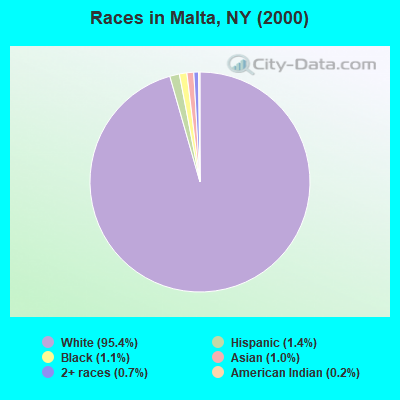
Race distribution in Malta

- 12,40695.4%White alone
- 1881.4%Hispanic
- 1391.1%Black alone
- 1331.0%Asian alone
- 960.7%Two or more races
- 310.2%American Indian alone
- 100.08%Other race alone
- 20.02%Native Hawaiian and Other
Pacific Islander alone
2000
2022
-
- 11,760,98162.0%White alone
- 2,867,58315.1%Hispanic
- 2,812,62314.8%Black alone
- 1,035,9265.5%Asian alone
- 366,1161.9%Two or more races
- 75,4990.4%Other race alone
- 52,4990.3%American Indian alone
- 5,2300.03%Native Hawaiian and Other
Pacific Islander alone

-
- 10,408,93352.9%White alone
- 3,867,29919.7%Hispanic
- 2,633,84013.4%Black alone
- 1,776,2869.0%Asian alone
- 732,6703.7%Two or more races
- 216,1101.1%Other race alone
- 35,0820.2%American Indian alone
- 6,9310.04%Native Hawaiian and Other
Pacific Islander alone

Income and house value in Malta
- Median household income in 2022
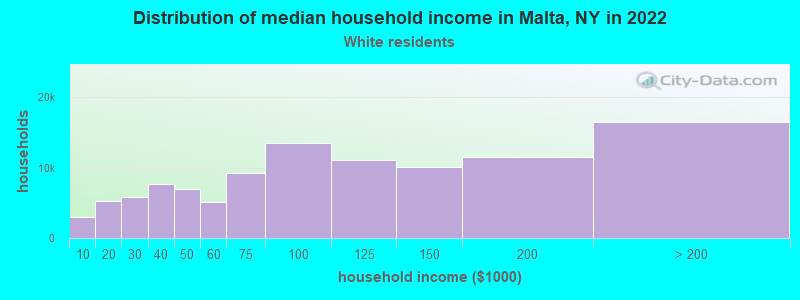
- $106,073White non-Hispanic householders
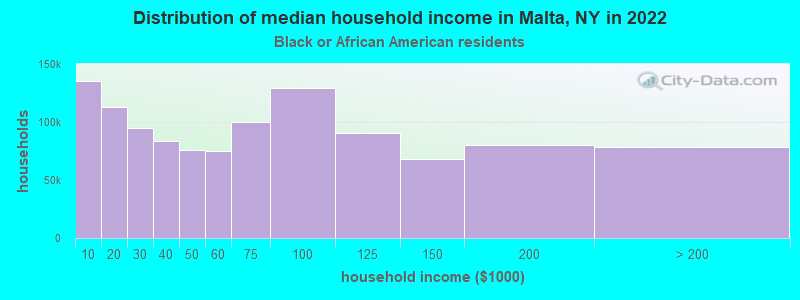
- $136,799Black householders
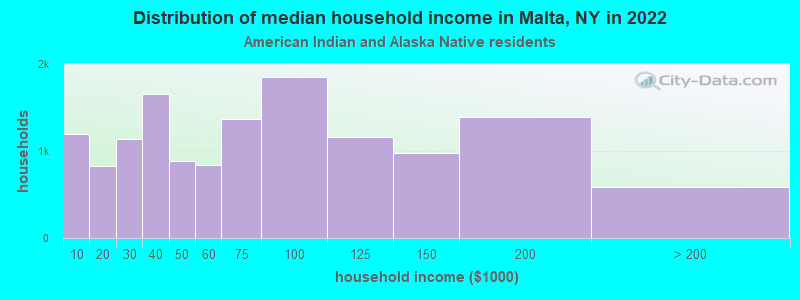
- $40,098American Indian and Alaska Native householders
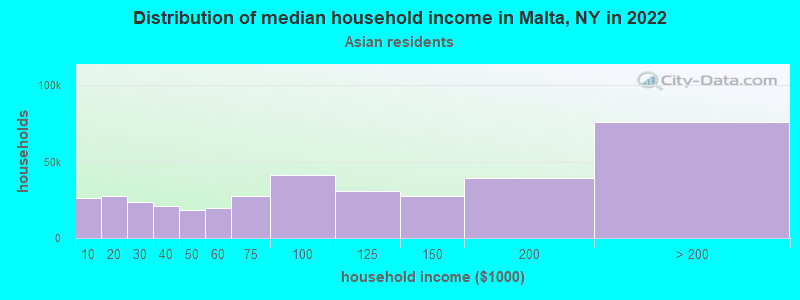
- $156,230Asian householders
- $48,714Some other race householders
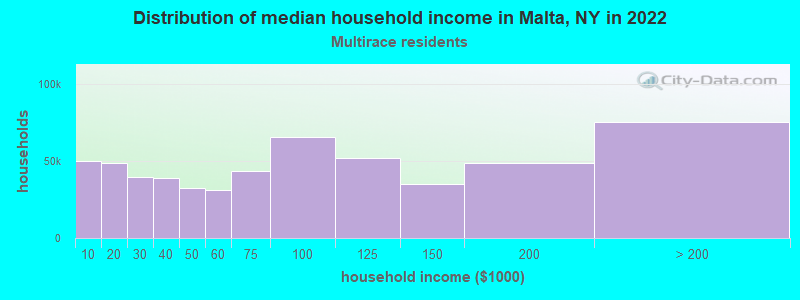
- $149,596Two or more races householders
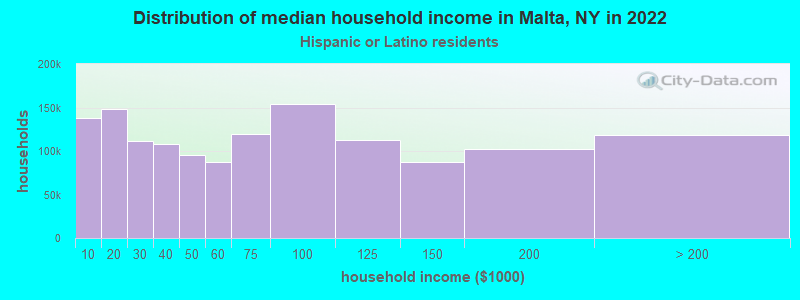
- $91,355Hispanic or Latino race householders
- Median 2022 house value
- $373,597White Non-Hispanic householders
- $321,826Black or African American householders
- $257,340American Indian or Alaska Native householders
- $340,597Asian householders
- $207,083Hispanic or Latino householders
Household income for White non-Hispanic householders
Household income for Black householders
Household income for American Indian and Alaska Native householders
Household income for Asian householders
Household income for Two or more races householders
Household income for Hispanic or Latino race householders
Foreign-born residents in Malta
417 residents are foreign born (1.2% Europe, 1.1% Asia, 0.4% Latin America, 0.3% North America).
| This city: | 3.2% |
| New York: | 20.4% |
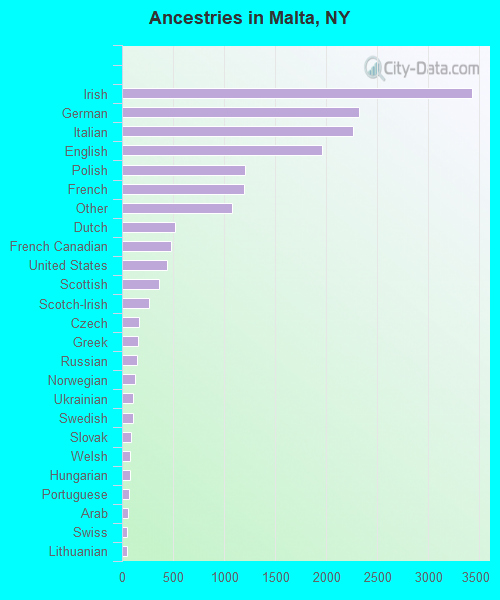
Ancestries in Malta

- 3,42620.3%Irish
- 2,32213.8%German
- 2,26713.4%Italian
- 1,96511.6%English
- 1,2057.1%Polish
- 1,2007.1%French
- 1,0826.4%Other
- 5243.1%Dutch
- 4812.9%French Canadian
- 4392.6%United States
- 3592.1%Scottish
- 2661.6%Scotch-Irish
- 1651.0%Czech
- 1520.9%Greek
- 1440.9%Russian
- 1290.8%Norwegian
- 1090.6%Ukrainian
- 1040.6%Swedish
- 850.5%Slovak
- 780.5%Welsh
- 740.4%Hungarian
- 680.4%Portuguese
- 620.4%Arab
- 530.3%Swiss
- 520.3%Lithuanian
- 510.3%Danish
- 150.09%West Indian
Zip codes: 12118.