Races in Martin, Tennessee (TN) Detailed Stats
Data:
Races - White alone (%)
Races - White alone (% change since 2000)
Races - Black alone (%)
Races - Black alone (% change since 2000)
Races - American Indian alone (%)
Races - American Indian alone (% change since 2000)
Races - Asian alone (%)
Races - Asian alone (% change since 2000)
Races - Hispanic (%)
Races - Hispanic (% change since 2000)
Races - Native Hawaiian and Other Pacific Islander alone (%)
Races - Native Hawaiian and Other Pacific Islander alone (% change since 2000)
Races - Two or more races(%)
Races - Two or more races(% change since 2000)
Races - Other race alone (%)
Races - Other race alone (% change since 2000)
Racial diversity
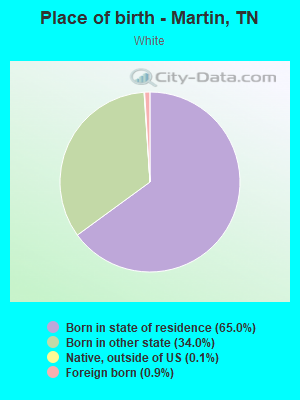
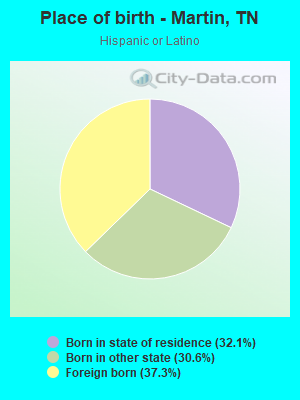
Place of birth - Born in state of residence (%)
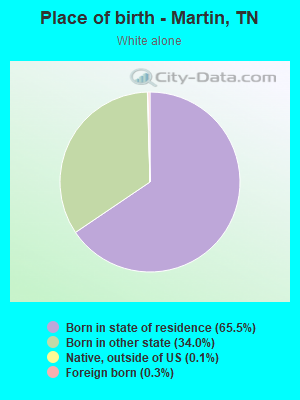
Place of birth - Born in state of residence (%) - White
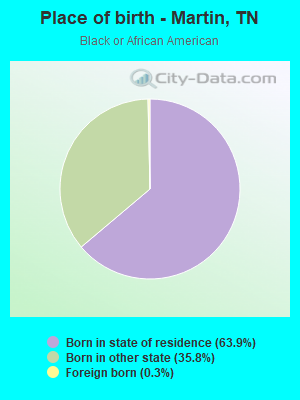
Place of birth - Born in state of residence (%) - Black or African American
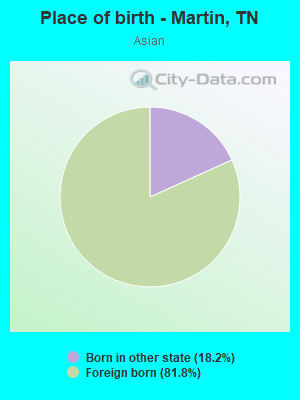
Place of birth - Born in state of residence (%) - Asian
Place of birth - Born in state of residence (%) - Hispanic or Latino
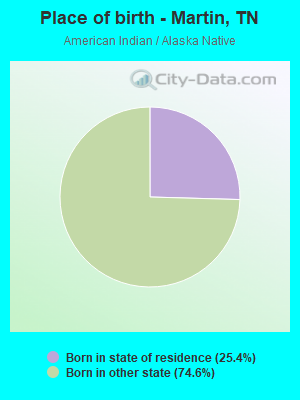
Place of birth - Born in state of residence (%) - American Indian and Alaska Native
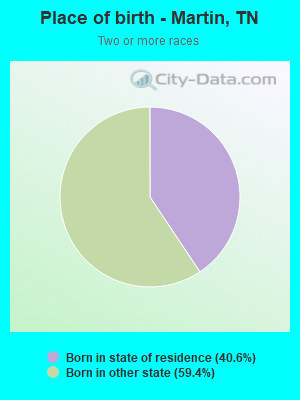
Place of birth - Born in state of residence (%) - Multirace
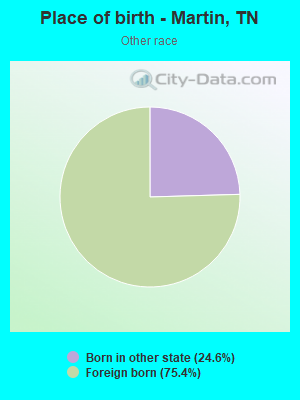
Place of birth - Born in state of residence (%) - Other Race
Place of birth - Born in other state (%)
Place of birth - Born in other state (%) - White
Place of birth - Born in other state (%) - Black or African American
Place of birth - Born in other state (%) - Asian
Place of birth - Born in other state (%) - Hispanic or Latino
Place of birth - Born in other state (%) - American Indian and Alaska Native
Place of birth - Born in other state (%) - Multirace
Place of birth - Born in other state (%) - Other Race
Place of birth - Native, outside of US (%)
Place of birth - Native, outside of US (%) - White
Place of birth - Native, outside of US (%) - Black or African American
Place of birth - Native, outside of US (%) - Asian
Place of birth - Native, outside of US (%) - Hispanic or Latino
Place of birth - Native, outside of US (%) - American Indian and Alaska Native
Place of birth - Native, outside of US (%) - Multirace
Place of birth - Native, outside of US (%) - Other Race
Place of birth - Foreign born (%)
Place of birth - Foreign born (%) - White
Place of birth - Foreign born (%) - Black or African American
Place of birth - Foreign born (%) - Asian
Place of birth - Foreign born (%) - Hispanic or Latino
Place of birth - Foreign born (%) - American Indian and Alaska Native
Place of birth - Foreign born (%) - Multirace
Place of birth - Foreign born (%) - Other Race
Residents speaking English at home (%)
Residents speaking English at home - Born in the United States (%)
Residents speaking English at home - Native, born elsewhere (%)
Residents speaking English at home - Foreign born (%)
Residents speaking Spanish at home (%)
Residents speaking Spanish at home - Born in the United States (%)
Residents speaking Spanish at home - Native, born elsewhere (%)
Residents speaking Spanish at home - Foreign born (%)
Residents speaking other language at home (%)
Residents speaking other language at home - Born in the United States (%)
Residents speaking other language at home - Native, born elsewhere (%)
Residents speaking other language at home - Foreign born (%)
Marital status - Never married (%)
Marital status - Now married (%)
Marital status - Separated (%)
Marital status - Widowed (%)
Marital status - Divorced (%)
Ancestries Reported - Arab (%)
Ancestries Reported - Czech (%)
Ancestries Reported - Danish (%)
Ancestries Reported - Dutch (%)
Ancestries Reported - English (%)
Ancestries Reported - French (%)
Ancestries Reported - French Canadian (%)
Ancestries Reported - German (%)
Ancestries Reported - Greek (%)
Ancestries Reported - Hungarian (%)
Ancestries Reported - Irish (%)
Ancestries Reported - Italian (%)
Ancestries Reported - Lithuanian (%)
Ancestries Reported - Norwegian (%)
Ancestries Reported - Polish (%)
Ancestries Reported - Portuguese (%)
Ancestries Reported - Russian (%)
Ancestries Reported - Scotch-Irish (%)
Ancestries Reported - Scottish (%)
Ancestries Reported - Slovak (%)
Ancestries Reported - Subsaharan African (%)
Ancestries Reported - Swedish (%)
Ancestries Reported - Swiss (%)
Ancestries Reported - Ukrainian (%)
Ancestries Reported - United States (%)
Ancestries Reported - Welsh (%)
Ancestries Reported - West Indian (%)
Ancestries Reported - Other (%)
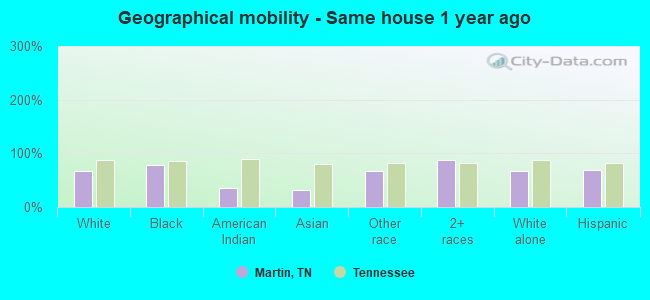
Geographical mobility - Same house 1 year ago (%)
Geographical mobility - Same house 1 year ago (%) - White
Geographical mobility - Same house 1 year ago (%) - Black or African American
Geographical mobility - Same house 1 year ago (%) - Asian
Geographical mobility - Same house 1 year ago (%) - Hispanic or Latino
Geographical mobility - Same house 1 year ago (%) - American Indian and Alaska Native
Geographical mobility - Same house 1 year ago (%) - Multirace
Geographical mobility - Same house 1 year ago (%) - Other Race
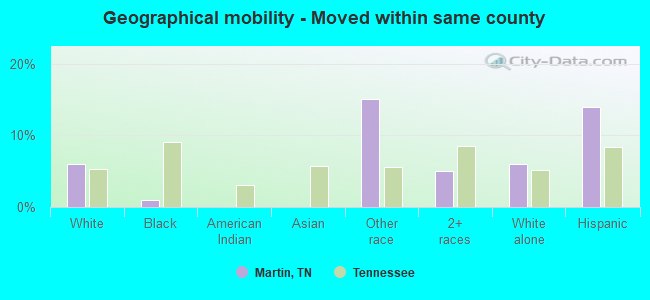
Geographical mobility - Moved within same county (%)
Geographical mobility - Moved within same county (%) - White
Geographical mobility - Moved within same county (%) - Black or African American
Geographical mobility - Moved within same county (%) - Asian
Geographical mobility - Moved within same county (%) - Hispanic or Latino
Geographical mobility - Moved within same county (%) - American Indian and Alaska Native
Geographical mobility - Moved within same county (%) - Multirace
Geographical mobility - Moved within same county (%) - Other Race
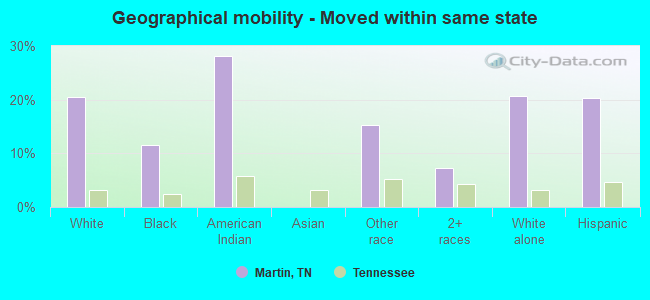
Geographical mobility - Moved from different county within same state (%)
Geographical mobility - Moved from different county within same state (%) - White
Geographical mobility - Moved from different county within same state (%) - Black or African American
Geographical mobility - Moved from different county within same state (%) - Asian
Geographical mobility - Moved from different county within same state (%) - Hispanic or Latino
Geographical mobility - Moved from different county within same state (%) - American Indian and Alaska Native
Geographical mobility - Moved from different county within same state (%) - Multirace
Geographical mobility - Moved from different county within same state (%) - Other Race
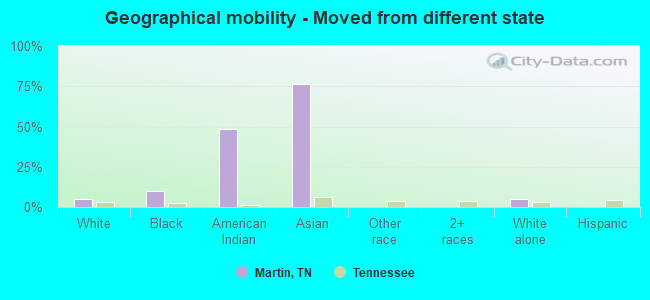
Geographical mobility - Moved from different state (%)
Geographical mobility - Moved from different state (%) - White
Geographical mobility - Moved from different state (%) - Black or African American
Geographical mobility - Moved from different state (%) - Asian
Geographical mobility - Moved from different state (%) - Hispanic or Latino
Geographical mobility - Moved from different state (%) - American Indian and Alaska Native
Geographical mobility - Moved from different state (%) - Multirace
Geographical mobility - Moved from different state (%) - Other Race
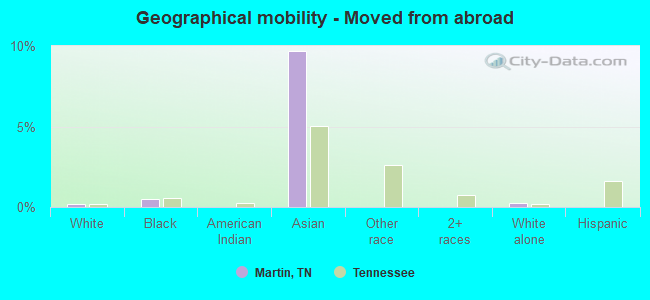
Geographical mobility - Moved from abroad (%)
Geographical mobility - Moved from abroad (%) - White
Geographical mobility - Moved from abroad (%) - Black or African American
Geographical mobility - Moved from abroad (%) - Asian
Geographical mobility - Moved from abroad (%) - Hispanic or Latino
Geographical mobility - Moved from abroad (%) - American Indian and Alaska Native
Geographical mobility - Moved from abroad (%) - Multirace
Geographical mobility - Moved from abroad (%) - Other Race
Place of birth for the foreign-born population - Ireland (%)
Place of birth for the foreign-born population - Denmark (%)
Place of birth for the foreign-born population - Norway (%)
Place of birth for the foreign-born population - Sweden (%)
Place of birth for the foreign-born population - United Kingdom (%)
Place of birth for the foreign-born population - England (%)
Place of birth for the foreign-born population - Scotland (%)
Place of birth for the foreign-born population - Other Northern Europe (%)
Place of birth for the foreign-born population - Austria (%)
Place of birth for the foreign-born population - Belgium (%)
Place of birth for the foreign-born population - France (%)
Place of birth for the foreign-born population - Germany (%)
Place of birth for the foreign-born population - Netherlands (%)
Place of birth for the foreign-born population - Switzerland (%)
Place of birth for the foreign-born population - Other Western Europe (%)
Place of birth for the foreign-born population - Greece (%)
Place of birth for the foreign-born population - Italy (%)
Place of birth for the foreign-born population - Portugal (%)
Place of birth for the foreign-born population - Spain (%)
Place of birth for the foreign-born population - Other Southern Europe (%)
Place of birth for the foreign-born population - Albania (%)
Place of birth for the foreign-born population - Belarus (%)
Place of birth for the foreign-born population - Bosnia and Herzegovina (%)
Place of birth for the foreign-born population - Bulgaria (%)
Place of birth for the foreign-born population - Croatia (%)
Place of birth for the foreign-born population - Czechoslovakia (%)
Place of birth for the foreign-born population - Hungary (%)
Place of birth for the foreign-born population - Latvia (%)
Place of birth for the foreign-born population - Lithuania (%)
Place of birth for the foreign-born population - North Macedonia (Macedonia) (%)
Place of birth for the foreign-born population - Moldova (%)
Place of birth for the foreign-born population - Poland (%)
Place of birth for the foreign-born population - Romania (%)
Place of birth for the foreign-born population - Russia (%)
Place of birth for the foreign-born population - Serbia (%)
Place of birth for the foreign-born population - Ukraine (%)
Place of birth for the foreign-born population - Other Eastern Europe (%)
Place of birth for the foreign-born population - China (%)
Place of birth for the foreign-born population - Hong Kong (%)
Place of birth for the foreign-born population - Taiwan (%)
Place of birth for the foreign-born population - Japan (%)
Place of birth for the foreign-born population - Korea (%)
Place of birth for the foreign-born population - Other Eastern Asia (%)
Place of birth for the foreign-born population - Afghanistan (%)
Place of birth for the foreign-born population - Bangladesh (%)
Place of birth for the foreign-born population - India (%)
Place of birth for the foreign-born population - Iran (%)
Place of birth for the foreign-born population - Kazakhstan (%)
Place of birth for the foreign-born population - Nepal (%)
Place of birth for the foreign-born population - Pakistan (%)
Place of birth for the foreign-born population - Sri Lanka (%)
Place of birth for the foreign-born population - Uzbekistan (%)
Place of birth for the foreign-born population - Other South Central Asia (%)
Place of birth for the foreign-born population - Burma (%)
Place of birth for the foreign-born population - Cambodia (%)
Place of birth for the foreign-born population - Indonesia (%)
Place of birth for the foreign-born population - Laos (%)
Place of birth for the foreign-born population - Malaysia (%)
Place of birth for the foreign-born population - Philippines (%)
Place of birth for the foreign-born population - Singapore (%)
Place of birth for the foreign-born population - Thailand (%)
Place of birth for the foreign-born population - Vietnam (%)
Place of birth for the foreign-born population - Other South Eastern Asia (%)
Place of birth for the foreign-born population - Armenia (%)
Place of birth for the foreign-born population - Iraq (%)
Place of birth for the foreign-born population - Israel (%)
Place of birth for the foreign-born population - Jordan (%)
Place of birth for the foreign-born population - Kuwait (%)
Place of birth for the foreign-born population - Lebanon (%)
Place of birth for the foreign-born population - Saudi Arabia (%)
Place of birth for the foreign-born population - Syria (%)
Place of birth for the foreign-born population - Turkey (%)
Place of birth for the foreign-born population - Yemen (%)
Place of birth for the foreign-born population - Other Western Asia (%)
Place of birth for the foreign-born population - Eritrea (%)
Place of birth for the foreign-born population - Ethiopia (%)
Place of birth for the foreign-born population - Kenya (%)
Place of birth for the foreign-born population - Somalia (%)
Place of birth for the foreign-born population - Uganda (%)
Place of birth for the foreign-born population - Zimbabwe (%)
Place of birth for the foreign-born population - Other Eastern Africa (%)
Place of birth for the foreign-born population - Cameroon (%)
Place of birth for the foreign-born population - Congo (%)
Place of birth for the foreign-born population - Democratic Republic of Congo (Zaire) (%)
Place of birth for the foreign-born population - Other Middle Africa (%)
Place of birth for the foreign-born population - Egypt (%)
Place of birth for the foreign-born population - Morocco (%)
Place of birth for the foreign-born population - Sudan (%)
Place of birth for the foreign-born population - Other Northern Africa (%)
Place of birth for the foreign-born population - South Africa (%)
Place of birth for the foreign-born population - Other Southern Africa (%)
Place of birth for the foreign-born population - Cabo Verde (%)
Place of birth for the foreign-born population - Ghana (%)
Place of birth for the foreign-born population - Liberia (%)
Place of birth for the foreign-born population - Nigeria (%)
Place of birth for the foreign-born population - Senegal (%)
Place of birth for the foreign-born population - Sierra Leone (%)
Place of birth for the foreign-born population - Other Western Africa (%)
Place of birth for the foreign-born population - Australia (%)
Place of birth for the foreign-born population - New Zealand (%)
Place of birth for the foreign-born population - Fiji (%)
Place of birth for the foreign-born population - Micronesia (%)
Place of birth for the foreign-born population - Bahamas (%)
Place of birth for the foreign-born population - Barbados (%)
Place of birth for the foreign-born population - Cuba (%)
Place of birth for the foreign-born population - Dominica (%)
Place of birth for the foreign-born population - Dominican Republic (%)
Place of birth for the foreign-born population - Grenada (%)
Place of birth for the foreign-born population - Haiti (%)
Place of birth for the foreign-born population - Jamaica (%)
Place of birth for the foreign-born population - St. Vincent and the Grenadines (%)
Place of birth for the foreign-born population - Trinidad and Tobago (%)
Place of birth for the foreign-born population - West Indies (%)
Place of birth for the foreign-born population - Other Caribbean (%)
Place of birth for the foreign-born population - Belize (%)
Place of birth for the foreign-born population - Costa Rica (%)
Place of birth for the foreign-born population - El Salvador (%)
Place of birth for the foreign-born population - Guatemala (%)
Place of birth for the foreign-born population - Honduras (%)
Place of birth for the foreign-born population - Mexico (%)
Place of birth for the foreign-born population - Nicaragua (%)
Place of birth for the foreign-born population - Panama (%)
Place of birth for the foreign-born population - Other Central America (%)
Place of birth for the foreign-born population - Argentina (%)
Place of birth for the foreign-born population - Bolivia (%)
Place of birth for the foreign-born population - Brazil (%)
Place of birth for the foreign-born population - Chile (%)
Place of birth for the foreign-born population - Colombia (%)
Place of birth for the foreign-born population - Ecuador (%)
Place of birth for the foreign-born population - Guyana (%)
Place of birth for the foreign-born population - Peru (%)
Place of birth for the foreign-born population - Uruguay (%)
Place of birth for the foreign-born population - Venezuela (%)
Place of birth for the foreign-born population - Other South America (%)
Place of birth for the foreign-born population - Canada (%)
Place of birth for the foreign-born population - Other Northern America (%)
Place of birth for the foreign-born population - Other (%)
Latest news about races in Martin, TN collected exclusively by city-data.com from local newspapers, TV, and radio stations
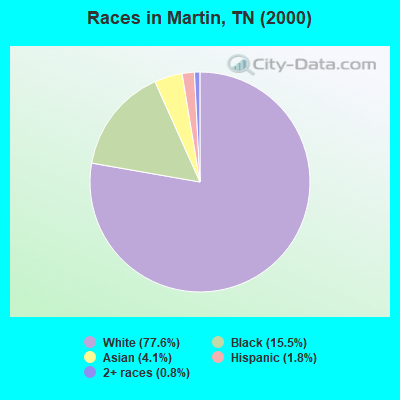
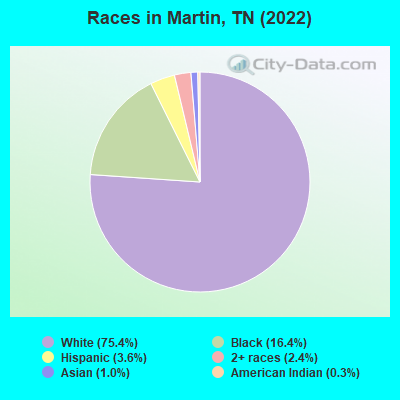
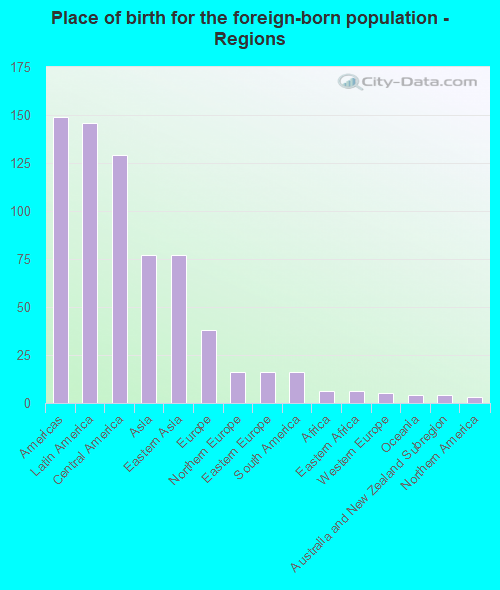
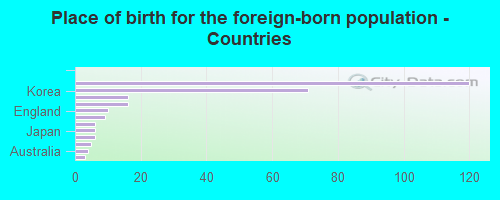
According to 2022 data, the most numerous races in Martin, TN are White alone (8,314 residents), Black alone (1,808 residents), and Hispanic (402 residents). 96.6% of Martin residents speak English at home. 2.5% of Martin, TN residents are foreign-born (1.3% born in Latin America, 0.7% born in Asia, 0.3% born in Europe), which is 100.4% less than the foreign-born rate of 5.0% across the entire state of Tennessee.
Race distribution in Martin
2000 2022
4,505,930 79.2% White alone 928,204 16.3% Black alone 123,838 2.2% Hispanic 54,824 1.0% Two or more races 56,077 1.0% Asian alone 13,820 0.2% American Indian alone 4,780 0.08% Other race alone 1,810 0.03% Native Hawaiian and Other
5,070,026 71.9% White alone 1,089,738 15.5% Black alone 442,629 6.3% Hispanic 279,381 4.0% Two or more races 131,817 1.9% Asian alone 26,972 0.4% Other race alone 6,387 0.09% American Indian alone 4,389 0.06% Native Hawaiian and Other
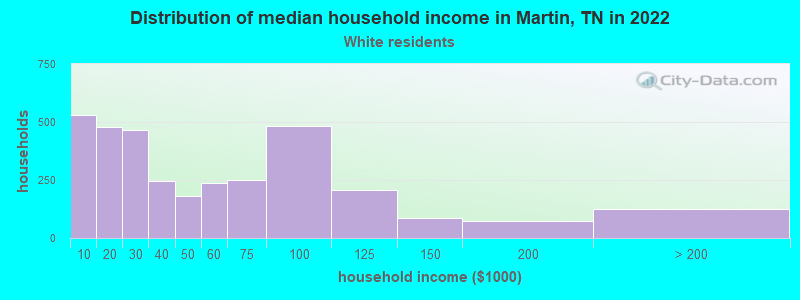
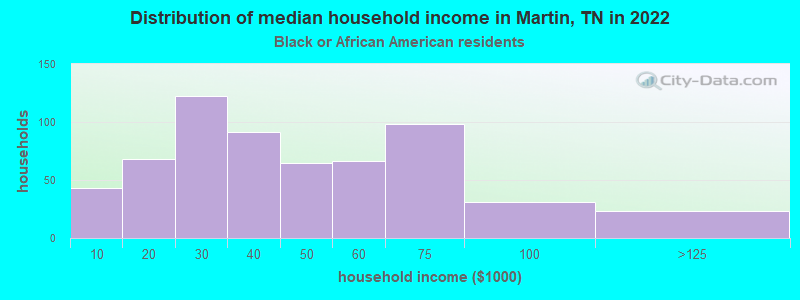
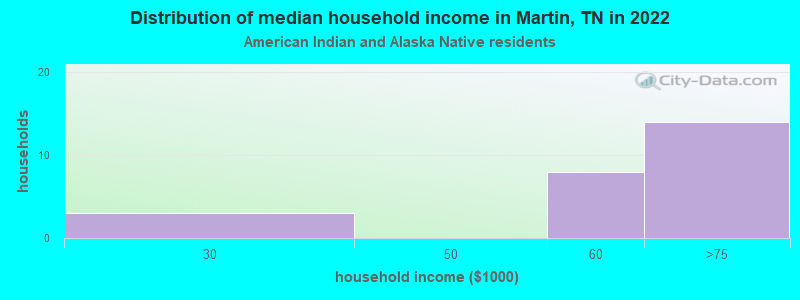
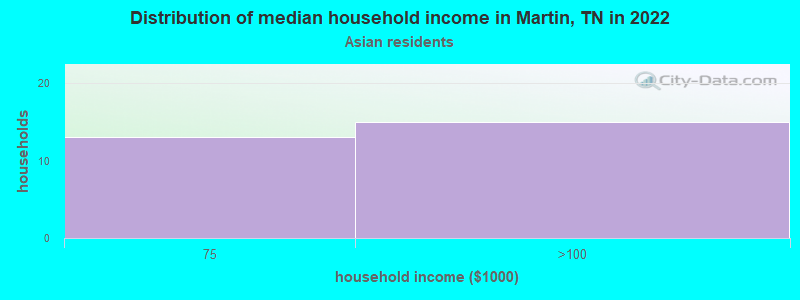
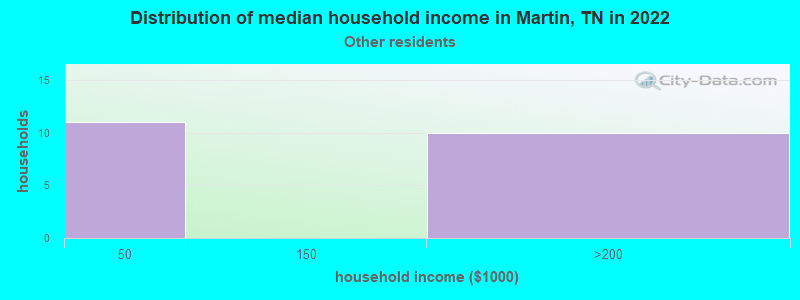
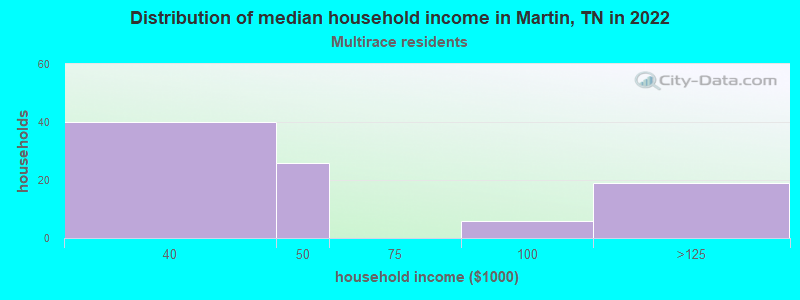
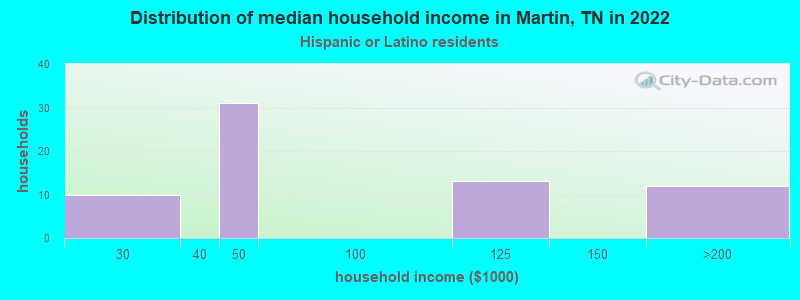
Income and house value in Martin Median household income in 2022 $38,053 White non-Hispanic householders$38,604 Black householders$42,080 Two or more races householdersMedian 2022 house value $200,191 White Non-Hispanic householders$164,381 Black or African American householders $377,504 Asian householders$341,942 Two or more races householders
Median age by race in Martin
25.0 Median age for White residents25.3 24.3 23.3 Median age for Black or African American residents21.4 26.9 27.5 Median age for American Indian / Alaska Native residents-633,911,367.4 25.1 20.6 Median age for Asian residents45.3 19.7 -885,813,147.9 Median age for Native Hawaiian / Pacific Islander residents-951,707,890.7 -735,930,735.2 38.5 Median age for Other race residents36.6 -745,428,972.5 40.4 Median age for Two or more races residents47.4 28.1 24.7 Median age for White alone residents25.2 24.2 25.5 Median age for Hispanic or Latino residents25.6 25.1
Owner/renter occupied households by race in Martin
House owners and renters - White residents 1,619 48.0% Owner occupied1,755 52.0% Renter occupiedHouse owners and renters - Black or African American residents 127 20.4% Owner occupied496 79.6% Renter occupiedHouse owners and renters - American Indian / Alaska Native residents 14 100.0% Renter occupiedHouse owners and renters - Asian residents 23 70.2% Owner occupied10 29.8% Renter occupiedHouse owners and renters - Other race residents 12 53.2% Owner occupied11 46.8% Renter occupiedHouse owners and renters - Two or more races residents 24 26.3% Owner occupied67 73.7% Renter occupiedHouse owners and renters - White alone residents 1,626 48.1% Owner occupied1,757 51.9% Renter occupiedHouse owners and renters - Hispanic or Latino residents 23 30.1% Owner occupied53 69.9% Renter occupied
Language usage in Martin
English speakers - Total 96.6% of residents of Martin speak English at home.
1.4% of residents speak Spanish at home 75 50.3% Speak English very well74 49.7% Speak English less than very well1.7% of residents speak other language at home 72 40.2% Speak English very well107 59.8% Speak English less than very well
English speakers - Born in the United States 98.4% of residents of Martin speak English at home.
1.1% of residents speak Spanish at home 34 82.9% Speak English very well7 17.1% Speak English less than very well0.5% of residents speak other language at home 19 100.0% Speak English very well
All residents speak only English at home
English speakers - Foreign-born 41.5% of residents of Martin speak English at home.
25.1% of residents speak Spanish at home 25 36.2% Speak English very well44 63.8% Speak English less than very well31.6% of residents speak other language at home 53 60.9% Speak English very well34 39.1% Speak English less than very well
White (Caucasian) - Speak only English Native:
99.1% (7,890)Foreign-born:
99.6% (80)
White (Caucasian) - Speak another language Native:
1.0% (82)Foreign-born:
17.5% (14)
Black or African American - Speak another language Native:
1.2% (21)Foreign-born:
97.2% (6)
Asian - Speak only English Native:
97.6% (20)Foreign-born:
17.6% (16)
Other race - Speak only English Native:
62.8% (12)Foreign-born:
10.5% (7)
Other race - Speak another language Native:
38.5% (7)Foreign-born:
87.5% (57)
White alone - Speak only English Native:
98.9% (7,776)Foreign-born:
79.4% (23)
White alone - Speak another language Native:
1.1% (84)Foreign-born:
18.3% (5)
Hispanic or Latino - Speak only English Native:
85.9% (183)Foreign-born:
48.2% (72)
Hispanic or Latino - Speak another language Native:
17.0% (36)Foreign-born:
47.5% (71)
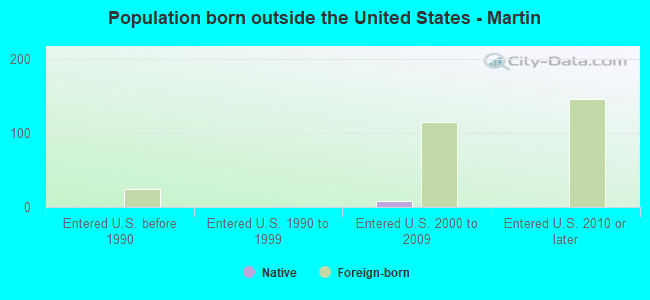
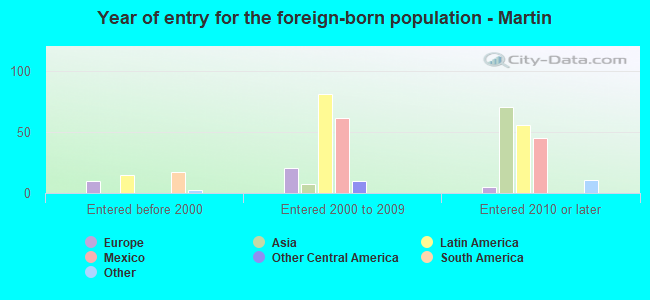
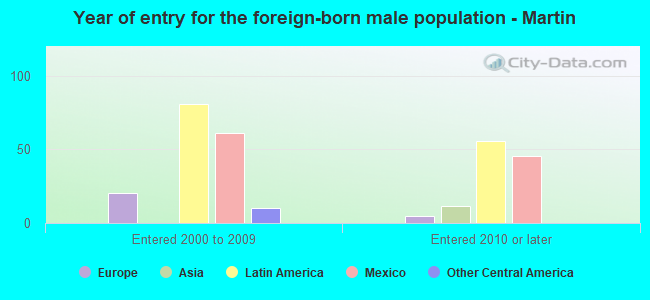
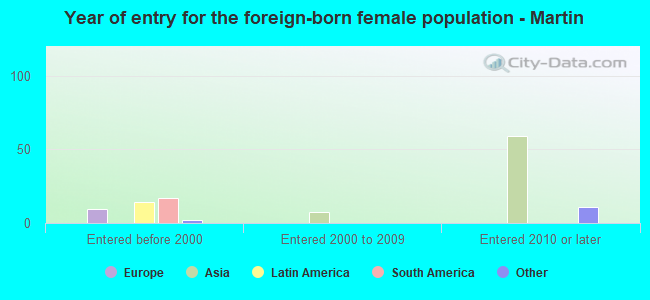
Foreign-born residents in Martin 275 residents are foreign born (1.3% Latin America , 0.7% Asia , 0.3% Europe ).
This city:
2.5%Tennessee:
5.4%
Marital status for residents in Martin Marital status - White (Caucasian) population 15 years and over
Males 58.0% Never married33.6% Now married0.5% Separated2.0% Widowed6.0% DivorcedFemales 44.9% Never married34.7% Now married0.5% Separated11.2% Widowed8.6% DivorcedWomen who gave birth in the past 12 months Now married:
93.5% (115)Unmarried:
6.5% (8)
Women who did not give birth in the past 12 months Now married:
32.3% (748)Unmarried:
67.7% (1,565)
Marital status - Black or African American population 15 years and over
Males 69.3% Never married19.4% Now married6.3% Separated0.0% Widowed4.9% DivorcedFemales 64.8% Never married25.8% Now married0.0% Separated5.1% Widowed4.4% DivorcedWomen who gave birth in the past 12 months Now married:
42.6% (39)Unmarried:
57.4% (52)
Women who did not give birth in the past 12 months Now married:
11.5% (63)Unmarried:
88.5% (485)
Marital status - American Indian / Alaska Native population 15 years and over
Males 0.0% Never married46.7% Now married0.0% Separated53.3% Widowed0.0% DivorcedFemales 53.3% Never married23.3% Now married0.0% Separated0.0% Widowed23.3% DivorcedWomen who did not give birth in the past 12 months Now married:
30.4% (8)Unmarried:
69.6% (19)
Marital status - Asian population 15 years and over
Males 34.8% Never married23.9% Now married0.0% Separated0.0% Widowed41.3% DivorcedFemales 43.8% Never married56.3% Now married0.0% Separated0.0% Widowed0.0% DivorcedWomen who did not give birth in the past 12 months Now married:
56.2% (19)Unmarried:
43.8% (15)
Marital status - Other race population 15 years and over
Males 69.2% Never married0.0% Now married30.8% Separated0.0% Widowed0.0% DivorcedFemales 100.0% Never married0.0% Now married0.0% Separated0.0% Widowed0.0% DivorcedWomen who did not give birth in the past 12 months Now married:
0.0% (0)Unmarried:
100.0% (11)
Marital status - Two or more races population 15 years and over
Males 36.6% Never married63.4% Now married0.0% Separated0.0% Widowed0.0% DivorcedFemales 50.6% Never married49.4% Now married0.0% Separated0.0% Widowed0.0% DivorcedWomen who did not give birth in the past 12 months Now married:
45.8% (49)Unmarried:
54.2% (58)
Marital status - White alone, not Hispanic / Latino population 15 years and over
Males 56.9% Never married34.4% Now married0.5% Separated2.0% Widowed6.1% DivorcedFemales 45.1% Never married34.4% Now married0.6% Separated11.5% Widowed8.5% DivorcedWomen who gave birth in the past 12 months Now married:
100.0% (91)Unmarried:
0.0% (0)
Women who did not give birth in the past 12 months Now married:
32.9% (761)Unmarried:
67.1% (1,552)
Marital status - Hispanic or Latino population 15 years and over
Males 81.1% Never married8.7% Now married10.2% Separated0.0% Widowed0.0% DivorcedFemales 40.4% Never married48.6% Now married0.0% Separated0.0% Widowed11.0% DivorcedWomen who gave birth in the past 12 months Now married:
76.5% (29)Unmarried:
23.5% (9)
Women who did not give birth in the past 12 months Now married:
18.6% (12)Unmarried:
81.4% (54)
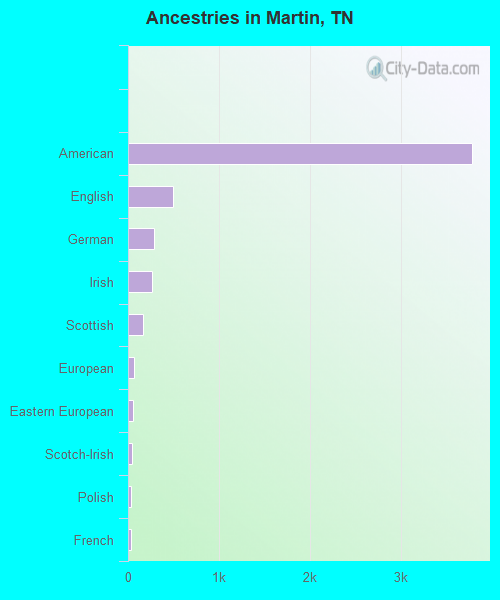
Ancestries in Martin
3,781 53.3% American492 6.9% English284 4.0% German266 3.7% Irish161 2.3% Scottish70 1.0% European50 0.7% Eastern European41 0.6% Scotch-Irish37 0.5% Polish36 0.5% French20 0.3% Nigerian19 0.3% British18 0.3% Cajun18 0.3% Welsh15 0.2% Italian13 0.2% Turkish11 0.2% Norwegian10 0.1% New Zealander8 0.1% Dutch6 0.08% Australian5 0.07% Hungarian3 0.04% African
Geographical mobility in Martin Same house 1 year ago 5,563 66.7% White (Caucasian)1,389 77.5% Black or African American18 36.3% American Indian / Alaska Native36 31.2% Asian58 66.9% Other race279 88.3% Two or more races5,457 66.4% White alone, not Hispanic / Latino258 69.0% Hispanic or LatinoMoved within same county 505 6.1% White / Caucasian17 1.0% Black or African American13 15.1% Other race16 5.0% Two or more races493 6.0% White alone, not Hispanic / Latino52 13.9% Hispanic or LatinoMoved within same state 1,716 20.6% White / Caucasian209 11.6% Black or African American14 28.1% American Indian / Alaska Native13 15.4% Other race23 7.2% Two or more races1,703 20.7% White alone, not Hispanic / Latino76 20.4% Hispanic or LatinoMoved from different state 422 5.1% White / Caucasian182 10.1% Black or African American24 48.6% American Indian / Alaska Native87 76.5% Asian429 5.2% White alone, not Hispanic / LatinoMoved from abroad 15 0.2% White9 0.5% Black or African American11 9.7% Asian18 0.2% White alone, not Hispanic / Latino
Children Nativity (place of birth) in Martin
Children under 6 years - Living with two parents Both parents native 529 100.0% NativeChildren under 6 years - Living with one parent Native parent 229 100.0% Native
Children 6 to 17 years - Living with two parents Both parents native 427 100.0% NativeBoth parents foreign-born 41 100.0% Foreign-bornChildren 6 to 17 years - Living with one parent Native parent 379 100.0% Native
Grandparents responsible for own grandchildren in Martin
Grandparents (30 to 59 years) White / Caucasian 35 78.1% Responsible for grandchildren10 21.9% Not responsible for grandchildrenBlack or African American 6 100.0% Responsible for grandchildrenWhite alone, not Hispanic / Latino 35 77.7% Responsible for grandchildren10 22.3% Not responsible for grandchildren
Grandparents (60 years and over) White / Caucasian 13 100.0% Responsible for grandchildrenBlack or African American 2 100.0% Not responsible for grandchildrenWhite alone, not Hispanic / Latino 14 100.0% Responsible for grandchildren