Races in Mason City, Iowa (IA) Detailed Stats
Data:
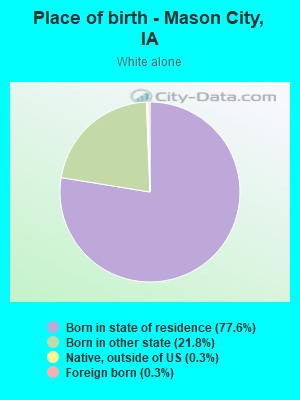
Races - White alone (%)
Races - White alone (% change since 2000)
Races - Black alone (%)
Races - Black alone (% change since 2000)
Races - American Indian alone (%)
Races - American Indian alone (% change since 2000)
Races - Asian alone (%)
Races - Asian alone (% change since 2000)
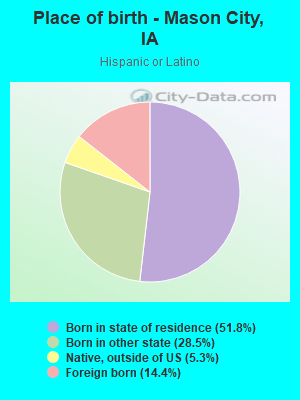
Races - Hispanic (%)
Races - Hispanic (% change since 2000)
Races - Native Hawaiian and Other Pacific Islander alone (%)
Races - Native Hawaiian and Other Pacific Islander alone (% change since 2000)
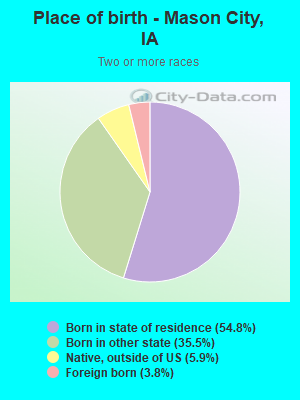
Races - Two or more races(%)
Races - Two or more races(% change since 2000)
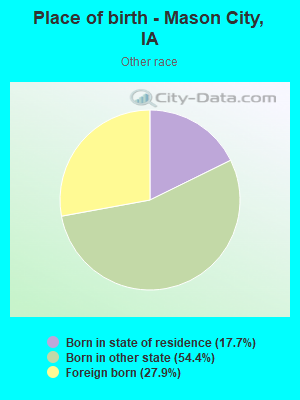
Races - Other race alone (%)
Races - Other race alone (% change since 2000)
Racial diversity
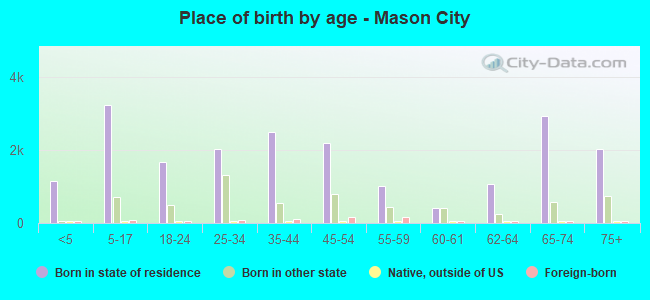
Place of birth - Born in state of residence (%)
Place of birth - Born in state of residence (%) - White
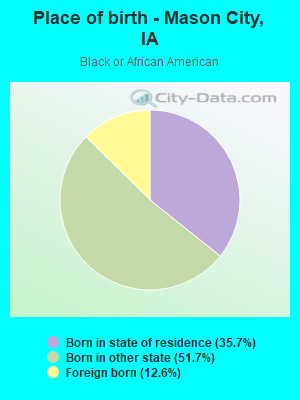
Place of birth - Born in state of residence (%) - Black or African American
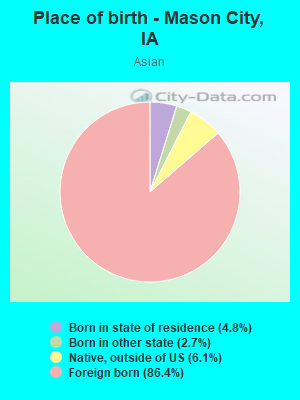
Place of birth - Born in state of residence (%) - Asian
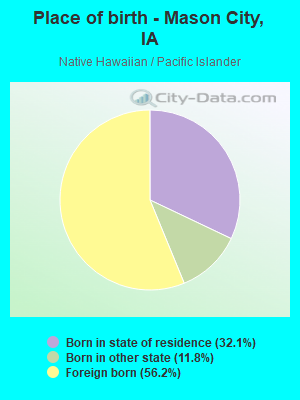
Place of birth - Born in state of residence (%) - Hispanic or Latino
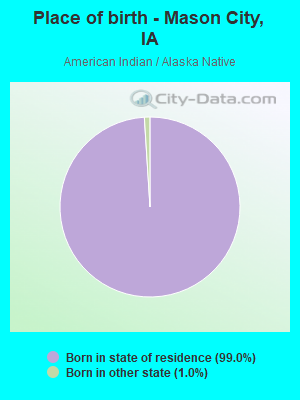
Place of birth - Born in state of residence (%) - American Indian and Alaska Native
Place of birth - Born in state of residence (%) - Multirace
Place of birth - Born in state of residence (%) - Other Race
Place of birth - Born in other state (%)
Place of birth - Born in other state (%) - White
Place of birth - Born in other state (%) - Black or African American
Place of birth - Born in other state (%) - Asian
Place of birth - Born in other state (%) - Hispanic or Latino
Place of birth - Born in other state (%) - American Indian and Alaska Native
Place of birth - Born in other state (%) - Multirace
Place of birth - Born in other state (%) - Other Race
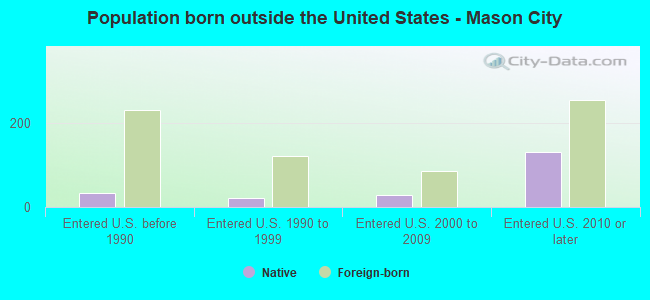
Place of birth - Native, outside of US (%)
Place of birth - Native, outside of US (%) - White
Place of birth - Native, outside of US (%) - Black or African American
Place of birth - Native, outside of US (%) - Asian
Place of birth - Native, outside of US (%) - Hispanic or Latino
Place of birth - Native, outside of US (%) - American Indian and Alaska Native
Place of birth - Native, outside of US (%) - Multirace
Place of birth - Native, outside of US (%) - Other Race
Place of birth - Foreign born (%)
Place of birth - Foreign born (%) - White
Place of birth - Foreign born (%) - Black or African American
Place of birth - Foreign born (%) - Asian
Place of birth - Foreign born (%) - Hispanic or Latino
Place of birth - Foreign born (%) - American Indian and Alaska Native
Place of birth - Foreign born (%) - Multirace
Place of birth - Foreign born (%) - Other Race
Residents speaking English at home (%)
Residents speaking English at home - Born in the United States (%)
Residents speaking English at home - Native, born elsewhere (%)
Residents speaking English at home - Foreign born (%)
Residents speaking Spanish at home (%)
Residents speaking Spanish at home - Born in the United States (%)
Residents speaking Spanish at home - Native, born elsewhere (%)
Residents speaking Spanish at home - Foreign born (%)
Residents speaking other language at home (%)
Residents speaking other language at home - Born in the United States (%)
Residents speaking other language at home - Native, born elsewhere (%)
Residents speaking other language at home - Foreign born (%)
Marital status - Never married (%)
Marital status - Now married (%)
Marital status - Separated (%)
Marital status - Widowed (%)
Marital status - Divorced (%)
Ancestries Reported - Arab (%)
Ancestries Reported - Czech (%)
Ancestries Reported - Danish (%)
Ancestries Reported - Dutch (%)
Ancestries Reported - English (%)
Ancestries Reported - French (%)
Ancestries Reported - French Canadian (%)
Ancestries Reported - German (%)
Ancestries Reported - Greek (%)
Ancestries Reported - Hungarian (%)
Ancestries Reported - Irish (%)
Ancestries Reported - Italian (%)
Ancestries Reported - Lithuanian (%)
Ancestries Reported - Norwegian (%)
Ancestries Reported - Polish (%)
Ancestries Reported - Portuguese (%)
Ancestries Reported - Russian (%)
Ancestries Reported - Scotch-Irish (%)
Ancestries Reported - Scottish (%)
Ancestries Reported - Slovak (%)
Ancestries Reported - Subsaharan African (%)
Ancestries Reported - Swedish (%)
Ancestries Reported - Swiss (%)
Ancestries Reported - Ukrainian (%)
Ancestries Reported - United States (%)
Ancestries Reported - Welsh (%)
Ancestries Reported - West Indian (%)
Ancestries Reported - Other (%)
Geographical mobility - Same house 1 year ago (%)
Geographical mobility - Same house 1 year ago (%) - White
Geographical mobility - Same house 1 year ago (%) - Black or African American
Geographical mobility - Same house 1 year ago (%) - Asian
Geographical mobility - Same house 1 year ago (%) - Hispanic or Latino
Geographical mobility - Same house 1 year ago (%) - American Indian and Alaska Native
Geographical mobility - Same house 1 year ago (%) - Multirace
Geographical mobility - Same house 1 year ago (%) - Other Race
Geographical mobility - Moved within same county (%)
Geographical mobility - Moved within same county (%) - White
Geographical mobility - Moved within same county (%) - Black or African American
Geographical mobility - Moved within same county (%) - Asian
Geographical mobility - Moved within same county (%) - Hispanic or Latino
Geographical mobility - Moved within same county (%) - American Indian and Alaska Native
Geographical mobility - Moved within same county (%) - Multirace
Geographical mobility - Moved within same county (%) - Other Race
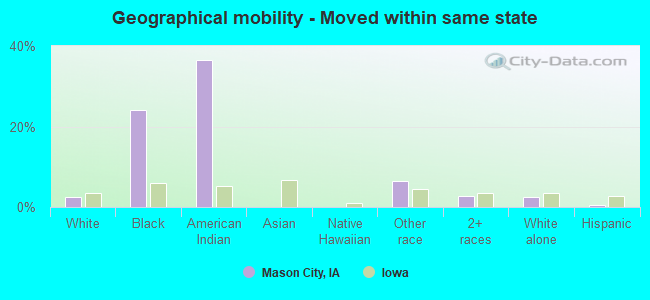
Geographical mobility - Moved from different county within same state (%)
Geographical mobility - Moved from different county within same state (%) - White
Geographical mobility - Moved from different county within same state (%) - Black or African American
Geographical mobility - Moved from different county within same state (%) - Asian
Geographical mobility - Moved from different county within same state (%) - Hispanic or Latino
Geographical mobility - Moved from different county within same state (%) - American Indian and Alaska Native
Geographical mobility - Moved from different county within same state (%) - Multirace
Geographical mobility - Moved from different county within same state (%) - Other Race
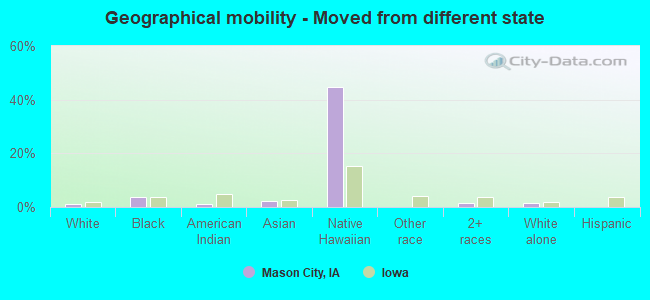
Geographical mobility - Moved from different state (%)
Geographical mobility - Moved from different state (%) - White
Geographical mobility - Moved from different state (%) - Black or African American
Geographical mobility - Moved from different state (%) - Asian
Geographical mobility - Moved from different state (%) - Hispanic or Latino
Geographical mobility - Moved from different state (%) - American Indian and Alaska Native
Geographical mobility - Moved from different state (%) - Multirace
Geographical mobility - Moved from different state (%) - Other Race
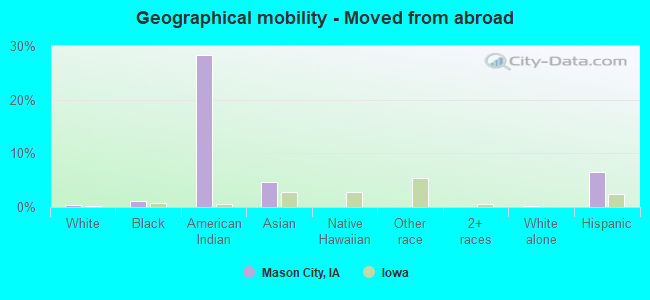
Geographical mobility - Moved from abroad (%)
Geographical mobility - Moved from abroad (%) - White
Geographical mobility - Moved from abroad (%) - Black or African American
Geographical mobility - Moved from abroad (%) - Asian
Geographical mobility - Moved from abroad (%) - Hispanic or Latino
Geographical mobility - Moved from abroad (%) - American Indian and Alaska Native
Geographical mobility - Moved from abroad (%) - Multirace
Geographical mobility - Moved from abroad (%) - Other Race
Place of birth for the foreign-born population - Ireland (%)
Place of birth for the foreign-born population - Denmark (%)
Place of birth for the foreign-born population - Norway (%)
Place of birth for the foreign-born population - Sweden (%)
Place of birth for the foreign-born population - United Kingdom (%)
Place of birth for the foreign-born population - England (%)
Place of birth for the foreign-born population - Scotland (%)
Place of birth for the foreign-born population - Other Northern Europe (%)
Place of birth for the foreign-born population - Austria (%)
Place of birth for the foreign-born population - Belgium (%)
Place of birth for the foreign-born population - France (%)
Place of birth for the foreign-born population - Germany (%)
Place of birth for the foreign-born population - Netherlands (%)
Place of birth for the foreign-born population - Switzerland (%)
Place of birth for the foreign-born population - Other Western Europe (%)
Place of birth for the foreign-born population - Greece (%)
Place of birth for the foreign-born population - Italy (%)
Place of birth for the foreign-born population - Portugal (%)
Place of birth for the foreign-born population - Spain (%)
Place of birth for the foreign-born population - Other Southern Europe (%)
Place of birth for the foreign-born population - Albania (%)
Place of birth for the foreign-born population - Belarus (%)
Place of birth for the foreign-born population - Bosnia and Herzegovina (%)
Place of birth for the foreign-born population - Bulgaria (%)
Place of birth for the foreign-born population - Croatia (%)
Place of birth for the foreign-born population - Czechoslovakia (%)
Place of birth for the foreign-born population - Hungary (%)
Place of birth for the foreign-born population - Latvia (%)
Place of birth for the foreign-born population - Lithuania (%)
Place of birth for the foreign-born population - North Macedonia (Macedonia) (%)
Place of birth for the foreign-born population - Moldova (%)
Place of birth for the foreign-born population - Poland (%)
Place of birth for the foreign-born population - Romania (%)
Place of birth for the foreign-born population - Russia (%)
Place of birth for the foreign-born population - Serbia (%)
Place of birth for the foreign-born population - Ukraine (%)
Place of birth for the foreign-born population - Other Eastern Europe (%)
Place of birth for the foreign-born population - China (%)
Place of birth for the foreign-born population - Hong Kong (%)
Place of birth for the foreign-born population - Taiwan (%)
Place of birth for the foreign-born population - Japan (%)
Place of birth for the foreign-born population - Korea (%)
Place of birth for the foreign-born population - Other Eastern Asia (%)
Place of birth for the foreign-born population - Afghanistan (%)
Place of birth for the foreign-born population - Bangladesh (%)
Place of birth for the foreign-born population - India (%)
Place of birth for the foreign-born population - Iran (%)
Place of birth for the foreign-born population - Kazakhstan (%)
Place of birth for the foreign-born population - Nepal (%)
Place of birth for the foreign-born population - Pakistan (%)
Place of birth for the foreign-born population - Sri Lanka (%)
Place of birth for the foreign-born population - Uzbekistan (%)
Place of birth for the foreign-born population - Other South Central Asia (%)
Place of birth for the foreign-born population - Burma (%)
Place of birth for the foreign-born population - Cambodia (%)
Place of birth for the foreign-born population - Indonesia (%)
Place of birth for the foreign-born population - Laos (%)
Place of birth for the foreign-born population - Malaysia (%)
Place of birth for the foreign-born population - Philippines (%)
Place of birth for the foreign-born population - Singapore (%)
Place of birth for the foreign-born population - Thailand (%)
Place of birth for the foreign-born population - Vietnam (%)
Place of birth for the foreign-born population - Other South Eastern Asia (%)
Place of birth for the foreign-born population - Armenia (%)
Place of birth for the foreign-born population - Iraq (%)
Place of birth for the foreign-born population - Israel (%)
Place of birth for the foreign-born population - Jordan (%)
Place of birth for the foreign-born population - Kuwait (%)
Place of birth for the foreign-born population - Lebanon (%)
Place of birth for the foreign-born population - Saudi Arabia (%)
Place of birth for the foreign-born population - Syria (%)
Place of birth for the foreign-born population - Turkey (%)
Place of birth for the foreign-born population - Yemen (%)
Place of birth for the foreign-born population - Other Western Asia (%)
Place of birth for the foreign-born population - Eritrea (%)
Place of birth for the foreign-born population - Ethiopia (%)
Place of birth for the foreign-born population - Kenya (%)
Place of birth for the foreign-born population - Somalia (%)
Place of birth for the foreign-born population - Uganda (%)
Place of birth for the foreign-born population - Zimbabwe (%)
Place of birth for the foreign-born population - Other Eastern Africa (%)
Place of birth for the foreign-born population - Cameroon (%)
Place of birth for the foreign-born population - Congo (%)
Place of birth for the foreign-born population - Democratic Republic of Congo (Zaire) (%)
Place of birth for the foreign-born population - Other Middle Africa (%)
Place of birth for the foreign-born population - Egypt (%)
Place of birth for the foreign-born population - Morocco (%)
Place of birth for the foreign-born population - Sudan (%)
Place of birth for the foreign-born population - Other Northern Africa (%)
Place of birth for the foreign-born population - South Africa (%)
Place of birth for the foreign-born population - Other Southern Africa (%)
Place of birth for the foreign-born population - Cabo Verde (%)
Place of birth for the foreign-born population - Ghana (%)
Place of birth for the foreign-born population - Liberia (%)
Place of birth for the foreign-born population - Nigeria (%)
Place of birth for the foreign-born population - Senegal (%)
Place of birth for the foreign-born population - Sierra Leone (%)
Place of birth for the foreign-born population - Other Western Africa (%)
Place of birth for the foreign-born population - Australia (%)
Place of birth for the foreign-born population - New Zealand (%)
Place of birth for the foreign-born population - Fiji (%)
Place of birth for the foreign-born population - Micronesia (%)
Place of birth for the foreign-born population - Bahamas (%)
Place of birth for the foreign-born population - Barbados (%)
Place of birth for the foreign-born population - Cuba (%)
Place of birth for the foreign-born population - Dominica (%)
Place of birth for the foreign-born population - Dominican Republic (%)
Place of birth for the foreign-born population - Grenada (%)
Place of birth for the foreign-born population - Haiti (%)
Place of birth for the foreign-born population - Jamaica (%)
Place of birth for the foreign-born population - St. Vincent and the Grenadines (%)
Place of birth for the foreign-born population - Trinidad and Tobago (%)
Place of birth for the foreign-born population - West Indies (%)
Place of birth for the foreign-born population - Other Caribbean (%)
Place of birth for the foreign-born population - Belize (%)
Place of birth for the foreign-born population - Costa Rica (%)
Place of birth for the foreign-born population - El Salvador (%)
Place of birth for the foreign-born population - Guatemala (%)
Place of birth for the foreign-born population - Honduras (%)
Place of birth for the foreign-born population - Mexico (%)
Place of birth for the foreign-born population - Nicaragua (%)
Place of birth for the foreign-born population - Panama (%)
Place of birth for the foreign-born population - Other Central America (%)
Place of birth for the foreign-born population - Argentina (%)
Place of birth for the foreign-born population - Bolivia (%)
Place of birth for the foreign-born population - Brazil (%)
Place of birth for the foreign-born population - Chile (%)
Place of birth for the foreign-born population - Colombia (%)
Place of birth for the foreign-born population - Ecuador (%)
Place of birth for the foreign-born population - Guyana (%)
Place of birth for the foreign-born population - Peru (%)
Place of birth for the foreign-born population - Uruguay (%)
Place of birth for the foreign-born population - Venezuela (%)
Place of birth for the foreign-born population - Other South America (%)
Place of birth for the foreign-born population - Canada (%)
Place of birth for the foreign-born population - Other Northern America (%)
Place of birth for the foreign-born population - Other (%)
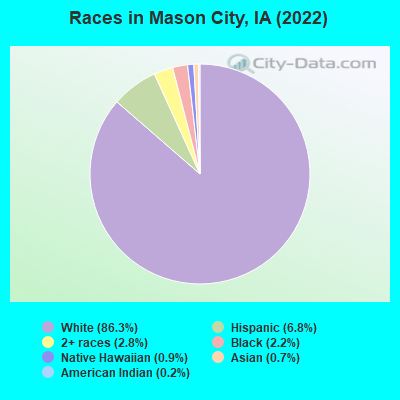
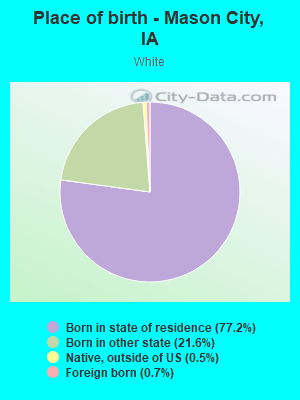
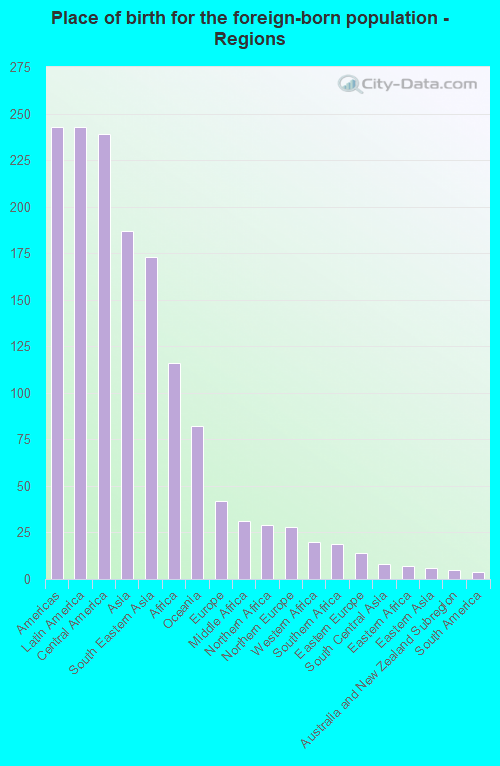
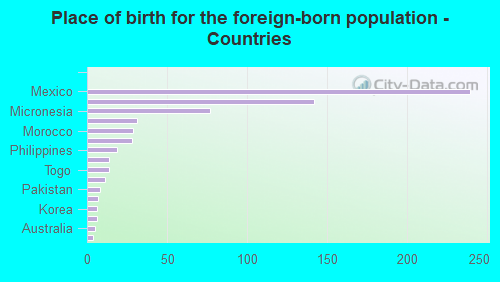
According to 2022 data, the most numerous races in Mason City, IA are White alone (23,626 residents), Hispanic (1,874 residents), and Black alone (598 residents). 95.7% of Mason City residents speak English at home. 2.5% of Mason City, IA residents are foreign-born (0.9% born in Latin America, 0.7% born in Asia, 0.4% born in Africa, 0.3% born in Oceania), which is 103.4% less than the foreign-born rate of 5.0% across the entire state of Iowa.
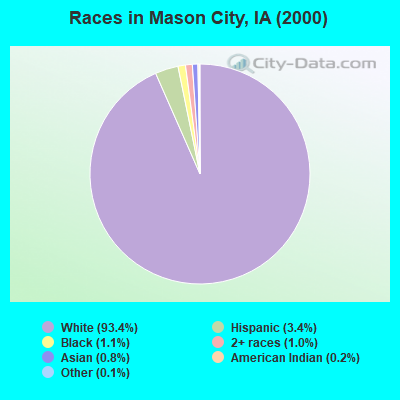
Race distribution in Mason City
2000 2022
2,710,344 92.6% White alone 82,473 2.8% Hispanic 60,744 2.1% Black alone 36,345 1.2% Asian alone 25,472 0.9% Two or more races 7,955 0.3% American Indian alone 2,103 0.07% Other race alone 888 0.03% Native Hawaiian and Other
2,650,110 82.8% White alone 218,024 6.8% Hispanic 119,004 3.7% Black alone 115,286 3.6% Two or more races 74,892 2.3% Asian alone 9,260 0.3% Other race alone 8,595 0.3% Native Hawaiian and Other 5,346 0.2% American Indian alone
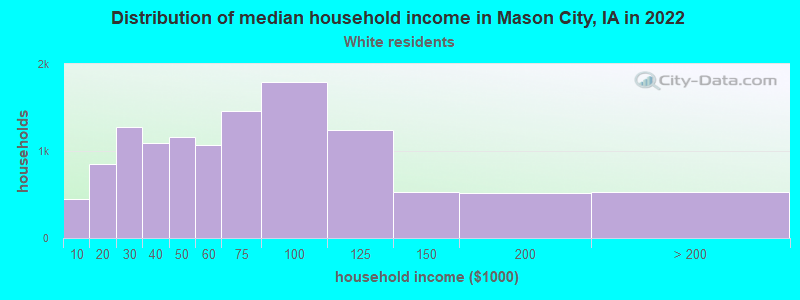
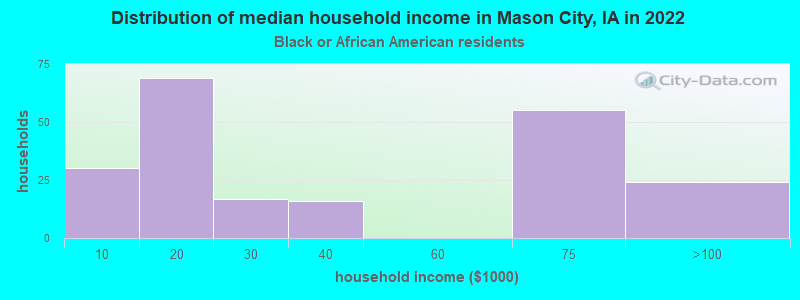
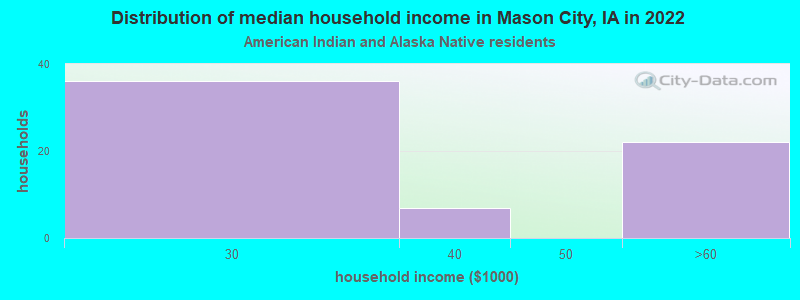
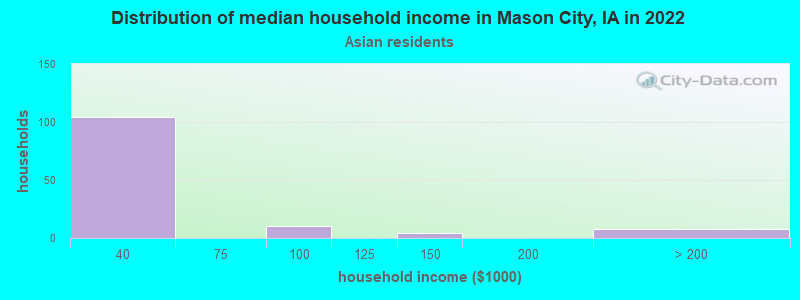
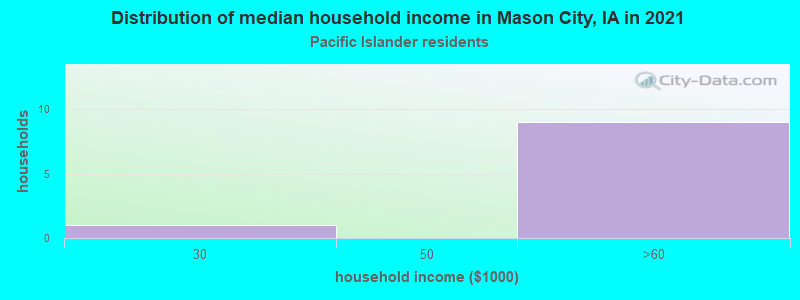
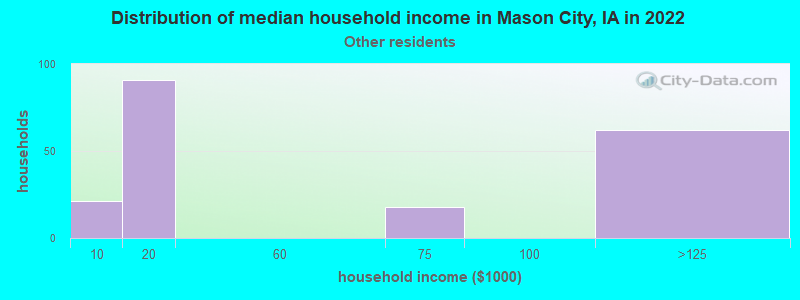
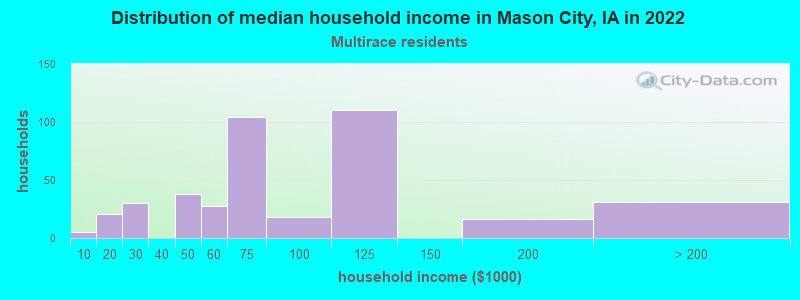
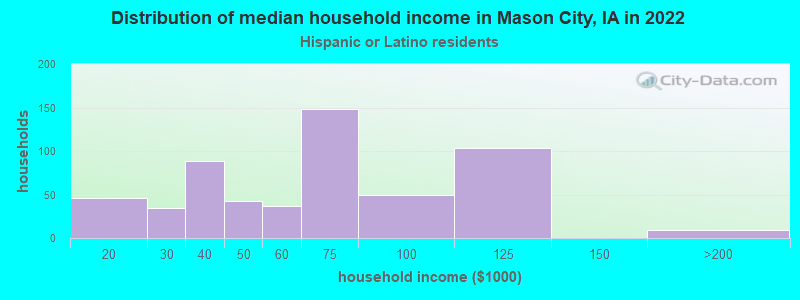
Income and house value in Mason City Median household income in 2022 $60,954 White non-Hispanic householders$23,094 American Indian and Alaska Native householders$38,893 Asian householders$57,849 Native Hawaiian and other Pacific Islander householders$73,401 Two or more races householders$66,804 Hispanic or Latino race householdersMedian 2022 house value $136,338 White Non-Hispanic householders$90,521 Black or African American householders$301,429 American Indian or Alaska Native householders $118,902 Asian householders$117,047 Some other race householders$169,357 Two or more races householders$113,708 Hispanic or Latino householders
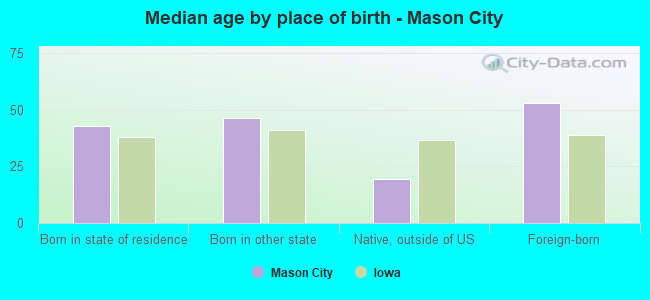
Median age by race in Mason City
45.9 Median age for White residents43.1 47.8 26.5 Median age for Black or African American residents29.0 26.6 26.3 Median age for American Indian / Alaska Native residents26.4 21.0 64.0 Median age for Asian residents65.0 55.3 18.6 Median age for Native Hawaiian / Pacific Islander residents25.3 13.5 43.4 Median age for Other race residents44.9 -664,399,092.3 27.4 Median age for Two or more races residents30.5 23.0 46.0 Median age for White alone residents44.5 47.5 31.4 Median age for Hispanic or Latino residents31.1 28.7
Owner/renter occupied households by race in Mason City
House owners and renters - White residents 8,389 70.3% Owner occupied3,549 29.7% Renter occupiedHouse owners and renters - Black or African American residents 68 29.9% Owner occupied159 70.1% Renter occupiedHouse owners and renters - American Indian / Alaska Native residents 60 100.0% Renter occupiedHouse owners and renters - Asian residents 177 100.0% Owner occupiedHouse owners and renters - Native Hawaiian / Pacific Islander residents 23 100.0% Renter occupiedHouse owners and renters - Other race residents 18 11.1% Owner occupied147 88.9% Renter occupiedHouse owners and renters - Two or more races residents 256 56.2% Owner occupied199 43.8% Renter occupiedHouse owners and renters - White alone residents 8,394 70.6% Owner occupied3,497 29.4% Renter occupiedHouse owners and renters - Hispanic or Latino residents 136 24.5% Owner occupied421 75.5% Renter occupied
Language usage in Mason City
English speakers - Total 95.7% of residents of Mason City speak English at home.
2.7% of residents speak Spanish at home 535 75.1% Speak English very well177 24.9% Speak English less than very well1.4% of residents speak other language at home 223 58.8% Speak English very well156 41.2% Speak English less than very well
English speakers - Born in the United States 97.1% of residents of Mason City speak English at home.
2.3% of residents speak Spanish at home 91 63.6% Speak English very well52 36.4% Speak English less than very well0.9% of residents speak other language at home 29 52.7% Speak English very well26 47.3% Speak English less than very well
English speakers - Native, born elsewhere 64.6% of residents of Mason City speak English at home.
29.1% of residents speak Spanish at home 55 100.0% Speak English very well3.7% of residents speak other language at home 7 100.0% Speak English less than very well
English speakers - Foreign-born 31.9% of residents of Mason City speak English at home.
38.4% of residents speak Spanish at home 141 52.2% Speak English very well129 47.8% Speak English less than very well29.9% of residents speak other language at home 93 44.3% Speak English very well117 55.7% Speak English less than very well
White (Caucasian) - Speak only English Native:
98.7% (22,855)Foreign-born:
24.9% (43)
White (Caucasian) - Speak another language Native:
1.4% (334)Foreign-born:
74.7% (129)
Black or African American - Speak only English Native:
100.0% (560)Foreign-born:
6.6% (6)
Asian - Speak only English Native:
58.4% (16)Foreign-born:
93.9% (168)
Asian - Speak another language Native:
42.0% (12)Foreign-born:
17.3% (31)
Native Hawaiian / Pacific Islander - Speak only English Native:
100.0% (42)Foreign-born:
7.0% (13)
Native Hawaiian / Pacific Islander - Speak another language Native:
2.2% (1)Foreign-born:
77.3% (143)
Other race - Speak another language Native:
14.7% (19)Foreign-born:
100.0% (54)
Two or more races - Speak another language Native:
18.8% (254)Foreign-born:
97.8% (59)
White alone - Speak only English Native:
98.4% (22,289)Foreign-born:
62.6% (48)
White alone - Speak another language Native:
1.6% (360)Foreign-born:
37.0% (28)
Hispanic or Latino - Speak another language Native:
15.7% (228)Foreign-born:
100.0% (262)
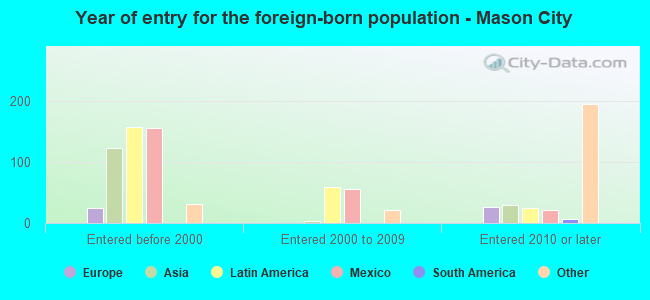
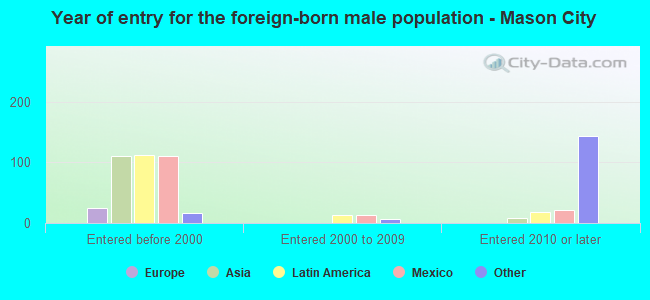
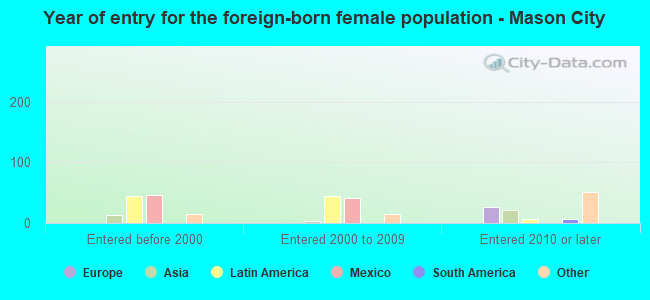
Foreign-born residents in Mason City 673 residents are foreign born (0.9% Latin America , 0.7% Asia , 0.4% Africa , 0.3% Oceania ).
Marital status for residents in Mason City Marital status - White (Caucasian) population 15 years and over
Males 33.5% Never married52.1% Now married1.0% Separated2.7% Widowed10.7% DivorcedFemales 25.4% Never married49.2% Now married0.5% Separated12.7% Widowed12.2% DivorcedWomen who gave birth in the past 12 months Now married:
68.2% (354)Unmarried:
31.8% (166)
Women who did not give birth in the past 12 months Now married:
42.8% (1,881)Unmarried:
57.2% (2,510)
Marital status - Black or African American population 15 years and over
Males 56.9% Never married34.4% Now married0.0% Separated8.7% Widowed0.0% DivorcedFemales 34.6% Never married56.8% Now married8.6% Separated0.0% Widowed0.0% DivorcedWomen who gave birth in the past 12 months Now married:
100.0% (91)Unmarried:
0.0% (0)
Women who did not give birth in the past 12 months Now married:
42.4% (27)Unmarried:
57.6% (37)
Marital status - American Indian / Alaska Native population 15 years and over
Males 0.0% Never married23.1% Now married0.0% Separated76.9% Widowed0.0% DivorcedFemales 93.5% Never married6.5% Now married0.0% Separated0.0% Widowed0.0% DivorcedWomen who did not give birth in the past 12 months Now married:
8.3% (3)Unmarried:
91.7% (35)
Marital status - Asian population 15 years and over
Males 11.4% Never married10.8% Now married0.0% Separated0.0% Widowed77.7% DivorcedFemales 0.0% Never married100.0% Now married0.0% Separated0.0% Widowed0.0% DivorcedWomen who did not give birth in the past 12 months Now married:
100.0% (10)Unmarried:
0.0% (0)
Marital status - Native Hawaiian / Pacific Islander population 15 years and over
Males 36.6% Never married31.7% Now married0.0% Separated0.0% Widowed31.7% DivorcedFemales 62.2% Never married37.8% Now married0.0% Separated0.0% Widowed0.0% DivorcedWomen who did not give birth in the past 12 months Now married:
37.8% (24)Unmarried:
62.2% (40)
Marital status - Other race population 15 years and over
Males 80.5% Never married19.5% Now married0.0% Separated0.0% Widowed0.0% DivorcedFemales 100.0% Never married0.0% Now married0.0% Separated0.0% Widowed0.0% DivorcedWomen who did not give birth in the past 12 months Now married:
0.0% (0)Unmarried:
100.0% (25)
Marital status - Two or more races population 15 years and over
Males 55.1% Never married30.1% Now married0.4% Separated0.6% Widowed13.7% DivorcedFemales 35.3% Never married60.1% Now married0.0% Separated0.0% Widowed4.5% DivorcedWomen who gave birth in the past 12 months Now married:
100.0% (16)Unmarried:
0.0% (0)
Women who did not give birth in the past 12 months Now married:
21.7% (46)Unmarried:
78.3% (167)
Marital status - White alone, not Hispanic / Latino population 15 years and over
Males 32.5% Never married52.7% Now married1.0% Separated2.8% Widowed11.0% DivorcedFemales 25.2% Never married49.0% Now married0.1% Separated13.1% Widowed12.5% DivorcedWomen who gave birth in the past 12 months Now married:
68.2% (360)Unmarried:
31.8% (168)
Women who did not give birth in the past 12 months Now married:
42.7% (1,841)Unmarried:
57.3% (2,468)
Marital status - Hispanic or Latino population 15 years and over
Males 55.8% Never married36.2% Now married0.0% Separated0.0% Widowed8.0% DivorcedFemales 37.6% Never married53.1% Now married9.3% Separated0.0% Widowed0.0% DivorcedWomen who did not give birth in the past 12 months Now married:
30.1% (79)Unmarried:
69.9% (183)
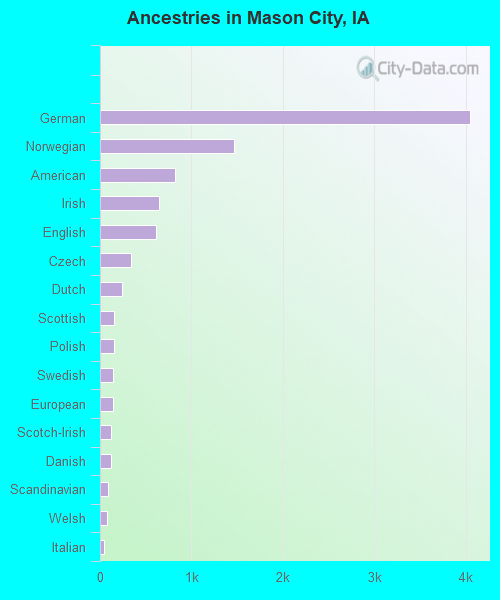
Ancestries in Mason City
4,050 34.0% German1,469 12.3% Norwegian818 6.9% American650 5.5% Irish609 5.1% English339 2.8% Czech242 2.0% Dutch157 1.3% Scottish148 1.2% Polish143 1.2% Swedish137 1.1% European120 1.0% Scotch-Irish119 1.0% Danish84 0.7% Scandinavian76 0.6% Welsh39 0.3% Italian34 0.3% Austrian33 0.3% Greek31 0.3% French30 0.3% Swiss27 0.2% Eastern European22 0.2% French Canadian19 0.2% Portuguese17 0.1% Pennsylvania German16 0.1% Belgian16 0.1% Northern European14 0.1% Hungarian13 0.1% Czechoslovakian12 0.1% Ukrainian10 0.08% Serbian7 0.06% British7 0.06% African5 0.04% Ghanaian4 0.03% Australian3 0.03% Kenyan
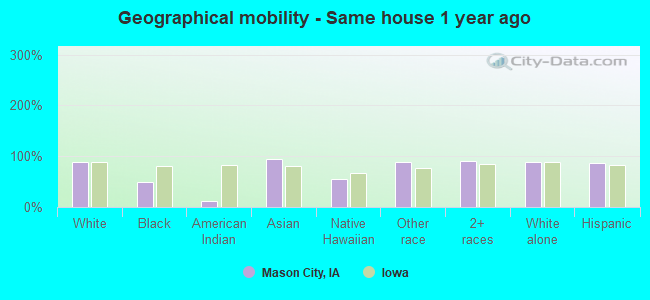
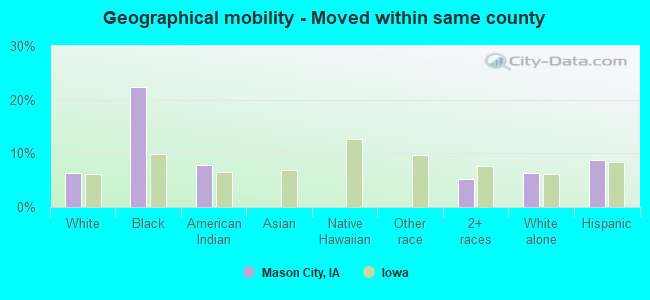
Geographical mobility in Mason City Same house 1 year ago 21,412 89.5% White (Caucasian)356 48.3% Black or African American12 11.8% American Indian / Alaska Native190 94.1% Asian71 55.6% Native Hawaiian / Pacific Islander166 87.9% Other race1,395 90.9% Two or more races20,895 89.4% White alone, not Hispanic / Latino1,581 86.4% Hispanic or LatinoMoved within same county 1,498 6.3% White / Caucasian165 22.4% Black or African American8 7.8% American Indian / Alaska Native81 5.3% Two or more races1,495 6.4% White alone, not Hispanic / Latino159 8.7% Hispanic or LatinoMoved within same state 572 2.4% White / Caucasian177 24.1% Black or African American36 36.4% American Indian / Alaska Native12 6.5% Other race41 2.7% Two or more races583 2.5% White alone, not Hispanic / Latino8 0.4% Hispanic or LatinoMoved from different state 299 1.3% White / Caucasian27 3.6% Black or African American1 1.0% American Indian / Alaska Native5 2.3% Asian57 44.7% Native Hawaiian / Pacific Islander23 1.5% Two or more races306 1.3% White alone, not Hispanic / Latino1 0.1% Hispanic or LatinoMoved from abroad 82 0.3% White9 1.2% Black or African American28 28.4% American Indian / Alaska Native9 4.6% Asian57 0.2% White alone, not Hispanic / Latino120 6.6% Hispanic or Latino
Children Nativity (place of birth) in Mason City
Children under 6 years - Living with two parents Both parents native 919 100.0% NativeBoth parents foreign-born 20 100.0% NativeChildren under 6 years - Living with one parent Native parent 513 100.0% NativeChildren 6 to 17 years - Living with two parents Both parents native 2,160 100.0% NativeBoth parents foreign-born 15 24.4% Native47 75.6% Foreign-bornOne native, one foreign-born parent 116 100.0% NativeChildren 6 to 17 years - Living with one parent Native parent 1,265 100.0% NativeForeign-born parent 54 64.0% Native30 36.0% Foreign-born
Grandparents responsible for own grandchildren in Mason City
Grandparents (30 to 59 years) White / Caucasian 25 50.2% Responsible for grandchildren25 49.8% Not responsible for grandchildrenNative Hawaiian / Pacific Islander 13 100.0% Not responsible for grandchildrenTwo or more races 5 100.0% Responsible for grandchildrenWhite alone, not Hispanic / Latino 13 30.7% Responsible for grandchildren28 69.3% Not responsible for grandchildrenHispanic or Latino 14 100.0% Responsible for grandchildrenGrandparents (60 years and over) White / Caucasian 17 16.0% Responsible for grandchildren89 84.0% Not responsible for grandchildrenWhite alone, not Hispanic / Latino 17 15.5% Responsible for grandchildren94 84.5% Not responsible for grandchildren