Races in Massillon, Ohio (OH) Detailed Stats
Data:
Races - White alone (%)
Races - White alone (% change since 2000)
Races - Black alone (%)
Races - Black alone (% change since 2000)
Races - American Indian alone (%)
Races - American Indian alone (% change since 2000)
Races - Asian alone (%)
Races - Asian alone (% change since 2000)
Races - Hispanic (%)
Races - Hispanic (% change since 2000)
Races - Native Hawaiian and Other Pacific Islander alone (%)
Races - Native Hawaiian and Other Pacific Islander alone (% change since 2000)
Races - Two or more races(%)
Races - Two or more races(% change since 2000)
Races - Other race alone (%)
Races - Other race alone (% change since 2000)
Racial diversity
Place of birth - Born in state of residence (%)
Place of birth - Born in state of residence (%) - White
Place of birth - Born in state of residence (%) - Black or African American
Place of birth - Born in state of residence (%) - Asian
Place of birth - Born in state of residence (%) - Hispanic or Latino
Place of birth - Born in state of residence (%) - American Indian and Alaska Native
Place of birth - Born in state of residence (%) - Multirace
Place of birth - Born in state of residence (%) - Other Race
Place of birth - Born in other state (%)
Place of birth - Born in other state (%) - White
Place of birth - Born in other state (%) - Black or African American
Place of birth - Born in other state (%) - Asian
Place of birth - Born in other state (%) - Hispanic or Latino
Place of birth - Born in other state (%) - American Indian and Alaska Native
Place of birth - Born in other state (%) - Multirace
Place of birth - Born in other state (%) - Other Race
Place of birth - Native, outside of US (%)
Place of birth - Native, outside of US (%) - White
Place of birth - Native, outside of US (%) - Black or African American
Place of birth - Native, outside of US (%) - Asian
Place of birth - Native, outside of US (%) - Hispanic or Latino
Place of birth - Native, outside of US (%) - American Indian and Alaska Native
Place of birth - Native, outside of US (%) - Multirace
Place of birth - Native, outside of US (%) - Other Race
Place of birth - Foreign born (%)
Place of birth - Foreign born (%) - White
Place of birth - Foreign born (%) - Black or African American
Place of birth - Foreign born (%) - Asian
Place of birth - Foreign born (%) - Hispanic or Latino
Place of birth - Foreign born (%) - American Indian and Alaska Native
Place of birth - Foreign born (%) - Multirace
Place of birth - Foreign born (%) - Other Race
Residents speaking English at home (%)
Residents speaking English at home - Born in the United States (%)
Residents speaking English at home - Native, born elsewhere (%)
Residents speaking English at home - Foreign born (%)
Residents speaking Spanish at home (%)
Residents speaking Spanish at home - Born in the United States (%)
Residents speaking Spanish at home - Native, born elsewhere (%)
Residents speaking Spanish at home - Foreign born (%)
Residents speaking other language at home (%)
Residents speaking other language at home - Born in the United States (%)
Residents speaking other language at home - Native, born elsewhere (%)
Residents speaking other language at home - Foreign born (%)
Marital status - Never married (%)
Marital status - Now married (%)
Marital status - Separated (%)
Marital status - Widowed (%)
Marital status - Divorced (%)
Ancestries Reported - Arab (%)
Ancestries Reported - Czech (%)
Ancestries Reported - Danish (%)
Ancestries Reported - Dutch (%)
Ancestries Reported - English (%)
Ancestries Reported - French (%)
Ancestries Reported - French Canadian (%)
Ancestries Reported - German (%)
Ancestries Reported - Greek (%)
Ancestries Reported - Hungarian (%)
Ancestries Reported - Irish (%)
Ancestries Reported - Italian (%)
Ancestries Reported - Lithuanian (%)
Ancestries Reported - Norwegian (%)
Ancestries Reported - Polish (%)
Ancestries Reported - Portuguese (%)
Ancestries Reported - Russian (%)
Ancestries Reported - Scotch-Irish (%)
Ancestries Reported - Scottish (%)
Ancestries Reported - Slovak (%)
Ancestries Reported - Subsaharan African (%)
Ancestries Reported - Swedish (%)
Ancestries Reported - Swiss (%)
Ancestries Reported - Ukrainian (%)
Ancestries Reported - United States (%)
Ancestries Reported - Welsh (%)
Ancestries Reported - West Indian (%)
Ancestries Reported - Other (%)
Geographical mobility - Same house 1 year ago (%)
Geographical mobility - Same house 1 year ago (%) - White
Geographical mobility - Same house 1 year ago (%) - Black or African American
Geographical mobility - Same house 1 year ago (%) - Asian
Geographical mobility - Same house 1 year ago (%) - Hispanic or Latino
Geographical mobility - Same house 1 year ago (%) - American Indian and Alaska Native
Geographical mobility - Same house 1 year ago (%) - Multirace
Geographical mobility - Same house 1 year ago (%) - Other Race
Geographical mobility - Moved within same county (%)
Geographical mobility - Moved within same county (%) - White
Geographical mobility - Moved within same county (%) - Black or African American
Geographical mobility - Moved within same county (%) - Asian
Geographical mobility - Moved within same county (%) - Hispanic or Latino
Geographical mobility - Moved within same county (%) - American Indian and Alaska Native
Geographical mobility - Moved within same county (%) - Multirace
Geographical mobility - Moved within same county (%) - Other Race
Geographical mobility - Moved from different county within same state (%)
Geographical mobility - Moved from different county within same state (%) - White
Geographical mobility - Moved from different county within same state (%) - Black or African American
Geographical mobility - Moved from different county within same state (%) - Asian
Geographical mobility - Moved from different county within same state (%) - Hispanic or Latino
Geographical mobility - Moved from different county within same state (%) - American Indian and Alaska Native
Geographical mobility - Moved from different county within same state (%) - Multirace
Geographical mobility - Moved from different county within same state (%) - Other Race
Geographical mobility - Moved from different state (%)
Geographical mobility - Moved from different state (%) - White
Geographical mobility - Moved from different state (%) - Black or African American
Geographical mobility - Moved from different state (%) - Asian
Geographical mobility - Moved from different state (%) - Hispanic or Latino
Geographical mobility - Moved from different state (%) - American Indian and Alaska Native
Geographical mobility - Moved from different state (%) - Multirace
Geographical mobility - Moved from different state (%) - Other Race
Geographical mobility - Moved from abroad (%)
Geographical mobility - Moved from abroad (%) - White
Geographical mobility - Moved from abroad (%) - Black or African American
Geographical mobility - Moved from abroad (%) - Asian
Geographical mobility - Moved from abroad (%) - Hispanic or Latino
Geographical mobility - Moved from abroad (%) - American Indian and Alaska Native
Geographical mobility - Moved from abroad (%) - Multirace
Geographical mobility - Moved from abroad (%) - Other Race
Place of birth for the foreign-born population - Ireland (%)
Place of birth for the foreign-born population - Denmark (%)
Place of birth for the foreign-born population - Norway (%)
Place of birth for the foreign-born population - Sweden (%)
Place of birth for the foreign-born population - United Kingdom (%)
Place of birth for the foreign-born population - England (%)
Place of birth for the foreign-born population - Scotland (%)
Place of birth for the foreign-born population - Other Northern Europe (%)
Place of birth for the foreign-born population - Austria (%)
Place of birth for the foreign-born population - Belgium (%)
Place of birth for the foreign-born population - France (%)
Place of birth for the foreign-born population - Germany (%)
Place of birth for the foreign-born population - Netherlands (%)
Place of birth for the foreign-born population - Switzerland (%)
Place of birth for the foreign-born population - Other Western Europe (%)
Place of birth for the foreign-born population - Greece (%)
Place of birth for the foreign-born population - Italy (%)
Place of birth for the foreign-born population - Portugal (%)
Place of birth for the foreign-born population - Spain (%)
Place of birth for the foreign-born population - Other Southern Europe (%)
Place of birth for the foreign-born population - Albania (%)
Place of birth for the foreign-born population - Belarus (%)
Place of birth for the foreign-born population - Bosnia and Herzegovina (%)
Place of birth for the foreign-born population - Bulgaria (%)
Place of birth for the foreign-born population - Croatia (%)
Place of birth for the foreign-born population - Czechoslovakia (%)
Place of birth for the foreign-born population - Hungary (%)
Place of birth for the foreign-born population - Latvia (%)
Place of birth for the foreign-born population - Lithuania (%)
Place of birth for the foreign-born population - North Macedonia (Macedonia) (%)
Place of birth for the foreign-born population - Moldova (%)
Place of birth for the foreign-born population - Poland (%)
Place of birth for the foreign-born population - Romania (%)
Place of birth for the foreign-born population - Russia (%)
Place of birth for the foreign-born population - Serbia (%)
Place of birth for the foreign-born population - Ukraine (%)
Place of birth for the foreign-born population - Other Eastern Europe (%)
Place of birth for the foreign-born population - China (%)
Place of birth for the foreign-born population - Hong Kong (%)
Place of birth for the foreign-born population - Taiwan (%)
Place of birth for the foreign-born population - Japan (%)
Place of birth for the foreign-born population - Korea (%)
Place of birth for the foreign-born population - Other Eastern Asia (%)
Place of birth for the foreign-born population - Afghanistan (%)
Place of birth for the foreign-born population - Bangladesh (%)
Place of birth for the foreign-born population - India (%)
Place of birth for the foreign-born population - Iran (%)
Place of birth for the foreign-born population - Kazakhstan (%)
Place of birth for the foreign-born population - Nepal (%)
Place of birth for the foreign-born population - Pakistan (%)
Place of birth for the foreign-born population - Sri Lanka (%)
Place of birth for the foreign-born population - Uzbekistan (%)
Place of birth for the foreign-born population - Other South Central Asia (%)
Place of birth for the foreign-born population - Burma (%)
Place of birth for the foreign-born population - Cambodia (%)
Place of birth for the foreign-born population - Indonesia (%)
Place of birth for the foreign-born population - Laos (%)
Place of birth for the foreign-born population - Malaysia (%)
Place of birth for the foreign-born population - Philippines (%)
Place of birth for the foreign-born population - Singapore (%)
Place of birth for the foreign-born population - Thailand (%)
Place of birth for the foreign-born population - Vietnam (%)
Place of birth for the foreign-born population - Other South Eastern Asia (%)
Place of birth for the foreign-born population - Armenia (%)
Place of birth for the foreign-born population - Iraq (%)
Place of birth for the foreign-born population - Israel (%)
Place of birth for the foreign-born population - Jordan (%)
Place of birth for the foreign-born population - Kuwait (%)
Place of birth for the foreign-born population - Lebanon (%)
Place of birth for the foreign-born population - Saudi Arabia (%)
Place of birth for the foreign-born population - Syria (%)
Place of birth for the foreign-born population - Turkey (%)
Place of birth for the foreign-born population - Yemen (%)
Place of birth for the foreign-born population - Other Western Asia (%)
Place of birth for the foreign-born population - Eritrea (%)
Place of birth for the foreign-born population - Ethiopia (%)
Place of birth for the foreign-born population - Kenya (%)
Place of birth for the foreign-born population - Somalia (%)
Place of birth for the foreign-born population - Uganda (%)
Place of birth for the foreign-born population - Zimbabwe (%)
Place of birth for the foreign-born population - Other Eastern Africa (%)
Place of birth for the foreign-born population - Cameroon (%)
Place of birth for the foreign-born population - Congo (%)
Place of birth for the foreign-born population - Democratic Republic of Congo (Zaire) (%)
Place of birth for the foreign-born population - Other Middle Africa (%)
Place of birth for the foreign-born population - Egypt (%)
Place of birth for the foreign-born population - Morocco (%)
Place of birth for the foreign-born population - Sudan (%)
Place of birth for the foreign-born population - Other Northern Africa (%)
Place of birth for the foreign-born population - South Africa (%)
Place of birth for the foreign-born population - Other Southern Africa (%)
Place of birth for the foreign-born population - Cabo Verde (%)
Place of birth for the foreign-born population - Ghana (%)
Place of birth for the foreign-born population - Liberia (%)
Place of birth for the foreign-born population - Nigeria (%)
Place of birth for the foreign-born population - Senegal (%)
Place of birth for the foreign-born population - Sierra Leone (%)
Place of birth for the foreign-born population - Other Western Africa (%)
Place of birth for the foreign-born population - Australia (%)
Place of birth for the foreign-born population - New Zealand (%)
Place of birth for the foreign-born population - Fiji (%)
Place of birth for the foreign-born population - Micronesia (%)
Place of birth for the foreign-born population - Bahamas (%)
Place of birth for the foreign-born population - Barbados (%)
Place of birth for the foreign-born population - Cuba (%)
Place of birth for the foreign-born population - Dominica (%)
Place of birth for the foreign-born population - Dominican Republic (%)
Place of birth for the foreign-born population - Grenada (%)
Place of birth for the foreign-born population - Haiti (%)
Place of birth for the foreign-born population - Jamaica (%)
Place of birth for the foreign-born population - St. Vincent and the Grenadines (%)
Place of birth for the foreign-born population - Trinidad and Tobago (%)
Place of birth for the foreign-born population - West Indies (%)
Place of birth for the foreign-born population - Other Caribbean (%)
Place of birth for the foreign-born population - Belize (%)
Place of birth for the foreign-born population - Costa Rica (%)
Place of birth for the foreign-born population - El Salvador (%)
Place of birth for the foreign-born population - Guatemala (%)
Place of birth for the foreign-born population - Honduras (%)
Place of birth for the foreign-born population - Mexico (%)
Place of birth for the foreign-born population - Nicaragua (%)
Place of birth for the foreign-born population - Panama (%)
Place of birth for the foreign-born population - Other Central America (%)
Place of birth for the foreign-born population - Argentina (%)
Place of birth for the foreign-born population - Bolivia (%)
Place of birth for the foreign-born population - Brazil (%)
Place of birth for the foreign-born population - Chile (%)
Place of birth for the foreign-born population - Colombia (%)
Place of birth for the foreign-born population - Ecuador (%)
Place of birth for the foreign-born population - Guyana (%)
Place of birth for the foreign-born population - Peru (%)
Place of birth for the foreign-born population - Uruguay (%)
Place of birth for the foreign-born population - Venezuela (%)
Place of birth for the foreign-born population - Other South America (%)
Place of birth for the foreign-born population - Canada (%)
Place of birth for the foreign-born population - Other Northern America (%)
Place of birth for the foreign-born population - Other (%)
Latest news about races in Massillon, OH collected exclusively by city-data.com from local newspapers, TV, and radio stations
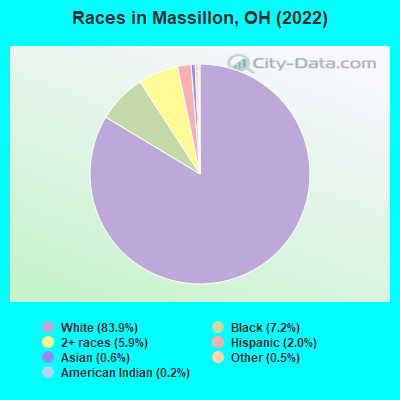
According to 2022 data, the most numerous races in Massillon, OH are White alone (26,875 residents), Black alone (2,298 residents), and Two or more races (1,889 residents). 97.5% of Massillon residents speak English at home. 1.5% of Massillon, OH residents are foreign-born , which is 172.7% less than the foreign-born rate of 4.0% across the entire state of Ohio.
Race distribution in Massillon
2000 2022
9,538,111 84.0% White alone 1,290,662 11.4% Black alone 217,123 1.9% Hispanic 137,770 1.2% Two or more races 131,670 1.2% Asian alone 21,985 0.2% American Indian alone 13,483 0.1% Other race alone 2,336 0.02% Native Hawaiian and Other
8,948,793 76.1% White alone 1,401,403 11.9% Black alone 529,291 4.5% Two or more races 517,232 4.4% Hispanic 293,387 2.5% Asian alone 52,805 0.4% Other race alone 9,785 0.08% American Indian alone 3,362 0.03% Native Hawaiian and Other
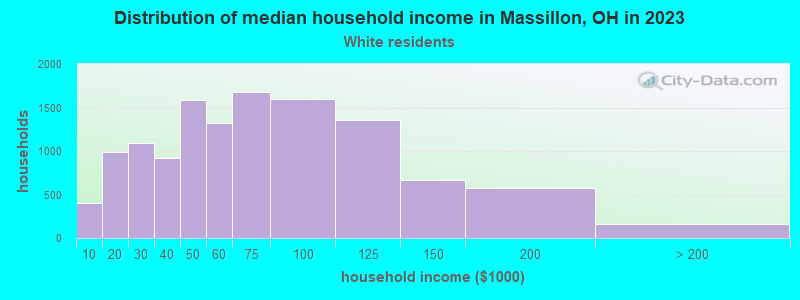
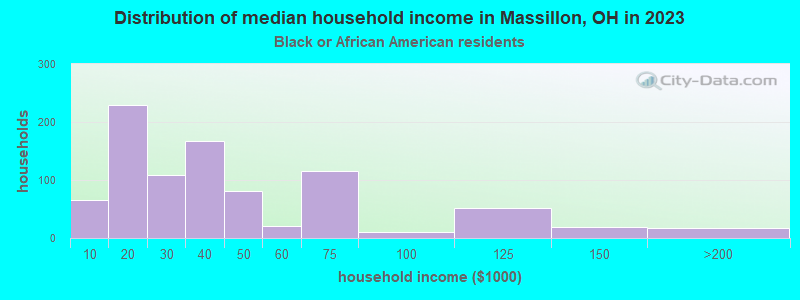
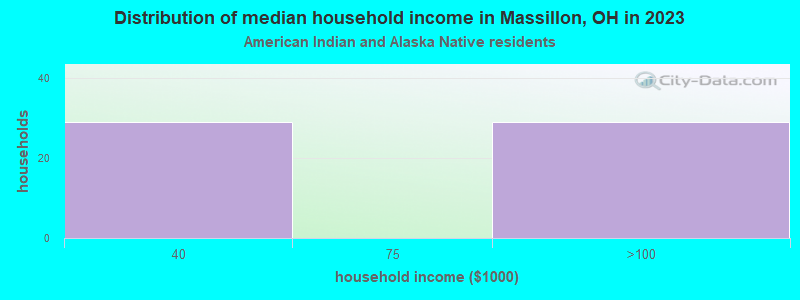
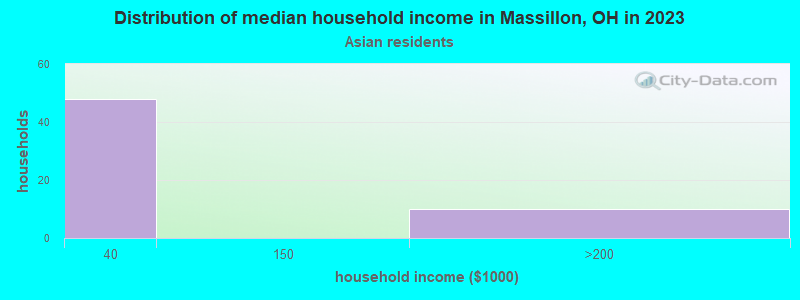
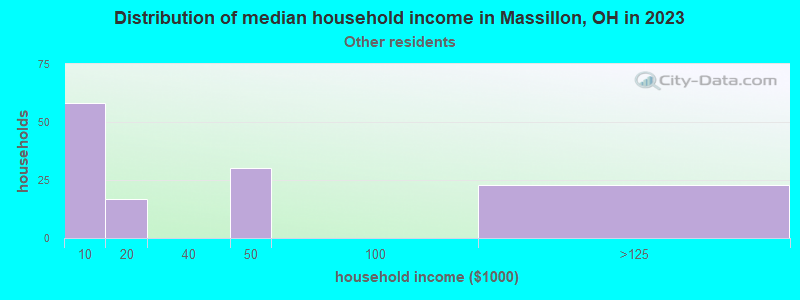
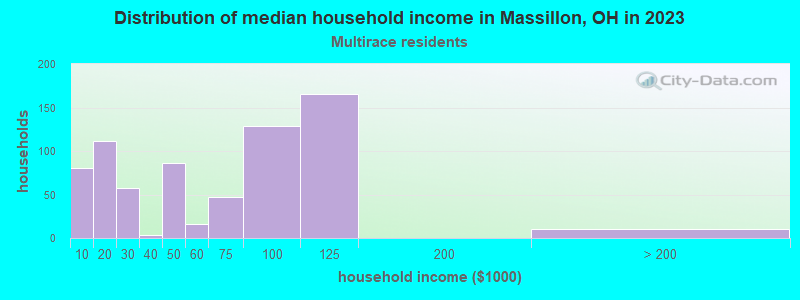
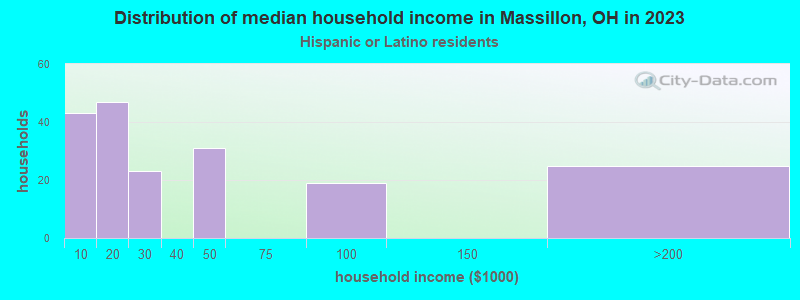
Income and house value in Massillon Median household income in 2022 $56,139 White non-Hispanic householders$42,227 Black householders$52,479 Two or more races householdersMedian 2022 house value $138,216 White Non-Hispanic householders$89,395 Black or African American householders$185,553 American Indian or Alaska Native householders $123,702 Asian householders$140,196 Native Hawaiian and other Pacific Islander householders$110,012 Two or more races householders$104,404 Hispanic or Latino householders
Median age by race in Massillon
42.6 Median age for White residents41.9 44.3 38.6 Median age for Black or African American residents40.8 35.0 63.3 Median age for American Indian / Alaska Native residents-864,561,402.6 60.1 32.5 Median age for Asian residents-544,855,966.5 37.2 -666,666,666.0 Median age for Native Hawaiian / Pacific Islander residents-666,666,666.0 -666,666,666.0 46.4 Median age for Other race residents47.9 57.1 21.0 Median age for Two or more races residents17.2 25.4 42.6 Median age for White alone residents41.8 44.2 33.8 Median age for Hispanic or Latino residents17.8 59.7
Owner/renter occupied households by race in Massillon
House owners and renters - White residents 7,817 63.3% Owner occupied4,541 36.7% Renter occupiedHouse owners and renters - Black or African American residents 420 49.7% Owner occupied425 50.3% Renter occupiedHouse owners and renters - American Indian / Alaska Native residents 30 43.3% Owner occupied39 56.7% Renter occupiedHouse owners and renters - Asian residents 19 28.7% Owner occupied46 71.3% Renter occupiedHouse owners and renters - Other race residents 71 65.6% Owner occupied37 34.4% Renter occupiedHouse owners and renters - Two or more races residents 481 66.7% Owner occupied239 33.3% Renter occupiedHouse owners and renters - White alone residents 7,781 63.1% Owner occupied4,548 36.9% Renter occupiedHouse owners and renters - Hispanic or Latino residents 192 91.3% Owner occupied18 8.7% Renter occupied
Language usage in Massillon
English speakers - Total 97.5% of residents of Massillon speak English at home.
0.7% of residents speak Spanish at home 144 66.7% Speak English very well72 33.3% Speak English less than very well1.8% of residents speak other language at home 428 76.8% Speak English very well129 23.2% Speak English less than very well
English speakers - Born in the United States 99.4% of residents of Massillon speak English at home.
0.9% of residents speak Spanish at home 20 51.3% Speak English very well19 48.7% Speak English less than very well0.3% of residents speak other language at home 13 100.0% Speak English very well
English speakers - Native, born elsewhere 79.9% of residents of Massillon speak English at home.
18.9% of residents speak other language at home 32 100.0% Speak English less than very well
English speakers - Foreign-born 24.2% of residents of Massillon speak English at home.
17.3% of residents speak Spanish at home 49 65.3% Speak English very well26 34.7% Speak English less than very well54.5% of residents speak other language at home 131 55.5% Speak English very well105 44.5% Speak English less than very well
White (Caucasian) - Speak only English Native:
98.8% (25,284)Foreign-born:
45.1% (88)
White (Caucasian) - Speak another language Native:
1.2% (314)Foreign-born:
53.3% (105)
Two or more races - Speak another language Native:
9.5% (212)Foreign-born:
100.0% (79)
White alone - Speak only English Native:
98.8% (25,143)Foreign-born:
44.5% (83)
White alone - Speak another language Native:
1.2% (300)Foreign-born:
53.8% (100)
Hispanic or Latino - Speak only English Native:
88.9% (455)Foreign-born:
15.9% (10)
Hispanic or Latino - Speak another language Native:
12.2% (62)Foreign-born:
100.0% (64)
Foreign-born residents in Massillon 470 residents are foreign born
Marital status for residents in Massillon Marital status - White (Caucasian) population 15 years and over
Males 32.8% Never married44.9% Now married1.5% Separated3.5% Widowed17.3% DivorcedFemales 26.8% Never married43.6% Now married1.1% Separated10.1% Widowed18.5% DivorcedWomen who gave birth in the past 12 months Now married:
21.7% (64)Unmarried:
78.3% (230)
Women who did not give birth in the past 12 months Now married:
38.5% (2,100)Unmarried:
61.5% (3,354)
Marital status - Black or African American population 15 years and over
Males 45.3% Never married32.0% Now married9.1% Separated2.1% Widowed11.5% DivorcedFemales 47.4% Never married17.7% Now married3.9% Separated9.1% Widowed21.8% DivorcedWomen who gave birth in the past 12 months Now married:
0.0% (0)Unmarried:
100.0% (15)
Women who did not give birth in the past 12 months Now married:
13.8% (57)Unmarried:
86.2% (354)
Marital status - American Indian / Alaska Native population 15 years and over
Males 0.0% Never married90.0% Now married0.0% Separated0.0% Widowed10.0% DivorcedFemales 0.0% Never married0.0% Now married0.0% Separated91.5% Widowed8.5% DivorcedMarital status - Asian population 15 years and over
Males 43.0% Never married57.0% Now married0.0% Separated0.0% Widowed0.0% DivorcedFemales 0.0% Never married100.0% Now married0.0% Separated0.0% Widowed0.0% DivorcedWomen who did not give birth in the past 12 months Now married:
100.0% (89)Unmarried:
0.0% (0)
Marital status - Other race population 15 years and over
Males 0.0% Never married66.7% Now married0.0% Separated0.0% Widowed33.3% DivorcedFemales 34.9% Never married46.5% Now married0.0% Separated0.0% Widowed18.6% DivorcedWomen who did not give birth in the past 12 months Now married:
36.2% (22)Unmarried:
63.8% (40)
Marital status - Two or more races population 15 years and over
Males 73.7% Never married13.5% Now married3.9% Separated0.0% Widowed8.9% DivorcedFemales 51.7% Never married25.4% Now married5.5% Separated8.4% Widowed9.0% DivorcedWomen who gave birth in the past 12 months Now married:
0.0% (0)Unmarried:
100.0% (13)
Women who did not give birth in the past 12 months Now married:
32.8% (191)Unmarried:
67.2% (391)
Marital status - White alone, not Hispanic / Latino population 15 years and over
Males 32.8% Never married45.0% Now married1.5% Separated3.5% Widowed17.3% DivorcedFemales 26.9% Never married43.4% Now married1.1% Separated10.1% Widowed18.5% DivorcedWomen who gave birth in the past 12 months Now married:
21.7% (63)Unmarried:
78.3% (229)
Women who did not give birth in the past 12 months Now married:
38.5% (2,095)Unmarried:
61.5% (3,346)
Marital status - Hispanic or Latino population 15 years and over
Males 54.4% Never married29.6% Now married0.0% Separated4.1% Widowed11.8% DivorcedFemales 5.1% Never married71.8% Now married15.7% Separated0.0% Widowed7.4% DivorcedWomen who did not give birth in the past 12 months Now married:
96.9% (99)Unmarried:
3.1% (3)
Ancestries in Massillon
3,484 25.5% German1,500 11.0% American1,146 8.4% Irish908 6.6% English798 5.8% Italian535 3.9% African332 2.4% European238 1.7% Slovak188 1.4% Greek180 1.3% Hungarian136 1.0% Polish134 1.0% Scottish131 1.0% Scotch-Irish117 0.9% Portuguese88 0.6% Czechoslovakian75 0.5% Pennsylvania German63 0.5% Dutch62 0.5% Welsh62 0.5% Romanian61 0.4% British57 0.4% Serbian52 0.4% Swiss47 0.3% Eastern European43 0.3% Lebanese31 0.2% Bulgarian31 0.2% Ukrainian29 0.2% French25 0.2% Croatian25 0.2% Jamaican24 0.2% Arab20 0.1% Scandinavian18 0.1% Canadian15 0.1% French Canadian14 0.1% Northern European14 0.1% Swedish13 0.10% Slovene12 0.09% Danish11 0.08% Czech11 0.08% Nigerian7 0.05% Norwegian5 0.04% Austrian5 0.04% Cape Verdean
Geographical mobility in Massillon Same house 1 year ago 24,460 91.0% White (Caucasian)2,284 100.0% Black or African American88 75.8% American Indian / Alaska Native163 89.2% Asian199 90.3% Other race2,371 100.0% Two or more races24,301 90.8% White alone, not Hispanic / Latino509 86.8% Hispanic or LatinoMoved within same county 1,750 6.5% White / Caucasian64 2.8% Black or African American22 11.8% Asian16 7.4% Other race281 12.0% Two or more races1,767 6.6% White alone, not Hispanic / Latino36 6.1% Hispanic or LatinoMoved within same state 465 1.7% White / Caucasian2 0.1% Black or African American24 1.0% Two or more races458 1.7% White alone, not Hispanic / Latino13 2.1% Hispanic or LatinoMoved from different state 129 0.5% White / Caucasian11 0.5% Black or African American40 34.2% American Indian / Alaska Native132 0.5% White alone, not Hispanic / Latino27 4.6% Hispanic or LatinoMoved from abroad 26 0.1% White32 0.1% White alone, not Hispanic / Latino
Children Nativity (place of birth) in Massillon
Children under 6 years - Living with two parents Both parents native 859 100.0% NativeChildren under 6 years - Living with one parent Native parent 1,027 100.0% NativeChildren 6 to 17 years - Living with two parents Both parents native 2,054 100.0% NativeBoth parents foreign-born 42 66.7% Native21 33.3% Foreign-bornOne native, one foreign-born parent 47 100.0% NativeChildren 6 to 17 years - Living with one parent Native parent 1,857 100.0% NativeForeign-born parent 63 50.4% Native62 49.6% Foreign-born
Grandparents responsible for own grandchildren in Massillon
Grandparents (30 to 59 years) White / Caucasian 190 65.4% Responsible for grandchildren101 34.6% Not responsible for grandchildrenBlack or African American 90 100.0% Responsible for grandchildrenTwo or more races 8 100.0% Not responsible for grandchildrenWhite alone, not Hispanic / Latino 190 64.5% Responsible for grandchildren105 35.5% Not responsible for grandchildrenGrandparents (60 years and over) White / Caucasian 44 16.9% Responsible for grandchildren216 83.1% Not responsible for grandchildrenBlack or African American 15 100.0% Not responsible for grandchildrenWhite alone, not Hispanic / Latino 44 18.0% Responsible for grandchildren203 82.0% Not responsible for grandchildren