Races in Melrose Park, Illinois (IL) Detailed Stats
Data:
Races - White alone (%)
Races - White alone (% change since 2000)
Races - Black alone (%)
Races - Black alone (% change since 2000)
Races - American Indian alone (%)
Races - American Indian alone (% change since 2000)
Races - Asian alone (%)
Races - Asian alone (% change since 2000)
Races - Hispanic (%)
Races - Hispanic (% change since 2000)
Races - Native Hawaiian and Other Pacific Islander alone (%)
Races - Native Hawaiian and Other Pacific Islander alone (% change since 2000)
Races - Two or more races(%)
Races - Two or more races(% change since 2000)
Races - Other race alone (%)
Races - Other race alone (% change since 2000)
Racial diversity
Place of birth - Born in state of residence (%)
Place of birth - Born in state of residence (%) - White
Place of birth - Born in state of residence (%) - Black or African American
Place of birth - Born in state of residence (%) - Asian
Place of birth - Born in state of residence (%) - Hispanic or Latino
Place of birth - Born in state of residence (%) - American Indian and Alaska Native
Place of birth - Born in state of residence (%) - Multirace
Place of birth - Born in state of residence (%) - Other Race
Place of birth - Born in other state (%)
Place of birth - Born in other state (%) - White
Place of birth - Born in other state (%) - Black or African American
Place of birth - Born in other state (%) - Asian
Place of birth - Born in other state (%) - Hispanic or Latino
Place of birth - Born in other state (%) - American Indian and Alaska Native
Place of birth - Born in other state (%) - Multirace
Place of birth - Born in other state (%) - Other Race
Place of birth - Native, outside of US (%)
Place of birth - Native, outside of US (%) - White
Place of birth - Native, outside of US (%) - Black or African American
Place of birth - Native, outside of US (%) - Asian
Place of birth - Native, outside of US (%) - Hispanic or Latino
Place of birth - Native, outside of US (%) - American Indian and Alaska Native
Place of birth - Native, outside of US (%) - Multirace
Place of birth - Native, outside of US (%) - Other Race
Place of birth - Foreign born (%)
Place of birth - Foreign born (%) - White
Place of birth - Foreign born (%) - Black or African American
Place of birth - Foreign born (%) - Asian
Place of birth - Foreign born (%) - Hispanic or Latino
Place of birth - Foreign born (%) - American Indian and Alaska Native
Place of birth - Foreign born (%) - Multirace
Place of birth - Foreign born (%) - Other Race
Residents speaking English at home (%)
Residents speaking English at home - Born in the United States (%)
Residents speaking English at home - Native, born elsewhere (%)
Residents speaking English at home - Foreign born (%)
Residents speaking Spanish at home (%)
Residents speaking Spanish at home - Born in the United States (%)
Residents speaking Spanish at home - Native, born elsewhere (%)
Residents speaking Spanish at home - Foreign born (%)
Residents speaking other language at home (%)
Residents speaking other language at home - Born in the United States (%)
Residents speaking other language at home - Native, born elsewhere (%)
Residents speaking other language at home - Foreign born (%)
Marital status - Never married (%)
Marital status - Now married (%)
Marital status - Separated (%)
Marital status - Widowed (%)
Marital status - Divorced (%)
Ancestries Reported - Arab (%)
Ancestries Reported - Czech (%)
Ancestries Reported - Danish (%)
Ancestries Reported - Dutch (%)
Ancestries Reported - English (%)
Ancestries Reported - French (%)
Ancestries Reported - French Canadian (%)
Ancestries Reported - German (%)
Ancestries Reported - Greek (%)
Ancestries Reported - Hungarian (%)
Ancestries Reported - Irish (%)
Ancestries Reported - Italian (%)
Ancestries Reported - Lithuanian (%)
Ancestries Reported - Norwegian (%)
Ancestries Reported - Polish (%)
Ancestries Reported - Portuguese (%)
Ancestries Reported - Russian (%)
Ancestries Reported - Scotch-Irish (%)
Ancestries Reported - Scottish (%)
Ancestries Reported - Slovak (%)
Ancestries Reported - Subsaharan African (%)
Ancestries Reported - Swedish (%)
Ancestries Reported - Swiss (%)
Ancestries Reported - Ukrainian (%)
Ancestries Reported - United States (%)
Ancestries Reported - Welsh (%)
Ancestries Reported - West Indian (%)
Ancestries Reported - Other (%)
Geographical mobility - Same house 1 year ago (%)
Geographical mobility - Same house 1 year ago (%) - White
Geographical mobility - Same house 1 year ago (%) - Black or African American
Geographical mobility - Same house 1 year ago (%) - Asian
Geographical mobility - Same house 1 year ago (%) - Hispanic or Latino
Geographical mobility - Same house 1 year ago (%) - American Indian and Alaska Native
Geographical mobility - Same house 1 year ago (%) - Multirace
Geographical mobility - Same house 1 year ago (%) - Other Race
Geographical mobility - Moved within same county (%)
Geographical mobility - Moved within same county (%) - White
Geographical mobility - Moved within same county (%) - Black or African American
Geographical mobility - Moved within same county (%) - Asian
Geographical mobility - Moved within same county (%) - Hispanic or Latino
Geographical mobility - Moved within same county (%) - American Indian and Alaska Native
Geographical mobility - Moved within same county (%) - Multirace
Geographical mobility - Moved within same county (%) - Other Race
Geographical mobility - Moved from different county within same state (%)
Geographical mobility - Moved from different county within same state (%) - White
Geographical mobility - Moved from different county within same state (%) - Black or African American
Geographical mobility - Moved from different county within same state (%) - Asian
Geographical mobility - Moved from different county within same state (%) - Hispanic or Latino
Geographical mobility - Moved from different county within same state (%) - American Indian and Alaska Native
Geographical mobility - Moved from different county within same state (%) - Multirace
Geographical mobility - Moved from different county within same state (%) - Other Race
Geographical mobility - Moved from different state (%)
Geographical mobility - Moved from different state (%) - White
Geographical mobility - Moved from different state (%) - Black or African American
Geographical mobility - Moved from different state (%) - Asian
Geographical mobility - Moved from different state (%) - Hispanic or Latino
Geographical mobility - Moved from different state (%) - American Indian and Alaska Native
Geographical mobility - Moved from different state (%) - Multirace
Geographical mobility - Moved from different state (%) - Other Race
Geographical mobility - Moved from abroad (%)
Geographical mobility - Moved from abroad (%) - White
Geographical mobility - Moved from abroad (%) - Black or African American
Geographical mobility - Moved from abroad (%) - Asian
Geographical mobility - Moved from abroad (%) - Hispanic or Latino
Geographical mobility - Moved from abroad (%) - American Indian and Alaska Native
Geographical mobility - Moved from abroad (%) - Multirace
Geographical mobility - Moved from abroad (%) - Other Race
Place of birth for the foreign-born population - Ireland (%)
Place of birth for the foreign-born population - Denmark (%)
Place of birth for the foreign-born population - Norway (%)
Place of birth for the foreign-born population - Sweden (%)
Place of birth for the foreign-born population - United Kingdom (%)
Place of birth for the foreign-born population - England (%)
Place of birth for the foreign-born population - Scotland (%)
Place of birth for the foreign-born population - Other Northern Europe (%)
Place of birth for the foreign-born population - Austria (%)
Place of birth for the foreign-born population - Belgium (%)
Place of birth for the foreign-born population - France (%)
Place of birth for the foreign-born population - Germany (%)
Place of birth for the foreign-born population - Netherlands (%)
Place of birth for the foreign-born population - Switzerland (%)
Place of birth for the foreign-born population - Other Western Europe (%)
Place of birth for the foreign-born population - Greece (%)
Place of birth for the foreign-born population - Italy (%)
Place of birth for the foreign-born population - Portugal (%)
Place of birth for the foreign-born population - Spain (%)
Place of birth for the foreign-born population - Other Southern Europe (%)
Place of birth for the foreign-born population - Albania (%)
Place of birth for the foreign-born population - Belarus (%)
Place of birth for the foreign-born population - Bosnia and Herzegovina (%)
Place of birth for the foreign-born population - Bulgaria (%)
Place of birth for the foreign-born population - Croatia (%)
Place of birth for the foreign-born population - Czechoslovakia (%)
Place of birth for the foreign-born population - Hungary (%)
Place of birth for the foreign-born population - Latvia (%)
Place of birth for the foreign-born population - Lithuania (%)
Place of birth for the foreign-born population - North Macedonia (Macedonia) (%)
Place of birth for the foreign-born population - Moldova (%)
Place of birth for the foreign-born population - Poland (%)
Place of birth for the foreign-born population - Romania (%)
Place of birth for the foreign-born population - Russia (%)
Place of birth for the foreign-born population - Serbia (%)
Place of birth for the foreign-born population - Ukraine (%)
Place of birth for the foreign-born population - Other Eastern Europe (%)
Place of birth for the foreign-born population - China (%)
Place of birth for the foreign-born population - Hong Kong (%)
Place of birth for the foreign-born population - Taiwan (%)
Place of birth for the foreign-born population - Japan (%)
Place of birth for the foreign-born population - Korea (%)
Place of birth for the foreign-born population - Other Eastern Asia (%)
Place of birth for the foreign-born population - Afghanistan (%)
Place of birth for the foreign-born population - Bangladesh (%)
Place of birth for the foreign-born population - India (%)
Place of birth for the foreign-born population - Iran (%)
Place of birth for the foreign-born population - Kazakhstan (%)
Place of birth for the foreign-born population - Nepal (%)
Place of birth for the foreign-born population - Pakistan (%)
Place of birth for the foreign-born population - Sri Lanka (%)
Place of birth for the foreign-born population - Uzbekistan (%)
Place of birth for the foreign-born population - Other South Central Asia (%)
Place of birth for the foreign-born population - Burma (%)
Place of birth for the foreign-born population - Cambodia (%)
Place of birth for the foreign-born population - Indonesia (%)
Place of birth for the foreign-born population - Laos (%)
Place of birth for the foreign-born population - Malaysia (%)
Place of birth for the foreign-born population - Philippines (%)
Place of birth for the foreign-born population - Singapore (%)
Place of birth for the foreign-born population - Thailand (%)
Place of birth for the foreign-born population - Vietnam (%)
Place of birth for the foreign-born population - Other South Eastern Asia (%)
Place of birth for the foreign-born population - Armenia (%)
Place of birth for the foreign-born population - Iraq (%)
Place of birth for the foreign-born population - Israel (%)
Place of birth for the foreign-born population - Jordan (%)
Place of birth for the foreign-born population - Kuwait (%)
Place of birth for the foreign-born population - Lebanon (%)
Place of birth for the foreign-born population - Saudi Arabia (%)
Place of birth for the foreign-born population - Syria (%)
Place of birth for the foreign-born population - Turkey (%)
Place of birth for the foreign-born population - Yemen (%)
Place of birth for the foreign-born population - Other Western Asia (%)
Place of birth for the foreign-born population - Eritrea (%)
Place of birth for the foreign-born population - Ethiopia (%)
Place of birth for the foreign-born population - Kenya (%)
Place of birth for the foreign-born population - Somalia (%)
Place of birth for the foreign-born population - Uganda (%)
Place of birth for the foreign-born population - Zimbabwe (%)
Place of birth for the foreign-born population - Other Eastern Africa (%)
Place of birth for the foreign-born population - Cameroon (%)
Place of birth for the foreign-born population - Congo (%)
Place of birth for the foreign-born population - Democratic Republic of Congo (Zaire) (%)
Place of birth for the foreign-born population - Other Middle Africa (%)
Place of birth for the foreign-born population - Egypt (%)
Place of birth for the foreign-born population - Morocco (%)
Place of birth for the foreign-born population - Sudan (%)
Place of birth for the foreign-born population - Other Northern Africa (%)
Place of birth for the foreign-born population - South Africa (%)
Place of birth for the foreign-born population - Other Southern Africa (%)
Place of birth for the foreign-born population - Cabo Verde (%)
Place of birth for the foreign-born population - Ghana (%)
Place of birth for the foreign-born population - Liberia (%)
Place of birth for the foreign-born population - Nigeria (%)
Place of birth for the foreign-born population - Senegal (%)
Place of birth for the foreign-born population - Sierra Leone (%)
Place of birth for the foreign-born population - Other Western Africa (%)
Place of birth for the foreign-born population - Australia (%)
Place of birth for the foreign-born population - New Zealand (%)
Place of birth for the foreign-born population - Fiji (%)
Place of birth for the foreign-born population - Micronesia (%)
Place of birth for the foreign-born population - Bahamas (%)
Place of birth for the foreign-born population - Barbados (%)
Place of birth for the foreign-born population - Cuba (%)
Place of birth for the foreign-born population - Dominica (%)
Place of birth for the foreign-born population - Dominican Republic (%)
Place of birth for the foreign-born population - Grenada (%)
Place of birth for the foreign-born population - Haiti (%)
Place of birth for the foreign-born population - Jamaica (%)
Place of birth for the foreign-born population - St. Vincent and the Grenadines (%)
Place of birth for the foreign-born population - Trinidad and Tobago (%)
Place of birth for the foreign-born population - West Indies (%)
Place of birth for the foreign-born population - Other Caribbean (%)
Place of birth for the foreign-born population - Belize (%)
Place of birth for the foreign-born population - Costa Rica (%)
Place of birth for the foreign-born population - El Salvador (%)
Place of birth for the foreign-born population - Guatemala (%)
Place of birth for the foreign-born population - Honduras (%)
Place of birth for the foreign-born population - Mexico (%)
Place of birth for the foreign-born population - Nicaragua (%)
Place of birth for the foreign-born population - Panama (%)
Place of birth for the foreign-born population - Other Central America (%)
Place of birth for the foreign-born population - Argentina (%)
Place of birth for the foreign-born population - Bolivia (%)
Place of birth for the foreign-born population - Brazil (%)
Place of birth for the foreign-born population - Chile (%)
Place of birth for the foreign-born population - Colombia (%)
Place of birth for the foreign-born population - Ecuador (%)
Place of birth for the foreign-born population - Guyana (%)
Place of birth for the foreign-born population - Peru (%)
Place of birth for the foreign-born population - Uruguay (%)
Place of birth for the foreign-born population - Venezuela (%)
Place of birth for the foreign-born population - Other South America (%)
Place of birth for the foreign-born population - Canada (%)
Place of birth for the foreign-born population - Other Northern America (%)
Place of birth for the foreign-born population - Other (%)
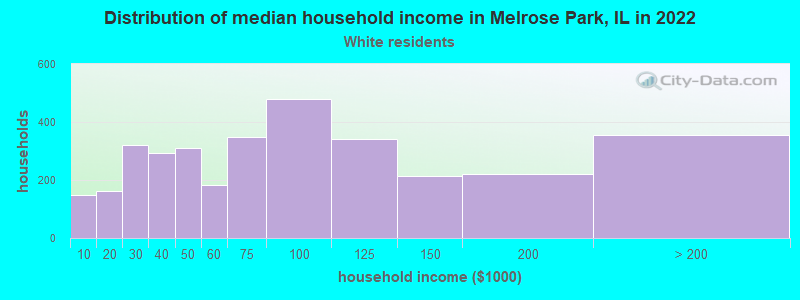
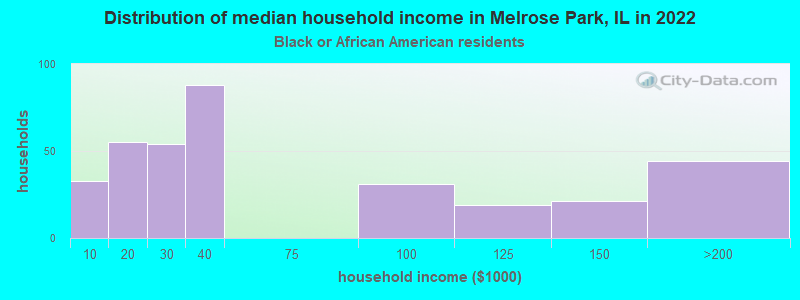
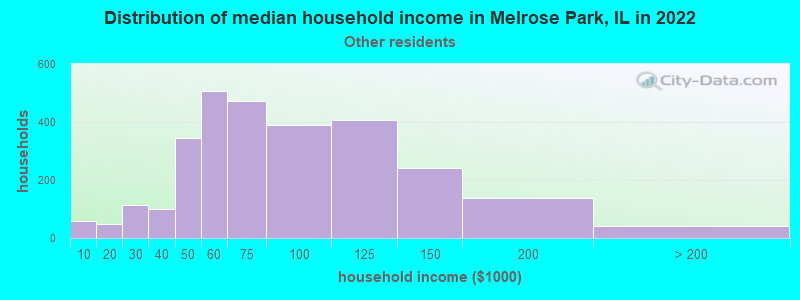
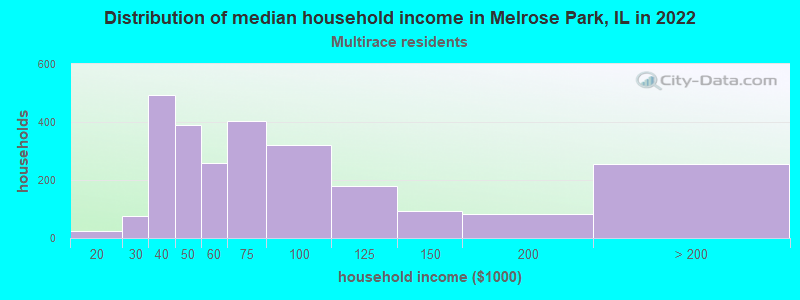
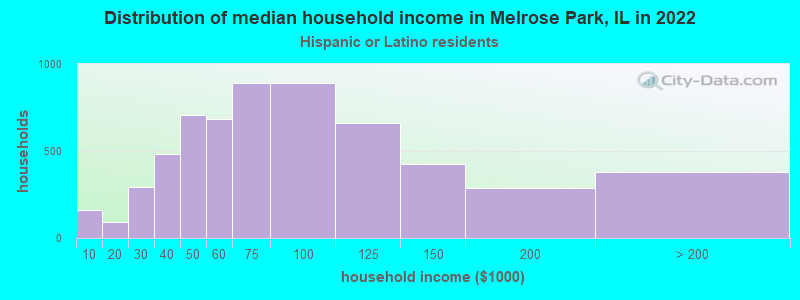
According to 2022 data, the most numerous races in Melrose Park, IL are White alone (3,929 residents), Hispanic (19,783 residents), and Black alone (923 residents). 27.6% of Melrose Park residents speak English at home. 35.2% of Melrose Park, IL residents are foreign-born (32.1% born in Latin America), which is 60.3% greater than the foreign-born rate of 14.0% across the entire state of Illinois.
Race distribution in Melrose Park
2000 2022
8,424,140 67.8% White alone 1,856,152 14.9% Black alone 1,530,262 12.3% Hispanic 419,916 3.4% Asian alone 153,996 1.2% Two or more races 13,479 0.1% Other race alone 18,232 0.1% American Indian alone 3,116 0.03% Native Hawaiian and Other
7,356,301 58.5% White alone 2,299,726 18.3% Hispanic 1,660,423 13.2% Black alone 747,296 5.9% Asian alone 458,599 3.6% Two or more races 45,386 0.4% Other race alone 10,405 0.08% American Indian alone 3,896 0.03% Native Hawaiian and Other
Income and house value in Melrose Park Median household income in 2022 $62,596 White non-Hispanic householders$34,592 Black householders$89,965 American Indian and Alaska Native householders$68,640 Some other race householders$60,002 Two or more races householders$66,963 Hispanic or Latino race householdersMedian 2022 house value $254,850 White Non-Hispanic householders$253,371 Black or African American householders $285,084 Asian householders$237,433 Some other race householders$302,994 Two or more races householders$245,977 Hispanic or Latino householders
Median age by race in Melrose Park
38.6 Median age for White residents37.2 40.6 29.9 Median age for Black or African American residents32.7 29.8 50.0 Median age for American Indian / Alaska Native residents65.2 23.5 41.2 Median age for Asian residents50.1 40.8 -687,999,999.3 Median age for Native Hawaiian / Pacific Islander residents-918,721,460.3 -610,229,276.3 28.9 Median age for Other race residents30.6 27.4 38.3 Median age for Two or more races residents39.7 36.5 58.0 Median age for White alone residents56.1 60.1 32.1 Median age for Hispanic or Latino residents33.9 30.1
Owner/renter occupied households by race in Melrose Park
House owners and renters - White residents 2,214 65.2% Owner occupied1,180 34.8% Renter occupiedHouse owners and renters - Black or African American residents 47 12.8% Owner occupied321 87.2% Renter occupiedHouse owners and renters - American Indian / Alaska Native residents 55 44.9% Owner occupied67 55.1% Renter occupiedHouse owners and renters - Asian residents 31 78.2% Owner occupied9 21.8% Renter occupiedHouse owners and renters - Other race residents 1,296 47.4% Owner occupied1,440 52.6% Renter occupiedHouse owners and renters - Two or more races residents 1,435 56.5% Owner occupied1,104 43.5% Renter occupiedHouse owners and renters - White alone residents 1,605 77.5% Owner occupied465 22.5% Renter occupiedHouse owners and renters - Hispanic or Latino residents 2,988 50.7% Owner occupied2,906 49.3% Renter occupied
Language usage in Melrose Park
English speakers - Total 27.6% of residents of Melrose Park speak English at home.
70.0% of residents speak Spanish at home 8,202 50.7% Speak English very well7,973 49.3% Speak English less than very well3.2% of residents speak other language at home 405 54.9% Speak English very well333 45.1% Speak English less than very well
English speakers - Born in the United States 53.0% of residents of Melrose Park speak English at home.
45.5% of residents speak Spanish at home 491 80.1% Speak English very well122 19.9% Speak English less than very well
English speakers - Native, born elsewhere 12.5% of residents of Melrose Park speak English at home.
83.2% of residents speak Spanish at home 341 42.5% Speak English very well462 57.5% Speak English less than very well1.9% of residents speak other language at home 18 100.0% Speak English less than very well
English speakers - Foreign-born 4.5% of residents of Melrose Park speak English at home.
90.0% of residents speak Spanish at home 2,075 26.6% Speak English very well5,735 73.4% Speak English less than very well6.6% of residents speak other language at home 276 48.0% Speak English very well299 52.0% Speak English less than very well
White (Caucasian) - Speak only English Native:
62.8% (3,555)Foreign-born:
3.0% (66)
White (Caucasian) - Speak another language Native:
29.7% (1,682)Foreign-born:
96.1% (2,086)
Black or African American - Speak another language Native:
2.9% (26)Foreign-born:
91.2% (12)
American Indian / Alaska Native - Speak only English Native:
23.2% (29)Foreign-born:
8.6% (14)
American Indian / Alaska Native - Speak another language Native:
80.0% (101)Foreign-born:
88.5% (148)
Asian - Speak only English Native:
77.7% (25)Foreign-born:
33.2% (22)
Asian - Speak another language Native:
22.5% (7)Foreign-born:
63.5% (41)
Other race - Speak only English Native:
20.3% (1,053)Foreign-born:
5.0% (188)
Other race - Speak another language Native:
79.3% (4,115)Foreign-born:
94.9% (3,528)
Two or more races - Speak only English Native:
17.1% (681)Foreign-born:
4.8% (173)
Two or more races - Speak another language Native:
86.5% (3,445)Foreign-born:
95.2% (3,410)
White alone - Speak only English Native:
92.6% (3,098)Foreign-born:
9.7% (48)
White alone - Speak another language Native:
7.3% (245)Foreign-born:
90.9% (448)
Hispanic or Latino - Speak only English Native:
19.2% (1,976)Foreign-born:
3.7% (299)
Hispanic or Latino - Speak another language Native:
79.9% (8,219)Foreign-born:
96.4% (7,841)
Foreign-born residents in Melrose Park 8,676 residents are foreign born (32.1% Latin America ).
This city:
35.2%Illinois:
14.1%
Marital status for residents in Melrose Park Marital status - White (Caucasian) population 15 years and over
Males 39.0% Never married48.2% Now married1.8% Separated5.3% Widowed5.7% DivorcedFemales 38.4% Never married40.5% Now married1.8% Separated7.5% Widowed11.8% DivorcedWomen who gave birth in the past 12 months Now married:
65.0% (33)Unmarried:
35.0% (18)
Women who did not give birth in the past 12 months Now married:
36.6% (701)Unmarried:
63.4% (1,216)
Marital status - Black or African American population 15 years and over
Males 76.9% Never married23.1% Now married0.0% Separated0.0% Widowed0.0% DivorcedFemales 53.1% Never married10.8% Now married14.0% Separated18.4% Widowed3.6% DivorcedWomen who gave birth in the past 12 months Now married:
0.0% (0)Unmarried:
100.0% (3)
Women who did not give birth in the past 12 months Now married:
0.0% (0)Unmarried:
100.0% (252)
Marital status - American Indian / Alaska Native population 15 years and over
Males 45.5% Never married0.0% Now married20.8% Separated0.0% Widowed33.8% DivorcedFemales 56.2% Never married6.7% Now married16.9% Separated14.6% Widowed5.6% DivorcedWomen who did not give birth in the past 12 months Now married:
27.6% (38)Unmarried:
72.4% (99)
Marital status - Asian population 15 years and over
Males 40.5% Never married38.1% Now married0.0% Separated21.4% Widowed0.0% DivorcedFemales 28.3% Never married56.6% Now married0.0% Separated15.1% Widowed0.0% DivorcedWomen who did not give birth in the past 12 months Now married:
53.1% (17)Unmarried:
46.9% (15)
Marital status - Other race population 15 years and over
Males 43.9% Never married46.2% Now married4.8% Separated2.0% Widowed3.1% DivorcedFemales 44.1% Never married47.6% Now married2.1% Separated3.0% Widowed3.1% DivorcedWomen who gave birth in the past 12 months Now married:
67.0% (76)Unmarried:
33.0% (37)
Women who did not give birth in the past 12 months Now married:
40.6% (914)Unmarried:
59.4% (1,337)
Marital status - Two or more races population 15 years and over
Males 59.3% Never married27.9% Now married0.5% Separated1.0% Widowed11.4% DivorcedFemales 38.6% Never married48.3% Now married1.9% Separated4.8% Widowed6.4% DivorcedWomen who gave birth in the past 12 months Now married:
100.0% (7)Unmarried:
0.0% (0)
Women who did not give birth in the past 12 months Now married:
50.9% (1,044)Unmarried:
49.1% (1,007)
Marital status - White alone, not Hispanic / Latino population 15 years and over
Males 32.5% Never married47.9% Now married0.3% Separated10.4% Widowed9.0% DivorcedFemales 29.8% Never married41.5% Now married0.8% Separated13.6% Widowed14.3% DivorcedWomen who gave birth in the past 12 months Now married:
100.0% (4)Unmarried:
0.0% (0)
Women who did not give birth in the past 12 months Now married:
31.8% (179)Unmarried:
68.2% (384)
Marital status - Hispanic or Latino population 15 years and over
Males 49.7% Never married39.7% Now married3.1% Separated1.2% Widowed6.2% DivorcedFemales 43.7% Never married44.6% Now married2.1% Separated3.5% Widowed6.1% DivorcedWomen who gave birth in the past 12 months Now married:
66.5% (107)Unmarried:
33.5% (54)
Women who did not give birth in the past 12 months Now married:
41.8% (2,152)Unmarried:
58.2% (2,994)
Ancestries in Melrose Park
953 5.3% Italian303 1.7% American211 1.2% Polish128 0.7% German105 0.6% Irish85 0.5% Albanian36 0.2% English36 0.2% Greek33 0.2% Swedish28 0.2% Lithuanian25 0.1% Jamaican24 0.1% Portuguese16 0.09% Slavic13 0.07% Iranian10 0.06% Jordanian9 0.05% Brazilian8 0.04% Luxembourger7 0.04% British6 0.03% Czech6 0.03% Hungarian5 0.03% Norwegian1 0.01% Dutch
Geographical mobility in Melrose Park Same house 1 year ago 7,737 90.9% White (Caucasian)754 82.1% Black or African American283 98.7% American Indian / Alaska Native96 99.0% Asian9,367 95.9% Other race6,563 86.4% Two or more races3,697 94.0% White alone, not Hispanic / Latino17,952 91.3% Hispanic or LatinoMoved within same county 574 6.7% White / Caucasian124 13.5% Black or African American363 3.7% Other race869 11.4% Two or more races161 4.1% White alone, not Hispanic / Latino1,367 7.0% Hispanic or LatinoMoved within same state 74 0.9% White / Caucasian34 3.7% Black or African American14 0.2% Two or more races18 0.5% White alone, not Hispanic / Latino84 0.4% Hispanic or LatinoMoved from different state 20 0.2% White / Caucasian18 0.2% Other race96 1.3% Two or more races20 0.5% White alone, not Hispanic / Latino96 0.5% Hispanic or LatinoMoved from abroad 46 0.5% White47 0.5% Other race15 0.4% White alone, not Hispanic / Latino102 0.5% Hispanic or Latino
Children Nativity (place of birth) in Melrose Park
Children under 6 years - Living with two parents Both parents native 298 100.0% NativeBoth parents foreign-born 398 100.0% NativeOne native, one foreign-born parent 213 100.0% NativeChildren under 6 years - Living with one parent Native parent 699 100.0% NativeForeign-born parent 180 100.0% NativeChildren 6 to 17 years - Living with two parents Both parents native 475 95.6% Native22 4.4% Foreign-bornBoth parents foreign-born 1,160 90.8% Native117 9.2% Foreign-bornOne native, one foreign-born parent 527 96.1% Native21 3.9% Foreign-bornChildren 6 to 17 years - Living with one parent Native parent 1,017 100.0% NativeForeign-born parent 694 52.8% Native621 47.2% Foreign-born
Grandparents responsible for own grandchildren in Melrose Park
Grandparents (30 to 59 years) White / Caucasian 89 78.6% Responsible for grandchildren24 21.4% Not responsible for grandchildrenOther race 24 17.1% Responsible for grandchildren115 82.9% Not responsible for grandchildrenWhite alone, not Hispanic / Latino 13 52.0% Responsible for grandchildren12 48.0% Not responsible for grandchildrenHispanic or Latino 147 57.2% Responsible for grandchildren110 42.8% Not responsible for grandchildren
Grandparents (60 years and over) White / Caucasian 23 100.0% Not responsible for grandchildrenOther race 141 100.0% Not responsible for grandchildrenHispanic or Latino 322 100.0% Not responsible for grandchildren