Races in Mercer Island, Washington (WA) Detailed Stats
Data:
Races - White alone (%)
Races - White alone (% change since 2000)
Races - Black alone (%)
Races - Black alone (% change since 2000)
Races - American Indian alone (%)
Races - American Indian alone (% change since 2000)
Races - Asian alone (%)
Races - Asian alone (% change since 2000)
Races - Hispanic (%)
Races - Hispanic (% change since 2000)
Races - Native Hawaiian and Other Pacific Islander alone (%)
Races - Native Hawaiian and Other Pacific Islander alone (% change since 2000)
Races - Two or more races(%)
Races - Two or more races(% change since 2000)
Races - Other race alone (%)
Races - Other race alone (% change since 2000)
Racial diversity
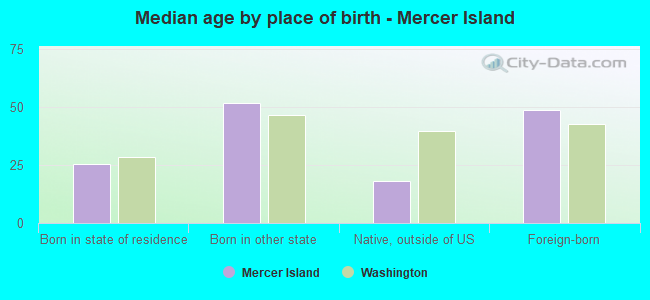
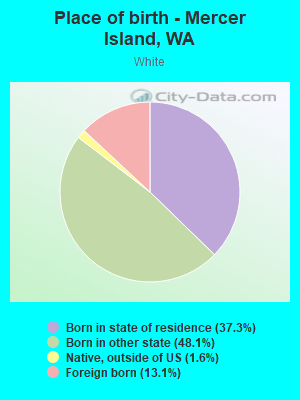
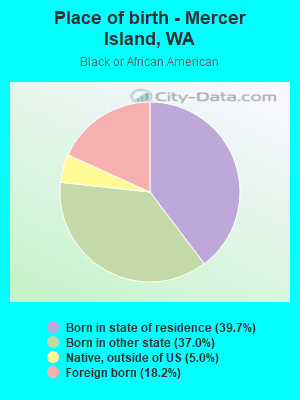
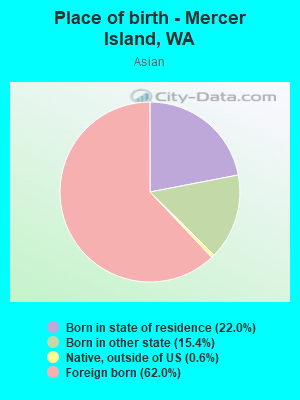
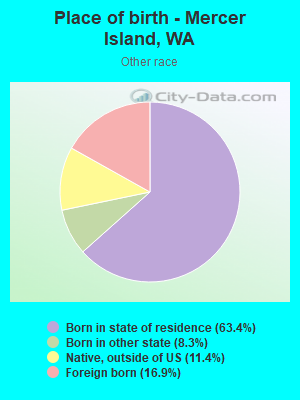
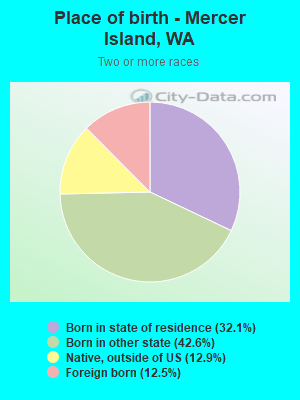
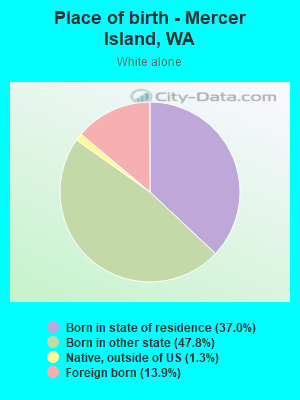
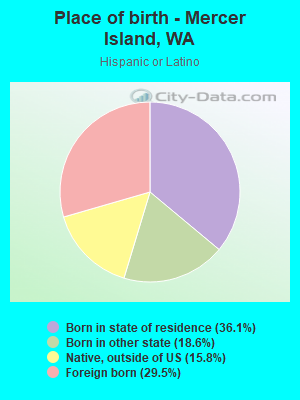
Place of birth - Born in state of residence (%)
Place of birth - Born in state of residence (%) - White
Place of birth - Born in state of residence (%) - Black or African American
Place of birth - Born in state of residence (%) - Asian
Place of birth - Born in state of residence (%) - Hispanic or Latino
Place of birth - Born in state of residence (%) - American Indian and Alaska Native
Place of birth - Born in state of residence (%) - Multirace
Place of birth - Born in state of residence (%) - Other Race
Place of birth - Born in other state (%)
Place of birth - Born in other state (%) - White
Place of birth - Born in other state (%) - Black or African American
Place of birth - Born in other state (%) - Asian
Place of birth - Born in other state (%) - Hispanic or Latino
Place of birth - Born in other state (%) - American Indian and Alaska Native
Place of birth - Born in other state (%) - Multirace
Place of birth - Born in other state (%) - Other Race
Place of birth - Native, outside of US (%)
Place of birth - Native, outside of US (%) - White
Place of birth - Native, outside of US (%) - Black or African American
Place of birth - Native, outside of US (%) - Asian
Place of birth - Native, outside of US (%) - Hispanic or Latino
Place of birth - Native, outside of US (%) - American Indian and Alaska Native
Place of birth - Native, outside of US (%) - Multirace
Place of birth - Native, outside of US (%) - Other Race
Place of birth - Foreign born (%)
Place of birth - Foreign born (%) - White
Place of birth - Foreign born (%) - Black or African American
Place of birth - Foreign born (%) - Asian
Place of birth - Foreign born (%) - Hispanic or Latino
Place of birth - Foreign born (%) - American Indian and Alaska Native
Place of birth - Foreign born (%) - Multirace
Place of birth - Foreign born (%) - Other Race
Residents speaking English at home (%)
Residents speaking English at home - Born in the United States (%)
Residents speaking English at home - Native, born elsewhere (%)
Residents speaking English at home - Foreign born (%)
Residents speaking Spanish at home (%)
Residents speaking Spanish at home - Born in the United States (%)
Residents speaking Spanish at home - Native, born elsewhere (%)
Residents speaking Spanish at home - Foreign born (%)
Residents speaking other language at home (%)
Residents speaking other language at home - Born in the United States (%)
Residents speaking other language at home - Native, born elsewhere (%)
Residents speaking other language at home - Foreign born (%)
Marital status - Never married (%)
Marital status - Now married (%)
Marital status - Separated (%)
Marital status - Widowed (%)
Marital status - Divorced (%)
Ancestries Reported - Arab (%)
Ancestries Reported - Czech (%)
Ancestries Reported - Danish (%)
Ancestries Reported - Dutch (%)
Ancestries Reported - English (%)
Ancestries Reported - French (%)
Ancestries Reported - French Canadian (%)
Ancestries Reported - German (%)
Ancestries Reported - Greek (%)
Ancestries Reported - Hungarian (%)
Ancestries Reported - Irish (%)
Ancestries Reported - Italian (%)
Ancestries Reported - Lithuanian (%)
Ancestries Reported - Norwegian (%)
Ancestries Reported - Polish (%)
Ancestries Reported - Portuguese (%)
Ancestries Reported - Russian (%)
Ancestries Reported - Scotch-Irish (%)
Ancestries Reported - Scottish (%)
Ancestries Reported - Slovak (%)
Ancestries Reported - Subsaharan African (%)
Ancestries Reported - Swedish (%)
Ancestries Reported - Swiss (%)
Ancestries Reported - Ukrainian (%)
Ancestries Reported - United States (%)
Ancestries Reported - Welsh (%)
Ancestries Reported - West Indian (%)
Ancestries Reported - Other (%)
Geographical mobility - Same house 1 year ago (%)
Geographical mobility - Same house 1 year ago (%) - White
Geographical mobility - Same house 1 year ago (%) - Black or African American
Geographical mobility - Same house 1 year ago (%) - Asian
Geographical mobility - Same house 1 year ago (%) - Hispanic or Latino
Geographical mobility - Same house 1 year ago (%) - American Indian and Alaska Native
Geographical mobility - Same house 1 year ago (%) - Multirace
Geographical mobility - Same house 1 year ago (%) - Other Race
Geographical mobility - Moved within same county (%)
Geographical mobility - Moved within same county (%) - White
Geographical mobility - Moved within same county (%) - Black or African American
Geographical mobility - Moved within same county (%) - Asian
Geographical mobility - Moved within same county (%) - Hispanic or Latino
Geographical mobility - Moved within same county (%) - American Indian and Alaska Native
Geographical mobility - Moved within same county (%) - Multirace
Geographical mobility - Moved within same county (%) - Other Race
Geographical mobility - Moved from different county within same state (%)
Geographical mobility - Moved from different county within same state (%) - White
Geographical mobility - Moved from different county within same state (%) - Black or African American
Geographical mobility - Moved from different county within same state (%) - Asian
Geographical mobility - Moved from different county within same state (%) - Hispanic or Latino
Geographical mobility - Moved from different county within same state (%) - American Indian and Alaska Native
Geographical mobility - Moved from different county within same state (%) - Multirace
Geographical mobility - Moved from different county within same state (%) - Other Race
Geographical mobility - Moved from different state (%)
Geographical mobility - Moved from different state (%) - White
Geographical mobility - Moved from different state (%) - Black or African American
Geographical mobility - Moved from different state (%) - Asian
Geographical mobility - Moved from different state (%) - Hispanic or Latino
Geographical mobility - Moved from different state (%) - American Indian and Alaska Native
Geographical mobility - Moved from different state (%) - Multirace
Geographical mobility - Moved from different state (%) - Other Race
Geographical mobility - Moved from abroad (%)
Geographical mobility - Moved from abroad (%) - White
Geographical mobility - Moved from abroad (%) - Black or African American
Geographical mobility - Moved from abroad (%) - Asian
Geographical mobility - Moved from abroad (%) - Hispanic or Latino
Geographical mobility - Moved from abroad (%) - American Indian and Alaska Native
Geographical mobility - Moved from abroad (%) - Multirace
Geographical mobility - Moved from abroad (%) - Other Race
Place of birth for the foreign-born population - Ireland (%)
Place of birth for the foreign-born population - Denmark (%)
Place of birth for the foreign-born population - Norway (%)
Place of birth for the foreign-born population - Sweden (%)
Place of birth for the foreign-born population - United Kingdom (%)
Place of birth for the foreign-born population - England (%)
Place of birth for the foreign-born population - Scotland (%)
Place of birth for the foreign-born population - Other Northern Europe (%)
Place of birth for the foreign-born population - Austria (%)
Place of birth for the foreign-born population - Belgium (%)
Place of birth for the foreign-born population - France (%)
Place of birth for the foreign-born population - Germany (%)
Place of birth for the foreign-born population - Netherlands (%)
Place of birth for the foreign-born population - Switzerland (%)
Place of birth for the foreign-born population - Other Western Europe (%)
Place of birth for the foreign-born population - Greece (%)
Place of birth for the foreign-born population - Italy (%)
Place of birth for the foreign-born population - Portugal (%)
Place of birth for the foreign-born population - Spain (%)
Place of birth for the foreign-born population - Other Southern Europe (%)
Place of birth for the foreign-born population - Albania (%)
Place of birth for the foreign-born population - Belarus (%)
Place of birth for the foreign-born population - Bosnia and Herzegovina (%)
Place of birth for the foreign-born population - Bulgaria (%)
Place of birth for the foreign-born population - Croatia (%)
Place of birth for the foreign-born population - Czechoslovakia (%)
Place of birth for the foreign-born population - Hungary (%)
Place of birth for the foreign-born population - Latvia (%)
Place of birth for the foreign-born population - Lithuania (%)
Place of birth for the foreign-born population - North Macedonia (Macedonia) (%)
Place of birth for the foreign-born population - Moldova (%)
Place of birth for the foreign-born population - Poland (%)
Place of birth for the foreign-born population - Romania (%)
Place of birth for the foreign-born population - Russia (%)
Place of birth for the foreign-born population - Serbia (%)
Place of birth for the foreign-born population - Ukraine (%)
Place of birth for the foreign-born population - Other Eastern Europe (%)
Place of birth for the foreign-born population - China (%)
Place of birth for the foreign-born population - Hong Kong (%)
Place of birth for the foreign-born population - Taiwan (%)
Place of birth for the foreign-born population - Japan (%)
Place of birth for the foreign-born population - Korea (%)
Place of birth for the foreign-born population - Other Eastern Asia (%)
Place of birth for the foreign-born population - Afghanistan (%)
Place of birth for the foreign-born population - Bangladesh (%)
Place of birth for the foreign-born population - India (%)
Place of birth for the foreign-born population - Iran (%)
Place of birth for the foreign-born population - Kazakhstan (%)
Place of birth for the foreign-born population - Nepal (%)
Place of birth for the foreign-born population - Pakistan (%)
Place of birth for the foreign-born population - Sri Lanka (%)
Place of birth for the foreign-born population - Uzbekistan (%)
Place of birth for the foreign-born population - Other South Central Asia (%)
Place of birth for the foreign-born population - Burma (%)
Place of birth for the foreign-born population - Cambodia (%)
Place of birth for the foreign-born population - Indonesia (%)
Place of birth for the foreign-born population - Laos (%)
Place of birth for the foreign-born population - Malaysia (%)
Place of birth for the foreign-born population - Philippines (%)
Place of birth for the foreign-born population - Singapore (%)
Place of birth for the foreign-born population - Thailand (%)
Place of birth for the foreign-born population - Vietnam (%)
Place of birth for the foreign-born population - Other South Eastern Asia (%)
Place of birth for the foreign-born population - Armenia (%)
Place of birth for the foreign-born population - Iraq (%)
Place of birth for the foreign-born population - Israel (%)
Place of birth for the foreign-born population - Jordan (%)
Place of birth for the foreign-born population - Kuwait (%)
Place of birth for the foreign-born population - Lebanon (%)
Place of birth for the foreign-born population - Saudi Arabia (%)
Place of birth for the foreign-born population - Syria (%)
Place of birth for the foreign-born population - Turkey (%)
Place of birth for the foreign-born population - Yemen (%)
Place of birth for the foreign-born population - Other Western Asia (%)
Place of birth for the foreign-born population - Eritrea (%)
Place of birth for the foreign-born population - Ethiopia (%)
Place of birth for the foreign-born population - Kenya (%)
Place of birth for the foreign-born population - Somalia (%)
Place of birth for the foreign-born population - Uganda (%)
Place of birth for the foreign-born population - Zimbabwe (%)
Place of birth for the foreign-born population - Other Eastern Africa (%)
Place of birth for the foreign-born population - Cameroon (%)
Place of birth for the foreign-born population - Congo (%)
Place of birth for the foreign-born population - Democratic Republic of Congo (Zaire) (%)
Place of birth for the foreign-born population - Other Middle Africa (%)
Place of birth for the foreign-born population - Egypt (%)
Place of birth for the foreign-born population - Morocco (%)
Place of birth for the foreign-born population - Sudan (%)
Place of birth for the foreign-born population - Other Northern Africa (%)
Place of birth for the foreign-born population - South Africa (%)
Place of birth for the foreign-born population - Other Southern Africa (%)
Place of birth for the foreign-born population - Cabo Verde (%)
Place of birth for the foreign-born population - Ghana (%)
Place of birth for the foreign-born population - Liberia (%)
Place of birth for the foreign-born population - Nigeria (%)
Place of birth for the foreign-born population - Senegal (%)
Place of birth for the foreign-born population - Sierra Leone (%)
Place of birth for the foreign-born population - Other Western Africa (%)
Place of birth for the foreign-born population - Australia (%)
Place of birth for the foreign-born population - New Zealand (%)
Place of birth for the foreign-born population - Fiji (%)
Place of birth for the foreign-born population - Micronesia (%)
Place of birth for the foreign-born population - Bahamas (%)
Place of birth for the foreign-born population - Barbados (%)
Place of birth for the foreign-born population - Cuba (%)
Place of birth for the foreign-born population - Dominica (%)
Place of birth for the foreign-born population - Dominican Republic (%)
Place of birth for the foreign-born population - Grenada (%)
Place of birth for the foreign-born population - Haiti (%)
Place of birth for the foreign-born population - Jamaica (%)
Place of birth for the foreign-born population - St. Vincent and the Grenadines (%)
Place of birth for the foreign-born population - Trinidad and Tobago (%)
Place of birth for the foreign-born population - West Indies (%)
Place of birth for the foreign-born population - Other Caribbean (%)
Place of birth for the foreign-born population - Belize (%)
Place of birth for the foreign-born population - Costa Rica (%)
Place of birth for the foreign-born population - El Salvador (%)
Place of birth for the foreign-born population - Guatemala (%)
Place of birth for the foreign-born population - Honduras (%)
Place of birth for the foreign-born population - Mexico (%)
Place of birth for the foreign-born population - Nicaragua (%)
Place of birth for the foreign-born population - Panama (%)
Place of birth for the foreign-born population - Other Central America (%)
Place of birth for the foreign-born population - Argentina (%)
Place of birth for the foreign-born population - Bolivia (%)
Place of birth for the foreign-born population - Brazil (%)
Place of birth for the foreign-born population - Chile (%)
Place of birth for the foreign-born population - Colombia (%)
Place of birth for the foreign-born population - Ecuador (%)
Place of birth for the foreign-born population - Guyana (%)
Place of birth for the foreign-born population - Peru (%)
Place of birth for the foreign-born population - Uruguay (%)
Place of birth for the foreign-born population - Venezuela (%)
Place of birth for the foreign-born population - Other South America (%)
Place of birth for the foreign-born population - Canada (%)
Place of birth for the foreign-born population - Other Northern America (%)
Place of birth for the foreign-born population - Other (%)
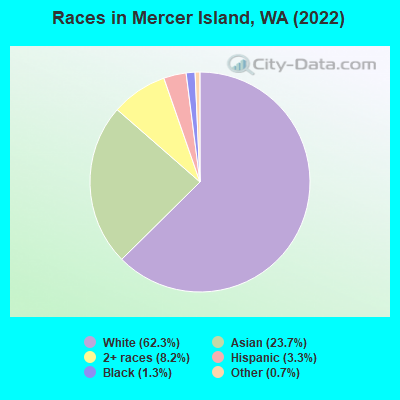
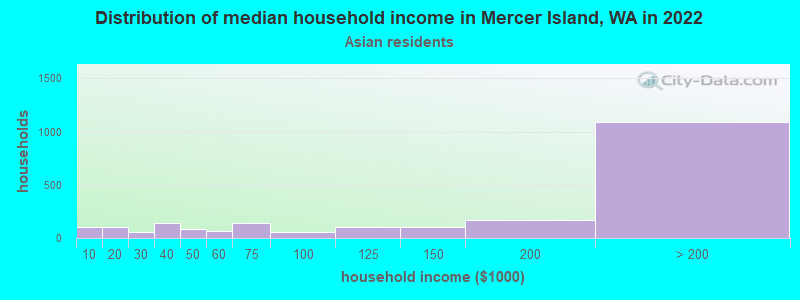
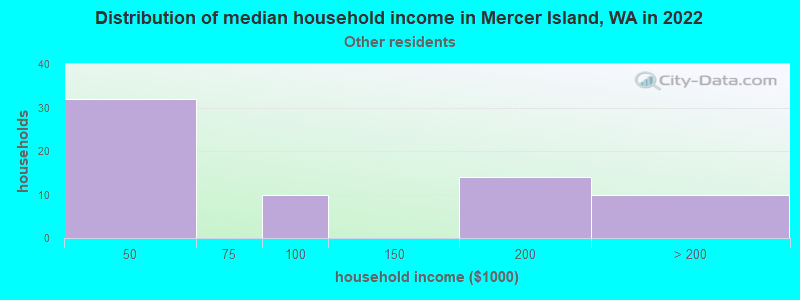
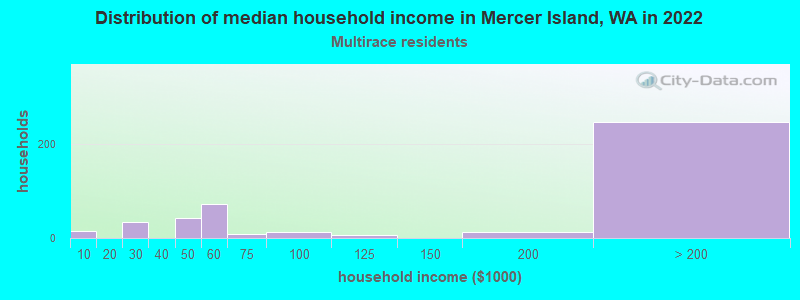
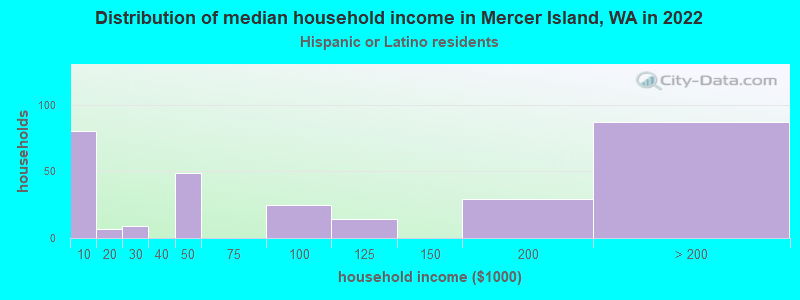
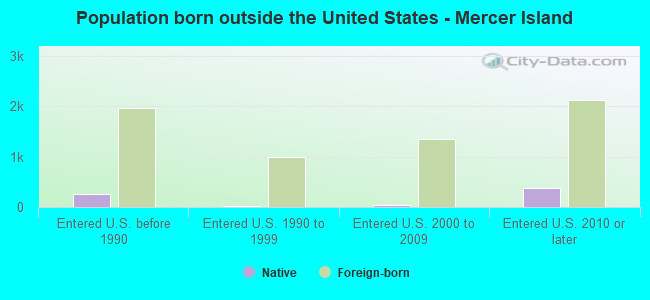
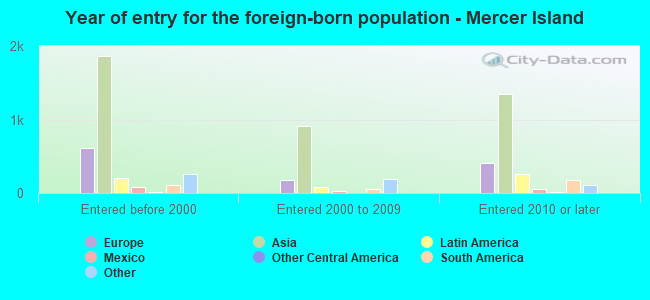
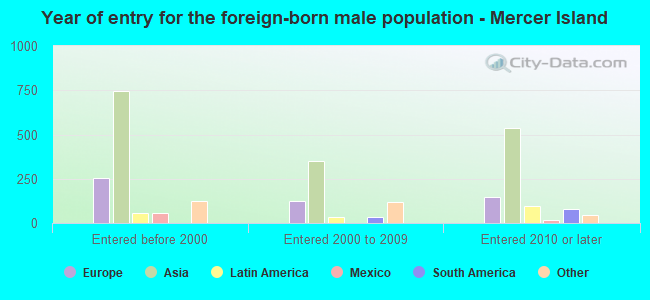
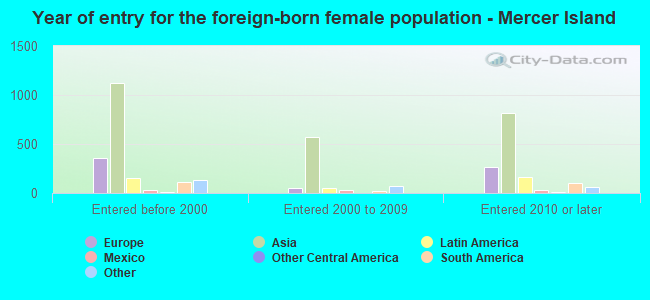
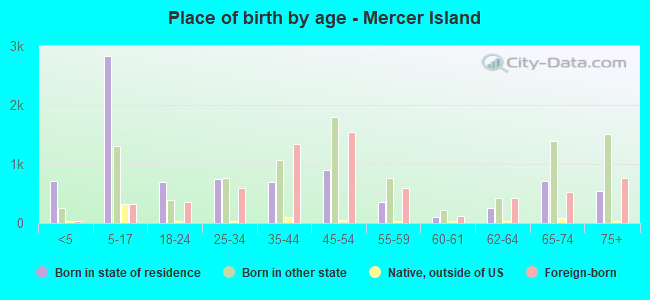
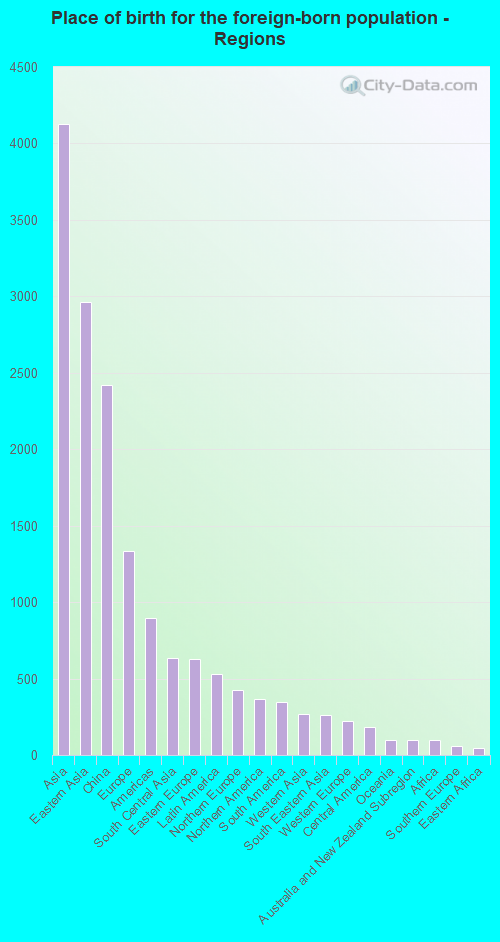
According to 2022 data, the most numerous races in Mercer Island, WA are White alone (15,963 residents), Hispanic (857 residents), and Asian alone (6,057 residents). 73.9% of Mercer Island residents speak English at home. 25.6% of Mercer Island, WA residents are foreign-born (15.5% born in Asia, 5.0% born in Europe), which is 41.5% greater than the foreign-born rate of 15.0% across the entire state of Washington.
Race distribution in Mercer Island
2000 2022
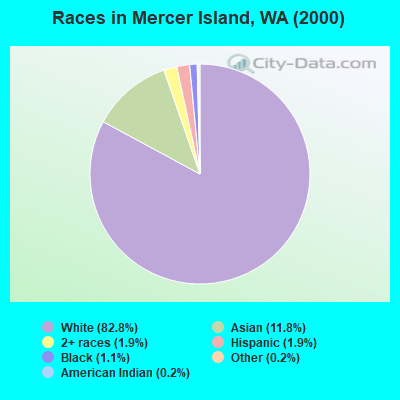
4,652,490 78.9% White alone 441,509 7.5% Hispanic 319,401 5.4% Asian alone 184,631 3.1% Black alone 175,926 3.0% Two or more races 85,396 1.4% American Indian alone 22,779 0.4% Native Hawaiian and Other 11,989 0.2% Other race alone
4,941,456 63.5% White alone 1,093,313 14.0% Hispanic 755,832 9.7% Asian alone 523,448 6.7% Two or more races 299,537 3.8% Black alone 69,024 0.9% American Indian alone 52,231 0.7% Native Hawaiian and Other 50,945 0.7% Other race alone
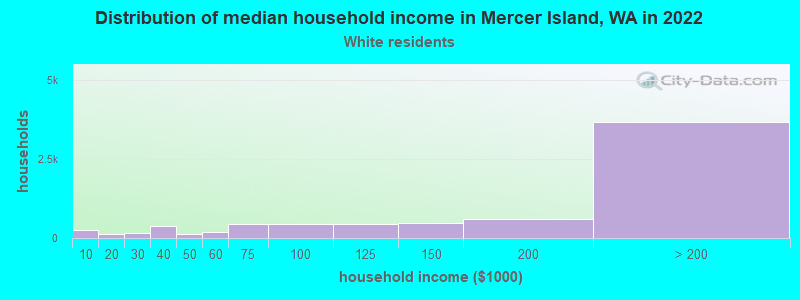
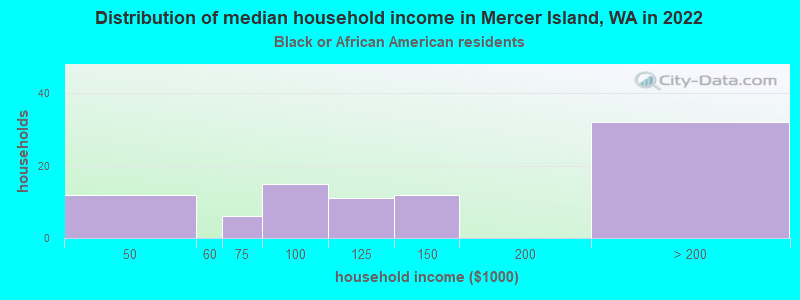
Income and house value in Mercer Island Median household income in 2022 $193,423 White non-Hispanic householders$116,034 Black householders$198,676 Asian householdersover $200,000 Two or more races householdersMedian 2022 house value over $1,000,000 White Non-Hispanic householdersover $1,000,000 Black or African American householdersover $1,000,000 American Indian or Alaska Native householders over $1,000,000 Asian householdersover $1,000,000 Native Hawaiian and other Pacific Islander householders$595,894 Some other race householdersover $1,000,000 Two or more races householdersover $1,000,000 Hispanic or Latino householders
Median age by race in Mercer Island
49.5 Median age for White residents48.9 50.6 30.1 Median age for Black or African American residents35.1 17.5 -639,412,997.3 Median age for American Indian / Alaska Native residents-658,092,175.1 -631,249,999.4 45.0 Median age for Asian residents42.6 46.1 -653,927,812.5 Median age for Native Hawaiian / Pacific Islander residents-664,509,168.7 -651,945,320.1 27.5 Median age for Other race residents17.9 28.0 16.6 Median age for Two or more races residents18.2 14.4 49.3 Median age for White alone residents49.0 50.4 35.4 Median age for Hispanic or Latino residents31.8 37.4
Owner/renter occupied households by race in Mercer Island
House owners and renters - White residents 4,896 68.5% Owner occupied2,254 31.5% Renter occupiedHouse owners and renters - Black or African American residents 44 55.6% Owner occupied35 44.4% Renter occupiedHouse owners and renters - American Indian / Alaska Native residents 12 100.0% Owner occupiedHouse owners and renters - Asian residents 1,465 66.7% Owner occupied730 33.3% Renter occupiedHouse owners and renters - Other race residents 68 85.6% Owner occupied11 14.4% Renter occupiedHouse owners and renters - Two or more races residents 247 57.2% Owner occupied185 42.8% Renter occupiedHouse owners and renters - White alone residents 4,882 68.1% Owner occupied2,291 31.9% Renter occupiedHouse owners and renters - Hispanic or Latino residents 233 73.7% Owner occupied83 26.3% Renter occupied
Language usage in Mercer Island
English speakers - Total 73.9% of residents of Mercer Island speak English at home.
2.6% of residents speak Spanish at home 530 83.6% Speak English very well104 16.4% Speak English less than very well23.1% of residents speak other language at home 3,891 68.5% Speak English very well1,793 31.5% Speak English less than very well
English speakers - Born in the United States 93.2% of residents of Mercer Island speak English at home.
1.3% of residents speak Spanish at home 121 100.0% Speak English very well5.2% of residents speak other language at home 482 96.4% Speak English very well18 3.6% Speak English less than very well
English speakers - Native, born elsewhere 74.4% of residents of Mercer Island speak English at home.
7.1% of residents speak Spanish at home 48 100.0% Speak English very well15.2% of residents speak other language at home 102 100.0% Speak English very well
English speakers - Foreign-born 26.5% of residents of Mercer Island speak English at home.
5.1% of residents speak Spanish at home 241 72.6% Speak English very well91 27.4% Speak English less than very well68.3% of residents speak other language at home 2,753 61.5% Speak English very well1,727 38.5% Speak English less than very well
White (Caucasian) - Speak only English Native:
95.4% (12,697)Foreign-born:
45.7% (950)
White (Caucasian) - Speak another language Native:
4.6% (618)Foreign-born:
53.8% (1,118)
Black or African American - Speak only English Native:
86.1% (199)Foreign-born:
28.8% (18)
Black or African American - Speak another language Native:
13.9% (32)Foreign-born:
73.4% (46)
Asian - Speak only English Native:
78.0% (1,628)Foreign-born:
15.3% (580)
Asian - Speak another language Native:
18.7% (391)Foreign-born:
84.8% (3,219)
Other race - Speak another language Native:
53.0% (124)Foreign-born:
100.0% (60)
Two or more races - Speak only English Native:
86.4% (1,811)Foreign-born:
27.3% (92)
Two or more races - Speak another language Native:
13.1% (275)Foreign-born:
72.3% (244)
White alone - Speak only English Native:
94.9% (12,688)Foreign-born:
43.3% (967)
White alone - Speak another language Native:
5.2% (693)Foreign-born:
54.9% (1,225)
Hispanic or Latino - Speak only English Native:
67.9% (365)Foreign-born:
20.3% (53)
Hispanic or Latino - Speak another language Native:
31.2% (167)Foreign-born:
77.9% (202)
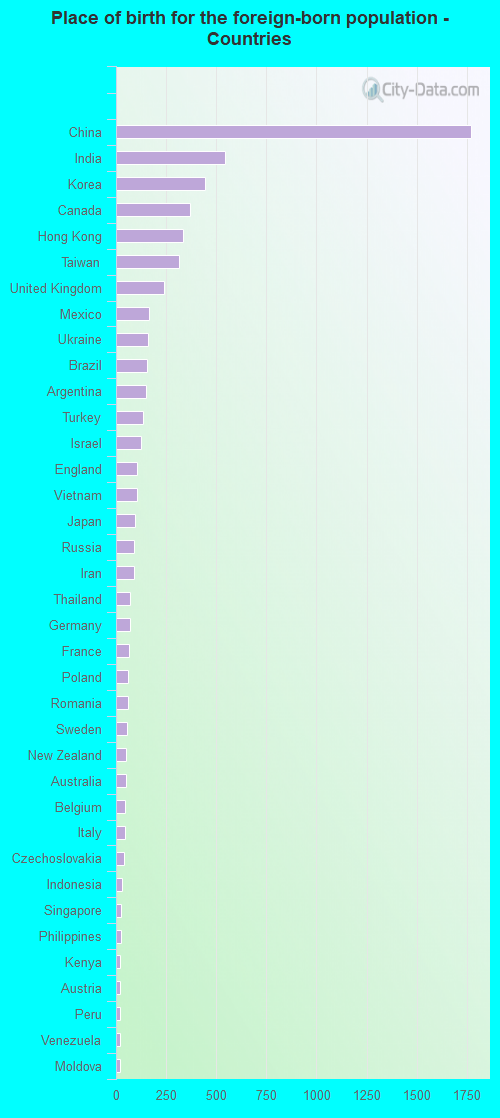
Foreign-born residents in Mercer Island 6,560 residents are foreign born (15.5% Asia , 5.0% Europe ).
This city:
25.6%Washington:
14.9%
Marital status for residents in Mercer Island Marital status - White (Caucasian) population 15 years and over
Males 20.9% Never married70.0% Now married0.3% Separated2.9% Widowed5.9% DivorcedFemales 20.2% Never married58.6% Now married0.3% Separated9.4% Widowed11.5% DivorcedWomen who gave birth in the past 12 months Now married:
91.9% (104)Unmarried:
8.1% (9)
Women who did not give birth in the past 12 months Now married:
55.0% (1,587)Unmarried:
45.0% (1,299)
Marital status - Black or African American population 15 years and over
Males 30.9% Never married52.9% Now married0.0% Separated14.7% Widowed1.5% DivorcedFemales 49.1% Never married40.7% Now married0.0% Separated10.2% Widowed0.0% DivorcedWomen who did not give birth in the past 12 months Now married:
27.4% (20)Unmarried:
72.6% (54)
Marital status - Asian population 15 years and over
Males 24.6% Never married73.5% Now married0.0% Separated0.7% Widowed1.2% DivorcedFemales 18.9% Never married67.4% Now married0.9% Separated8.7% Widowed4.1% DivorcedWomen who gave birth in the past 12 months Now married:
100.0% (37)Unmarried:
0.0% (0)
Women who did not give birth in the past 12 months Now married:
66.2% (1,065)Unmarried:
33.8% (543)
Marital status - Other race population 15 years and over
Males 10.0% Never married76.2% Now married0.0% Separated0.0% Widowed13.7% DivorcedFemales 15.7% Never married84.3% Now married0.0% Separated0.0% Widowed0.0% DivorcedWomen who did not give birth in the past 12 months Now married:
81.1% (106)Unmarried:
18.9% (25)
Marital status - Two or more races population 15 years and over
Males 52.3% Never married37.2% Now married2.8% Separated0.0% Widowed7.7% DivorcedFemales 37.4% Never married52.9% Now married1.4% Separated5.0% Widowed3.3% DivorcedWomen who did not give birth in the past 12 months Now married:
52.0% (280)Unmarried:
48.0% (258)
Marital status - White alone, not Hispanic / Latino population 15 years and over
Males 20.4% Never married70.5% Now married0.3% Separated2.9% Widowed5.9% DivorcedFemales 20.3% Never married58.7% Now married0.2% Separated9.5% Widowed11.3% DivorcedWomen who gave birth in the past 12 months Now married:
90.8% (94)Unmarried:
9.2% (10)
Women who did not give birth in the past 12 months Now married:
55.0% (1,617)Unmarried:
45.0% (1,322)
Marital status - Hispanic or Latino population 15 years and over
Males 32.1% Never married62.2% Now married0.0% Separated0.0% Widowed5.8% DivorcedFemales 30.1% Never married52.2% Now married2.3% Separated8.7% Widowed6.7% DivorcedWomen who gave birth in the past 12 months Now married:
100.0% (15)Unmarried:
0.0% (0)
Women who did not give birth in the past 12 months Now married:
62.2% (116)Unmarried:
37.8% (71)
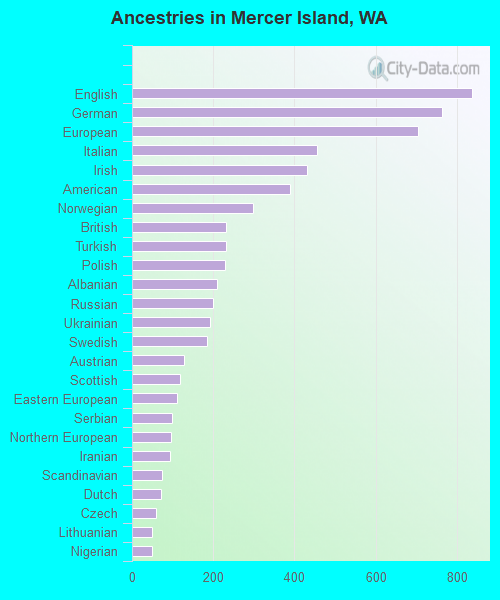
Ancestries in Mercer Island
837 6.2% English762 5.6% German704 5.2% European456 3.4% Italian432 3.2% Irish388 2.9% American297 2.2% Norwegian232 1.7% British232 1.7% Turkish229 1.7% Polish210 1.5% Albanian200 1.5% Russian192 1.4% Ukrainian184 1.4% Swedish129 0.9% Austrian117 0.9% Scottish110 0.8% Eastern European99 0.7% Serbian97 0.7% Northern European94 0.7% Iranian75 0.6% Scandinavian72 0.5% Dutch60 0.4% Czech49 0.4% Lithuanian49 0.4% Nigerian47 0.3% French42 0.3% Scotch-Irish35 0.3% Romanian28 0.2% Canadian26 0.2% Belgian26 0.2% Yugoslavian25 0.2% Brazilian24 0.2% Danish23 0.2% Hungarian23 0.2% Greek22 0.2% Guyanese21 0.2% African17 0.1% French Canadian14 0.1% Finnish13 0.10% Swiss13 0.10% Armenian11 0.08% Egyptian11 0.08% Slovak11 0.08% Portuguese9 0.07% Israeli8 0.06% Welsh6 0.04% Kenyan5 0.04% Slavic4 0.03% Pennsylvania German4 0.03% Senegalese4 0.03% Estonian2 0.01% South African
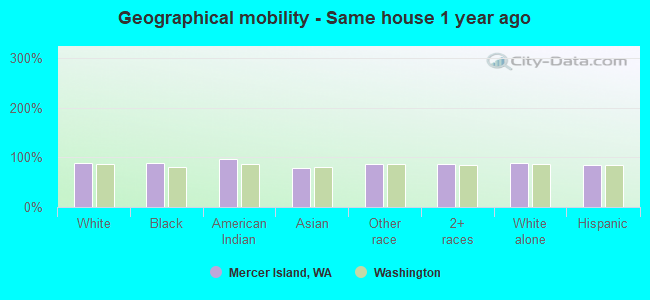
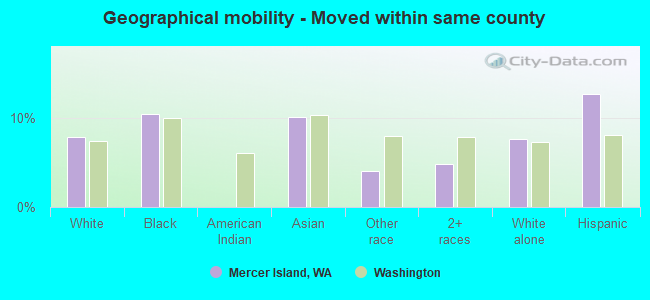
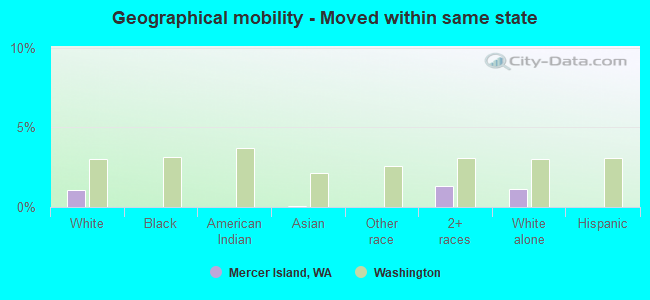
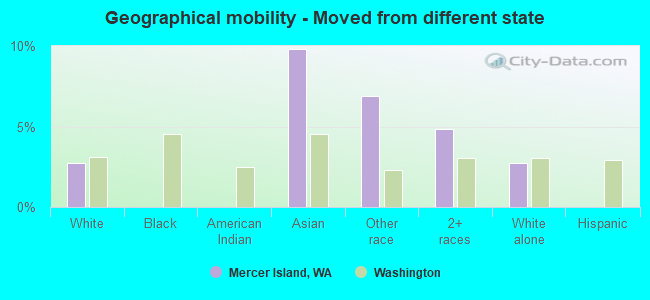
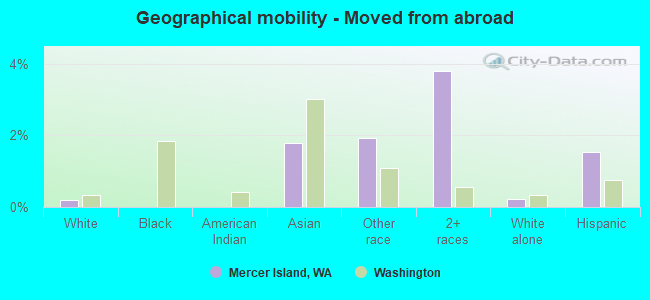
Geographical mobility in Mercer Island Same house 1 year ago 13,956 88.5% White (Caucasian)285 89.3% Black or African American25 96.7% American Indian / Alaska Native4,795 78.8% Asian304 86.9% Other race2,305 86.1% Two or more races14,118 88.7% White alone, not Hispanic / Latino719 85.0% Hispanic or LatinoMoved within same county 1,241 7.9% White / Caucasian33 10.3% Black or African American614 10.1% Asian14 4.0% Other race128 4.8% Two or more races1,202 7.5% White alone, not Hispanic / Latino106 12.6% Hispanic or LatinoMoved within same state 170 1.1% White / Caucasian4 0.1% Asian35 1.3% Two or more races175 1.1% White alone, not Hispanic / LatinoMoved from different state 427 2.7% White / Caucasian598 9.8% Asian24 6.9% Other race129 4.8% Two or more races440 2.8% White alone, not Hispanic / LatinoMoved from abroad 31 0.2% White108 1.8% Asian7 1.9% Other race101 3.8% Two or more races34 0.2% White alone, not Hispanic / Latino13 1.5% Hispanic or Latino
Children Nativity (place of birth) in Mercer Island
Children under 6 years - Living with two parents Both parents native 469 100.0% NativeBoth parents foreign-born 333 100.0% NativeOne native, one foreign-born parent 298 100.0% NativeChildren under 6 years - Living with one parent Native parent 39 100.0% NativeForeign-born parent 28 100.0% NativeChildren 6 to 17 years - Living with two parents Both parents native 2,235 100.0% NativeBoth parents foreign-born 740 73.3% Native269 26.7% Foreign-bornOne native, one foreign-born parent 639 97.9% Native14 2.1% Foreign-bornChildren 6 to 17 years - Living with one parent Native parent 469 100.0% NativeForeign-born parent 73 53.9% Native62 46.1% Foreign-born