Races in Mesquite, Nevada (NV) Detailed Stats
Data:
Races - White alone (%)
Races - White alone (% change since 2000)
Races - Black alone (%)
Races - Black alone (% change since 2000)
Races - American Indian alone (%)
Races - American Indian alone (% change since 2000)
Races - Asian alone (%)
Races - Asian alone (% change since 2000)
Races - Hispanic (%)
Races - Hispanic (% change since 2000)
Races - Native Hawaiian and Other Pacific Islander alone (%)
Races - Native Hawaiian and Other Pacific Islander alone (% change since 2000)
Races - Two or more races(%)
Races - Two or more races(% change since 2000)
Races - Other race alone (%)
Races - Other race alone (% change since 2000)
Racial diversity
Place of birth - Born in state of residence (%)
Place of birth - Born in state of residence (%) - White
Place of birth - Born in state of residence (%) - Black or African American
Place of birth - Born in state of residence (%) - Asian
Place of birth - Born in state of residence (%) - Hispanic or Latino
Place of birth - Born in state of residence (%) - American Indian and Alaska Native
Place of birth - Born in state of residence (%) - Multirace
Place of birth - Born in state of residence (%) - Other Race
Place of birth - Born in other state (%)
Place of birth - Born in other state (%) - White
Place of birth - Born in other state (%) - Black or African American
Place of birth - Born in other state (%) - Asian
Place of birth - Born in other state (%) - Hispanic or Latino
Place of birth - Born in other state (%) - American Indian and Alaska Native
Place of birth - Born in other state (%) - Multirace
Place of birth - Born in other state (%) - Other Race
Place of birth - Native, outside of US (%)
Place of birth - Native, outside of US (%) - White
Place of birth - Native, outside of US (%) - Black or African American
Place of birth - Native, outside of US (%) - Asian
Place of birth - Native, outside of US (%) - Hispanic or Latino
Place of birth - Native, outside of US (%) - American Indian and Alaska Native
Place of birth - Native, outside of US (%) - Multirace
Place of birth - Native, outside of US (%) - Other Race
Place of birth - Foreign born (%)
Place of birth - Foreign born (%) - White
Place of birth - Foreign born (%) - Black or African American
Place of birth - Foreign born (%) - Asian
Place of birth - Foreign born (%) - Hispanic or Latino
Place of birth - Foreign born (%) - American Indian and Alaska Native
Place of birth - Foreign born (%) - Multirace
Place of birth - Foreign born (%) - Other Race
Residents speaking English at home (%)
Residents speaking English at home - Born in the United States (%)
Residents speaking English at home - Native, born elsewhere (%)
Residents speaking English at home - Foreign born (%)
Residents speaking Spanish at home (%)
Residents speaking Spanish at home - Born in the United States (%)
Residents speaking Spanish at home - Native, born elsewhere (%)
Residents speaking Spanish at home - Foreign born (%)
Residents speaking other language at home (%)
Residents speaking other language at home - Born in the United States (%)
Residents speaking other language at home - Native, born elsewhere (%)
Residents speaking other language at home - Foreign born (%)
Marital status - Never married (%)
Marital status - Now married (%)
Marital status - Separated (%)
Marital status - Widowed (%)
Marital status - Divorced (%)
Ancestries Reported - Arab (%)
Ancestries Reported - Czech (%)
Ancestries Reported - Danish (%)
Ancestries Reported - Dutch (%)
Ancestries Reported - English (%)
Ancestries Reported - French (%)
Ancestries Reported - French Canadian (%)
Ancestries Reported - German (%)
Ancestries Reported - Greek (%)
Ancestries Reported - Hungarian (%)
Ancestries Reported - Irish (%)
Ancestries Reported - Italian (%)
Ancestries Reported - Lithuanian (%)
Ancestries Reported - Norwegian (%)
Ancestries Reported - Polish (%)
Ancestries Reported - Portuguese (%)
Ancestries Reported - Russian (%)
Ancestries Reported - Scotch-Irish (%)
Ancestries Reported - Scottish (%)
Ancestries Reported - Slovak (%)
Ancestries Reported - Subsaharan African (%)
Ancestries Reported - Swedish (%)
Ancestries Reported - Swiss (%)
Ancestries Reported - Ukrainian (%)
Ancestries Reported - United States (%)
Ancestries Reported - Welsh (%)
Ancestries Reported - West Indian (%)
Ancestries Reported - Other (%)
Geographical mobility - Same house 1 year ago (%)
Geographical mobility - Same house 1 year ago (%) - White
Geographical mobility - Same house 1 year ago (%) - Black or African American
Geographical mobility - Same house 1 year ago (%) - Asian
Geographical mobility - Same house 1 year ago (%) - Hispanic or Latino
Geographical mobility - Same house 1 year ago (%) - American Indian and Alaska Native
Geographical mobility - Same house 1 year ago (%) - Multirace
Geographical mobility - Same house 1 year ago (%) - Other Race
Geographical mobility - Moved within same county (%)
Geographical mobility - Moved within same county (%) - White
Geographical mobility - Moved within same county (%) - Black or African American
Geographical mobility - Moved within same county (%) - Asian
Geographical mobility - Moved within same county (%) - Hispanic or Latino
Geographical mobility - Moved within same county (%) - American Indian and Alaska Native
Geographical mobility - Moved within same county (%) - Multirace
Geographical mobility - Moved within same county (%) - Other Race
Geographical mobility - Moved from different county within same state (%)
Geographical mobility - Moved from different county within same state (%) - White
Geographical mobility - Moved from different county within same state (%) - Black or African American
Geographical mobility - Moved from different county within same state (%) - Asian
Geographical mobility - Moved from different county within same state (%) - Hispanic or Latino
Geographical mobility - Moved from different county within same state (%) - American Indian and Alaska Native
Geographical mobility - Moved from different county within same state (%) - Multirace
Geographical mobility - Moved from different county within same state (%) - Other Race
Geographical mobility - Moved from different state (%)
Geographical mobility - Moved from different state (%) - White
Geographical mobility - Moved from different state (%) - Black or African American
Geographical mobility - Moved from different state (%) - Asian
Geographical mobility - Moved from different state (%) - Hispanic or Latino
Geographical mobility - Moved from different state (%) - American Indian and Alaska Native
Geographical mobility - Moved from different state (%) - Multirace
Geographical mobility - Moved from different state (%) - Other Race
Geographical mobility - Moved from abroad (%)
Geographical mobility - Moved from abroad (%) - White
Geographical mobility - Moved from abroad (%) - Black or African American
Geographical mobility - Moved from abroad (%) - Asian
Geographical mobility - Moved from abroad (%) - Hispanic or Latino
Geographical mobility - Moved from abroad (%) - American Indian and Alaska Native
Geographical mobility - Moved from abroad (%) - Multirace
Geographical mobility - Moved from abroad (%) - Other Race
Place of birth for the foreign-born population - Ireland (%)
Place of birth for the foreign-born population - Denmark (%)
Place of birth for the foreign-born population - Norway (%)
Place of birth for the foreign-born population - Sweden (%)
Place of birth for the foreign-born population - United Kingdom (%)
Place of birth for the foreign-born population - England (%)
Place of birth for the foreign-born population - Scotland (%)
Place of birth for the foreign-born population - Other Northern Europe (%)
Place of birth for the foreign-born population - Austria (%)
Place of birth for the foreign-born population - Belgium (%)
Place of birth for the foreign-born population - France (%)
Place of birth for the foreign-born population - Germany (%)
Place of birth for the foreign-born population - Netherlands (%)
Place of birth for the foreign-born population - Switzerland (%)
Place of birth for the foreign-born population - Other Western Europe (%)
Place of birth for the foreign-born population - Greece (%)
Place of birth for the foreign-born population - Italy (%)
Place of birth for the foreign-born population - Portugal (%)
Place of birth for the foreign-born population - Spain (%)
Place of birth for the foreign-born population - Other Southern Europe (%)
Place of birth for the foreign-born population - Albania (%)
Place of birth for the foreign-born population - Belarus (%)
Place of birth for the foreign-born population - Bosnia and Herzegovina (%)
Place of birth for the foreign-born population - Bulgaria (%)
Place of birth for the foreign-born population - Croatia (%)
Place of birth for the foreign-born population - Czechoslovakia (%)
Place of birth for the foreign-born population - Hungary (%)
Place of birth for the foreign-born population - Latvia (%)
Place of birth for the foreign-born population - Lithuania (%)
Place of birth for the foreign-born population - North Macedonia (Macedonia) (%)
Place of birth for the foreign-born population - Moldova (%)
Place of birth for the foreign-born population - Poland (%)
Place of birth for the foreign-born population - Romania (%)
Place of birth for the foreign-born population - Russia (%)
Place of birth for the foreign-born population - Serbia (%)
Place of birth for the foreign-born population - Ukraine (%)
Place of birth for the foreign-born population - Other Eastern Europe (%)
Place of birth for the foreign-born population - China (%)
Place of birth for the foreign-born population - Hong Kong (%)
Place of birth for the foreign-born population - Taiwan (%)
Place of birth for the foreign-born population - Japan (%)
Place of birth for the foreign-born population - Korea (%)
Place of birth for the foreign-born population - Other Eastern Asia (%)
Place of birth for the foreign-born population - Afghanistan (%)
Place of birth for the foreign-born population - Bangladesh (%)
Place of birth for the foreign-born population - India (%)
Place of birth for the foreign-born population - Iran (%)
Place of birth for the foreign-born population - Kazakhstan (%)
Place of birth for the foreign-born population - Nepal (%)
Place of birth for the foreign-born population - Pakistan (%)
Place of birth for the foreign-born population - Sri Lanka (%)
Place of birth for the foreign-born population - Uzbekistan (%)
Place of birth for the foreign-born population - Other South Central Asia (%)
Place of birth for the foreign-born population - Burma (%)
Place of birth for the foreign-born population - Cambodia (%)
Place of birth for the foreign-born population - Indonesia (%)
Place of birth for the foreign-born population - Laos (%)
Place of birth for the foreign-born population - Malaysia (%)
Place of birth for the foreign-born population - Philippines (%)
Place of birth for the foreign-born population - Singapore (%)
Place of birth for the foreign-born population - Thailand (%)
Place of birth for the foreign-born population - Vietnam (%)
Place of birth for the foreign-born population - Other South Eastern Asia (%)
Place of birth for the foreign-born population - Armenia (%)
Place of birth for the foreign-born population - Iraq (%)
Place of birth for the foreign-born population - Israel (%)
Place of birth for the foreign-born population - Jordan (%)
Place of birth for the foreign-born population - Kuwait (%)
Place of birth for the foreign-born population - Lebanon (%)
Place of birth for the foreign-born population - Saudi Arabia (%)
Place of birth for the foreign-born population - Syria (%)
Place of birth for the foreign-born population - Turkey (%)
Place of birth for the foreign-born population - Yemen (%)
Place of birth for the foreign-born population - Other Western Asia (%)
Place of birth for the foreign-born population - Eritrea (%)
Place of birth for the foreign-born population - Ethiopia (%)
Place of birth for the foreign-born population - Kenya (%)
Place of birth for the foreign-born population - Somalia (%)
Place of birth for the foreign-born population - Uganda (%)
Place of birth for the foreign-born population - Zimbabwe (%)
Place of birth for the foreign-born population - Other Eastern Africa (%)
Place of birth for the foreign-born population - Cameroon (%)
Place of birth for the foreign-born population - Congo (%)
Place of birth for the foreign-born population - Democratic Republic of Congo (Zaire) (%)
Place of birth for the foreign-born population - Other Middle Africa (%)
Place of birth for the foreign-born population - Egypt (%)
Place of birth for the foreign-born population - Morocco (%)
Place of birth for the foreign-born population - Sudan (%)
Place of birth for the foreign-born population - Other Northern Africa (%)
Place of birth for the foreign-born population - South Africa (%)
Place of birth for the foreign-born population - Other Southern Africa (%)
Place of birth for the foreign-born population - Cabo Verde (%)
Place of birth for the foreign-born population - Ghana (%)
Place of birth for the foreign-born population - Liberia (%)
Place of birth for the foreign-born population - Nigeria (%)
Place of birth for the foreign-born population - Senegal (%)
Place of birth for the foreign-born population - Sierra Leone (%)
Place of birth for the foreign-born population - Other Western Africa (%)
Place of birth for the foreign-born population - Australia (%)
Place of birth for the foreign-born population - New Zealand (%)
Place of birth for the foreign-born population - Fiji (%)
Place of birth for the foreign-born population - Micronesia (%)
Place of birth for the foreign-born population - Bahamas (%)
Place of birth for the foreign-born population - Barbados (%)
Place of birth for the foreign-born population - Cuba (%)
Place of birth for the foreign-born population - Dominica (%)
Place of birth for the foreign-born population - Dominican Republic (%)
Place of birth for the foreign-born population - Grenada (%)
Place of birth for the foreign-born population - Haiti (%)
Place of birth for the foreign-born population - Jamaica (%)
Place of birth for the foreign-born population - St. Vincent and the Grenadines (%)
Place of birth for the foreign-born population - Trinidad and Tobago (%)
Place of birth for the foreign-born population - West Indies (%)
Place of birth for the foreign-born population - Other Caribbean (%)
Place of birth for the foreign-born population - Belize (%)
Place of birth for the foreign-born population - Costa Rica (%)
Place of birth for the foreign-born population - El Salvador (%)
Place of birth for the foreign-born population - Guatemala (%)
Place of birth for the foreign-born population - Honduras (%)
Place of birth for the foreign-born population - Mexico (%)
Place of birth for the foreign-born population - Nicaragua (%)
Place of birth for the foreign-born population - Panama (%)
Place of birth for the foreign-born population - Other Central America (%)
Place of birth for the foreign-born population - Argentina (%)
Place of birth for the foreign-born population - Bolivia (%)
Place of birth for the foreign-born population - Brazil (%)
Place of birth for the foreign-born population - Chile (%)
Place of birth for the foreign-born population - Colombia (%)
Place of birth for the foreign-born population - Ecuador (%)
Place of birth for the foreign-born population - Guyana (%)
Place of birth for the foreign-born population - Peru (%)
Place of birth for the foreign-born population - Uruguay (%)
Place of birth for the foreign-born population - Venezuela (%)
Place of birth for the foreign-born population - Other South America (%)
Place of birth for the foreign-born population - Canada (%)
Place of birth for the foreign-born population - Other Northern America (%)
Place of birth for the foreign-born population - Other (%)
Latest news about races in Mesquite, NV collected exclusively by city-data.com from local newspapers, TV, and radio stations
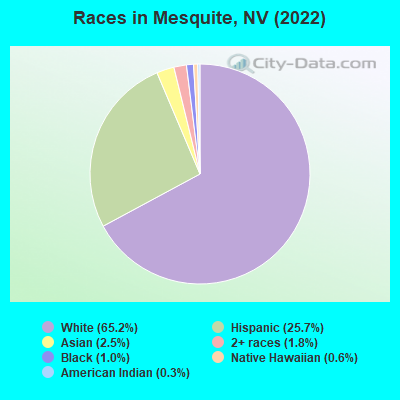
According to 2022 data, the most numerous races in Mesquite, NV are White alone (13,803 residents), Hispanic (5,453 residents), and Black alone (204 residents). 79.3% of Mesquite residents speak English at home. 12.5% of Mesquite, NV residents are foreign-born (8.6% born in Latin America, 1.8% born in Asia, 1.3% born in Europe), which is 44.3% less than the foreign-born rate of 18.0% across the entire state of Nevada.
Race distribution in Mesquite
2000 2022
1,303,001 65.2% White alone 393,970 19.7% Hispanic 131,509 6.6% Black alone 88,593 4.4% Asian alone 49,231 2.5% Two or more races 21,397 1.1% American Indian alone 7,769 0.4% Native Hawaiian and Other 2,787 0.1% Other race alone
1,410,145 44.4% White alone 961,357 30.3% Hispanic 286,471 9.0% Black alone 281,149 8.8% Asian alone 182,151 5.7% Two or more races 20,102 0.6% Native Hawaiian and Other 18,781 0.6% Other race alone 17,616 0.6% American Indian alone
Income and house value in Mesquite Median household income in 2022 $68,455 White non-Hispanic householders$56,140 Asian householders$52,394 Some other race householders$76,300 Two or more races householders$73,536 Hispanic or Latino race householdersMedian 2022 house value $416,466 White Non-Hispanic householders$502,419 Black or African American householders$370,708 American Indian or Alaska Native householders $425,123 Asian householders$579,714 Native Hawaiian and other Pacific Islander householders$364,215 Some other race householders$347,828 Two or more races householders$362,050 Hispanic or Latino householders
Median age by race in Mesquite
69.5 Median age for White residents69.9 69.0 57.5 Median age for Black or African American residents57.2 58.5 25.4 Median age for American Indian / Alaska Native residents14.7 50.9 67.1 Median age for Asian residents66.8 66.7 31.5 Median age for Native Hawaiian / Pacific Islander residents29.6 33.5 31.9 Median age for Other race residents38.0 31.6 38.2 Median age for Two or more races residents38.9 53.9 68.7 Median age for White alone residents69.2 67.8 33.2 Median age for Hispanic or Latino residents32.9 33.6
Owner/renter occupied households by race in Mesquite
House owners and renters - White residents 6,256 84.3% Owner occupied1,167 15.7% Renter occupiedHouse owners and renters - Black or African American residents 35 58.0% Owner occupied25 42.0% Renter occupiedHouse owners and renters - American Indian / Alaska Native residents 14 21.1% Owner occupied51 78.9% Renter occupiedHouse owners and renters - Asian residents 52 33.3% Owner occupied103 66.7% Renter occupiedHouse owners and renters - Native Hawaiian / Pacific Islander residents 55 100.0% Renter occupiedHouse owners and renters - Other race residents 225 69.8% Owner occupied97 30.2% Renter occupiedHouse owners and renters - Two or more races residents 515 61.6% Owner occupied321 38.4% Renter occupiedHouse owners and renters - White alone residents 6,172 84.2% Owner occupied1,162 15.8% Renter occupiedHouse owners and renters - Hispanic or Latino residents 961 69.5% Owner occupied422 30.5% Renter occupied
Language usage in Mesquite
English speakers - Total 79.3% of residents of Mesquite speak English at home.
17.7% of residents speak Spanish at home 2,092 57.9% Speak English very well1,520 42.1% Speak English less than very well2.7% of residents speak other language at home 307 56.0% Speak English very well241 44.0% Speak English less than very well
English speakers - Born in the United States 89.0% of residents of Mesquite speak English at home.
10.3% of residents speak Spanish at home 1,428 87.4% Speak English very well206 12.6% Speak English less than very well0.6% of residents speak other language at home 78 85.7% Speak English very well13 14.3% Speak English less than very well
English speakers - Native, born elsewhere 71.3% of residents of Mesquite speak English at home.
20.4% of residents speak Spanish at home 44 100.0% Speak English very well5.6% of residents speak other language at home 12 100.0% Speak English very well
English speakers - Foreign-born 19.9% of residents of Mesquite speak English at home.
62.6% of residents speak Spanish at home 340 20.6% Speak English very well1,312 79.4% Speak English less than very well16.4% of residents speak other language at home 207 47.8% Speak English very well226 52.2% Speak English less than very well
White (Caucasian) - Speak only English Native:
97.3% (13,283)Foreign-born:
53.0% (352)
White (Caucasian) - Speak another language Native:
4.2% (576)Foreign-born:
54.3% (361)
American Indian / Alaska Native - Speak another language Native:
25.2% (52)Foreign-born:
100.0% (17)
Asian - Speak only English Native:
79.3% (46)Foreign-born:
28.7% (131)
Asian - Speak another language Native:
21.3% (12)Foreign-born:
71.8% (328)
Other race - Speak only English Native:
37.0% (211)Foreign-born:
1.1% (6)
Other race - Speak another language Native:
62.7% (357)Foreign-born:
100.0% (587)
Two or more races - Speak another language Native:
59.2% (1,149)Foreign-born:
100.0% (829)
White alone - Speak only English Native:
98.5% (12,969)Foreign-born:
78.0% (347)
White alone - Speak another language Native:
1.3% (178)Foreign-born:
20.4% (91)
Hispanic or Latino - Speak only English Native:
42.8% (1,397)Foreign-born:
2.6% (45)
Hispanic or Latino - Speak another language Native:
57.1% (1,864)Foreign-born:
97.9% (1,686)
Foreign-born residents in Mesquite 2,641 residents are foreign born (8.6% Latin America , 1.8% Asia , 1.3% Europe ).
This city:
12.5%Nevada:
19.1%
Marital status for residents in Mesquite Marital status - White (Caucasian) population 15 years and over
Males 15.4% Never married65.8% Now married0.8% Separated4.1% Widowed13.9% DivorcedFemales 12.5% Never married62.5% Now married1.3% Separated13.6% Widowed10.0% DivorcedWomen who gave birth in the past 12 months Now married:
77.6% (70)Unmarried:
22.4% (20)
Women who did not give birth in the past 12 months Now married:
45.3% (650)Unmarried:
54.7% (785)
Marital status - Black or African American population 15 years and over
Males 51.9% Never married32.1% Now married16.0% Separated0.0% Widowed0.0% DivorcedFemales 18.2% Never married40.9% Now married0.0% Separated35.2% Widowed5.7% DivorcedWomen who did not give birth in the past 12 months Now married:
0.0% (0)Unmarried:
100.0% (16)
Marital status - American Indian / Alaska Native population 15 years and over
Males 21.6% Never married78.4% Now married0.0% Separated0.0% Widowed0.0% DivorcedFemales 0.0% Never married58.3% Now married0.0% Separated41.7% Widowed0.0% DivorcedWomen who gave birth in the past 12 months Now married:
100.0% (8)Unmarried:
0.0% (0)
Women who did not give birth in the past 12 months Now married:
100.0% (4)Unmarried:
0.0% (0)
Marital status - Asian population 15 years and over
Males 37.0% Never married33.3% Now married0.0% Separated14.5% Widowed15.2% DivorcedFemales 10.4% Never married60.9% Now married5.9% Separated22.8% Widowed0.0% DivorcedWomen who gave birth in the past 12 months Now married:
100.0% (8)Unmarried:
0.0% (0)
Women who did not give birth in the past 12 months Now married:
57.3% (48)Unmarried:
42.7% (36)
Marital status - Native Hawaiian / Pacific Islander population 15 years and over
Males 100.0% Never married0.0% Now married0.0% Separated0.0% Widowed0.0% DivorcedFemales 71.2% Never married0.0% Now married0.0% Separated0.0% Widowed28.8% DivorcedWomen who did not give birth in the past 12 months Now married:
0.0% (0)Unmarried:
100.0% (56)
Marital status - Other race population 15 years and over
Males 38.3% Never married35.8% Now married0.0% Separated17.8% Widowed8.1% DivorcedFemales 33.0% Never married36.5% Now married7.6% Separated9.8% Widowed13.1% DivorcedWomen who gave birth in the past 12 months Now married:
100.0% (24)Unmarried:
0.0% (0)
Women who did not give birth in the past 12 months Now married:
20.7% (40)Unmarried:
79.3% (153)
Marital status - Two or more races population 15 years and over
Males 62.7% Never married29.5% Now married1.5% Separated1.7% Widowed4.5% DivorcedFemales 27.7% Never married28.2% Now married18.3% Separated6.2% Widowed19.6% DivorcedWomen who gave birth in the past 12 months Now married:
100.0% (32)Unmarried:
0.0% (0)
Women who did not give birth in the past 12 months Now married:
31.0% (134)Unmarried:
69.0% (298)
Marital status - White alone, not Hispanic / Latino population 15 years and over
Males 11.5% Never married68.6% Now married1.0% Separated4.7% Widowed14.2% DivorcedFemales 9.6% Never married65.0% Now married0.5% Separated14.7% Widowed10.2% DivorcedWomen who gave birth in the past 12 months Now married:
73.8% (43)Unmarried:
26.2% (15)
Women who did not give birth in the past 12 months Now married:
51.9% (624)Unmarried:
48.1% (579)
Marital status - Hispanic or Latino population 15 years and over
Males 52.1% Never married36.0% Now married0.6% Separated4.2% Widowed7.1% DivorcedFemales 33.6% Never married34.0% Now married12.7% Separated5.5% Widowed14.1% DivorcedWomen who gave birth in the past 12 months Now married:
91.8% (93)Unmarried:
8.2% (8)
Women who did not give birth in the past 12 months Now married:
26.9% (257)Unmarried:
73.1% (699)
Ancestries in Mesquite
1,609 14.4% English921 8.2% German749 6.7% American452 4.0% Irish339 3.0% Italian264 2.4% European211 1.9% Polish201 1.8% French174 1.6% Danish150 1.3% Norwegian86 0.8% Scottish79 0.7% French Canadian56 0.5% Swedish55 0.5% Basque55 0.5% Dutch46 0.4% British34 0.3% Scotch-Irish33 0.3% Swiss29 0.3% Hungarian28 0.3% Czech28 0.3% Portuguese27 0.2% Scandinavian25 0.2% Greek25 0.2% Russian22 0.2% Eastern European22 0.2% Welsh20 0.2% Northern European18 0.2% Belgian18 0.2% Austrian16 0.1% Lithuanian11 0.10% Armenian11 0.10% Finnish10 0.09% Canadian9 0.08% Turkish6 0.05% Brazilian4 0.04% Iranian4 0.04% Romanian3 0.03% Slovak
Geographical mobility in Mesquite Same house 1 year ago 12,500 87.3% White (Caucasian)192 82.6% Black or African American204 89.7% American Indian / Alaska Native385 72.6% Asian48 39.0% Native Hawaiian / Pacific Islander1,082 86.3% Other race2,524 87.2% Two or more races11,952 86.9% White alone, not Hispanic / Latino4,759 88.7% Hispanic or LatinoMoved within same county 641 4.5% White / Caucasian16 6.9% Black or African American21 4.0% Asian56 45.3% Native Hawaiian / Pacific Islander55 4.4% Other race236 8.2% Two or more races595 4.3% White alone, not Hispanic / Latino348 6.5% Hispanic or LatinoMoved within same state 172 1.2% White / Caucasian62 26.6% Black or African American74 2.5% Two or more races176 1.3% White alone, not Hispanic / Latino21 0.4% Hispanic or LatinoMoved from different state 1,132 7.9% White / Caucasian19 8.4% American Indian / Alaska Native16 3.1% Asian87 7.0% Other race81 2.8% Two or more races1,117 8.1% White alone, not Hispanic / Latino210 3.9% Hispanic or LatinoMoved from abroad 39 0.3% White96 18.1% Asian12 1.0% Other race37 0.3% White alone, not Hispanic / Latino38 0.7% Hispanic or Latino
Children Nativity (place of birth) in Mesquite
Children under 6 years - Living with two parents Both parents native 335 100.0% NativeBoth parents foreign-born 146 100.0% NativeOne native, one foreign-born parent 46 100.0% NativeChildren under 6 years - Living with one parent Native parent 228 100.0% NativeForeign-born parent 83 100.0% NativeChildren 6 to 17 years - Living with two parents Both parents native 992 100.0% NativeBoth parents foreign-born 218 98.6% Native3 1.4% Foreign-bornOne native, one foreign-born parent 82 91.5% Native8 8.5% Foreign-bornChildren 6 to 17 years - Living with one parent Native parent 406 100.0% NativeForeign-born parent 248 50.1% Native247 49.9% Foreign-born
Grandparents responsible for own grandchildren in Mesquite
Grandparents (30 to 59 years) White / Caucasian 66 58.8% Responsible for grandchildren46 41.2% Not responsible for grandchildrenBlack or African American 8 100.0% Responsible for grandchildrenOther race 40 100.0% Not responsible for grandchildrenTwo or more races 55 100.0% Not responsible for grandchildrenWhite alone, not Hispanic / Latino 8 20.9% Responsible for grandchildren31 79.1% Not responsible for grandchildrenHispanic or Latino 70 39.6% Responsible for grandchildren107 60.4% Not responsible for grandchildrenGrandparents (60 years and over) White / Caucasian 42 25.5% Responsible for grandchildren121 74.5% Not responsible for grandchildrenBlack or African American 6 100.0% Not responsible for grandchildrenOther race 165 100.0% Not responsible for grandchildrenWhite alone, not Hispanic / Latino 50 41.7% Responsible for grandchildren70 58.3% Not responsible for grandchildrenHispanic or Latino 275 100.0% Not responsible for grandchildren