Races in Middlesex, New Jersey (NJ) Detailed Stats
Data:
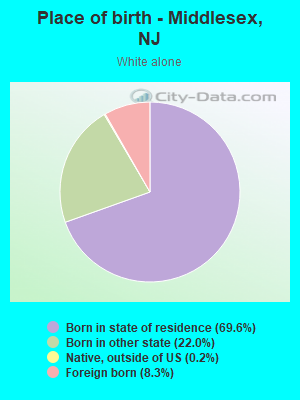
Races - White alone (%)
Races - White alone (% change since 2000)
Races - Black alone (%)
Races - Black alone (% change since 2000)
Races - American Indian alone (%)
Races - American Indian alone (% change since 2000)
Races - Asian alone (%)
Races - Asian alone (% change since 2000)
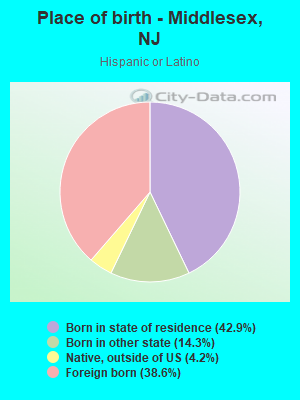
Races - Hispanic (%)
Races - Hispanic (% change since 2000)
Races - Native Hawaiian and Other Pacific Islander alone (%)
Races - Native Hawaiian and Other Pacific Islander alone (% change since 2000)
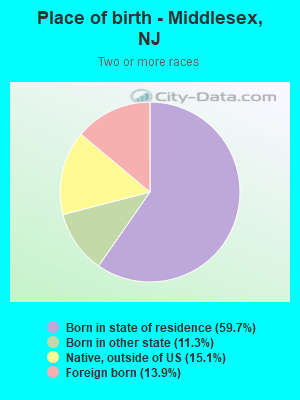
Races - Two or more races(%)
Races - Two or more races(% change since 2000)
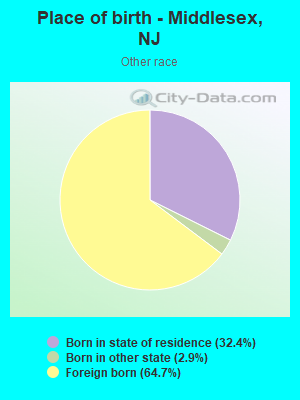
Races - Other race alone (%)
Races - Other race alone (% change since 2000)
Racial diversity
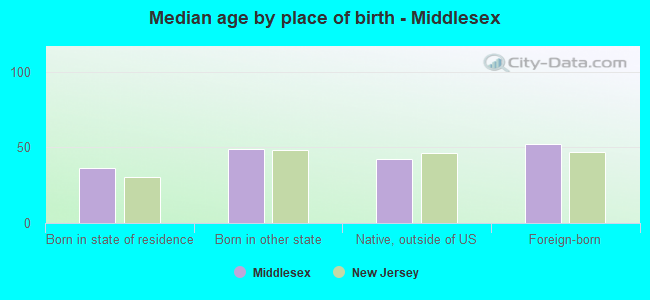
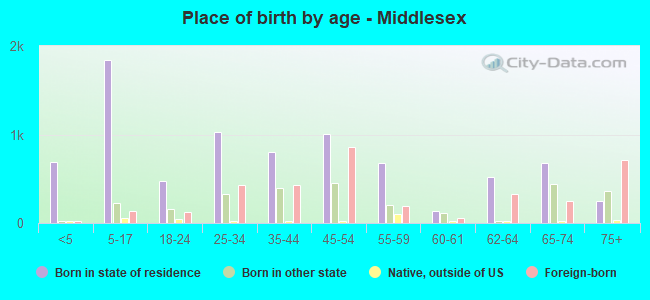
Place of birth - Born in state of residence (%)
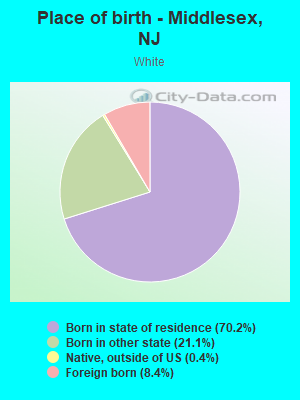
Place of birth - Born in state of residence (%) - White
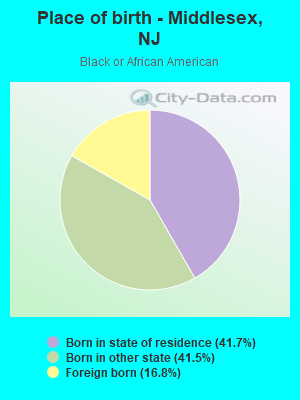
Place of birth - Born in state of residence (%) - Black or African American
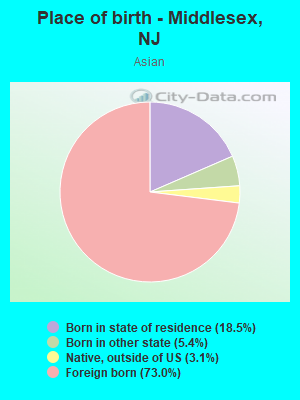
Place of birth - Born in state of residence (%) - Asian
Place of birth - Born in state of residence (%) - Hispanic or Latino
Place of birth - Born in state of residence (%) - American Indian and Alaska Native
Place of birth - Born in state of residence (%) - Multirace
Place of birth - Born in state of residence (%) - Other Race
Place of birth - Born in other state (%)
Place of birth - Born in other state (%) - White
Place of birth - Born in other state (%) - Black or African American
Place of birth - Born in other state (%) - Asian
Place of birth - Born in other state (%) - Hispanic or Latino
Place of birth - Born in other state (%) - American Indian and Alaska Native
Place of birth - Born in other state (%) - Multirace
Place of birth - Born in other state (%) - Other Race
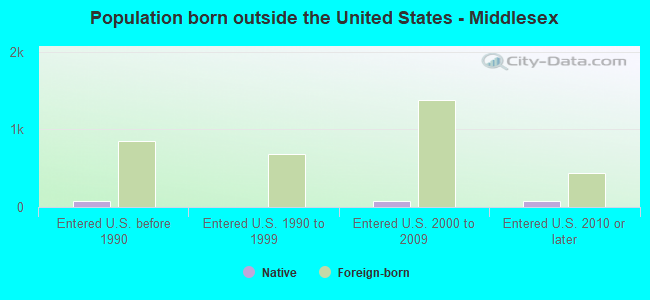
Place of birth - Native, outside of US (%)
Place of birth - Native, outside of US (%) - White
Place of birth - Native, outside of US (%) - Black or African American
Place of birth - Native, outside of US (%) - Asian
Place of birth - Native, outside of US (%) - Hispanic or Latino
Place of birth - Native, outside of US (%) - American Indian and Alaska Native
Place of birth - Native, outside of US (%) - Multirace
Place of birth - Native, outside of US (%) - Other Race
Place of birth - Foreign born (%)
Place of birth - Foreign born (%) - White
Place of birth - Foreign born (%) - Black or African American
Place of birth - Foreign born (%) - Asian
Place of birth - Foreign born (%) - Hispanic or Latino
Place of birth - Foreign born (%) - American Indian and Alaska Native
Place of birth - Foreign born (%) - Multirace
Place of birth - Foreign born (%) - Other Race
Residents speaking English at home (%)
Residents speaking English at home - Born in the United States (%)
Residents speaking English at home - Native, born elsewhere (%)
Residents speaking English at home - Foreign born (%)
Residents speaking Spanish at home (%)
Residents speaking Spanish at home - Born in the United States (%)
Residents speaking Spanish at home - Native, born elsewhere (%)
Residents speaking Spanish at home - Foreign born (%)
Residents speaking other language at home (%)
Residents speaking other language at home - Born in the United States (%)
Residents speaking other language at home - Native, born elsewhere (%)
Residents speaking other language at home - Foreign born (%)
Marital status - Never married (%)
Marital status - Now married (%)
Marital status - Separated (%)
Marital status - Widowed (%)
Marital status - Divorced (%)
Ancestries Reported - Arab (%)
Ancestries Reported - Czech (%)
Ancestries Reported - Danish (%)
Ancestries Reported - Dutch (%)
Ancestries Reported - English (%)
Ancestries Reported - French (%)
Ancestries Reported - French Canadian (%)
Ancestries Reported - German (%)
Ancestries Reported - Greek (%)
Ancestries Reported - Hungarian (%)
Ancestries Reported - Irish (%)
Ancestries Reported - Italian (%)
Ancestries Reported - Lithuanian (%)
Ancestries Reported - Norwegian (%)
Ancestries Reported - Polish (%)
Ancestries Reported - Portuguese (%)
Ancestries Reported - Russian (%)
Ancestries Reported - Scotch-Irish (%)
Ancestries Reported - Scottish (%)
Ancestries Reported - Slovak (%)
Ancestries Reported - Subsaharan African (%)
Ancestries Reported - Swedish (%)
Ancestries Reported - Swiss (%)
Ancestries Reported - Ukrainian (%)
Ancestries Reported - United States (%)
Ancestries Reported - Welsh (%)
Ancestries Reported - West Indian (%)
Ancestries Reported - Other (%)
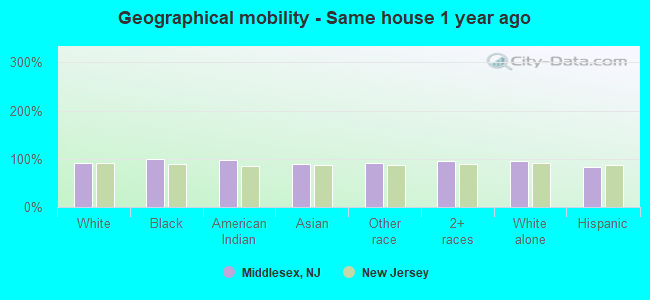
Geographical mobility - Same house 1 year ago (%)
Geographical mobility - Same house 1 year ago (%) - White
Geographical mobility - Same house 1 year ago (%) - Black or African American
Geographical mobility - Same house 1 year ago (%) - Asian
Geographical mobility - Same house 1 year ago (%) - Hispanic or Latino
Geographical mobility - Same house 1 year ago (%) - American Indian and Alaska Native
Geographical mobility - Same house 1 year ago (%) - Multirace
Geographical mobility - Same house 1 year ago (%) - Other Race
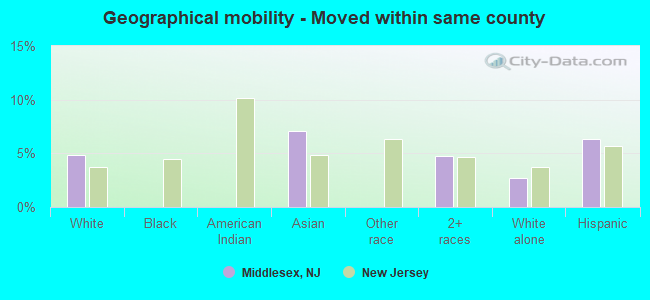
Geographical mobility - Moved within same county (%)
Geographical mobility - Moved within same county (%) - White
Geographical mobility - Moved within same county (%) - Black or African American
Geographical mobility - Moved within same county (%) - Asian
Geographical mobility - Moved within same county (%) - Hispanic or Latino
Geographical mobility - Moved within same county (%) - American Indian and Alaska Native
Geographical mobility - Moved within same county (%) - Multirace
Geographical mobility - Moved within same county (%) - Other Race
Geographical mobility - Moved from different county within same state (%)
Geographical mobility - Moved from different county within same state (%) - White
Geographical mobility - Moved from different county within same state (%) - Black or African American
Geographical mobility - Moved from different county within same state (%) - Asian
Geographical mobility - Moved from different county within same state (%) - Hispanic or Latino
Geographical mobility - Moved from different county within same state (%) - American Indian and Alaska Native
Geographical mobility - Moved from different county within same state (%) - Multirace
Geographical mobility - Moved from different county within same state (%) - Other Race
Geographical mobility - Moved from different state (%)
Geographical mobility - Moved from different state (%) - White
Geographical mobility - Moved from different state (%) - Black or African American
Geographical mobility - Moved from different state (%) - Asian
Geographical mobility - Moved from different state (%) - Hispanic or Latino
Geographical mobility - Moved from different state (%) - American Indian and Alaska Native
Geographical mobility - Moved from different state (%) - Multirace
Geographical mobility - Moved from different state (%) - Other Race
Geographical mobility - Moved from abroad (%)
Geographical mobility - Moved from abroad (%) - White
Geographical mobility - Moved from abroad (%) - Black or African American
Geographical mobility - Moved from abroad (%) - Asian
Geographical mobility - Moved from abroad (%) - Hispanic or Latino
Geographical mobility - Moved from abroad (%) - American Indian and Alaska Native
Geographical mobility - Moved from abroad (%) - Multirace
Geographical mobility - Moved from abroad (%) - Other Race
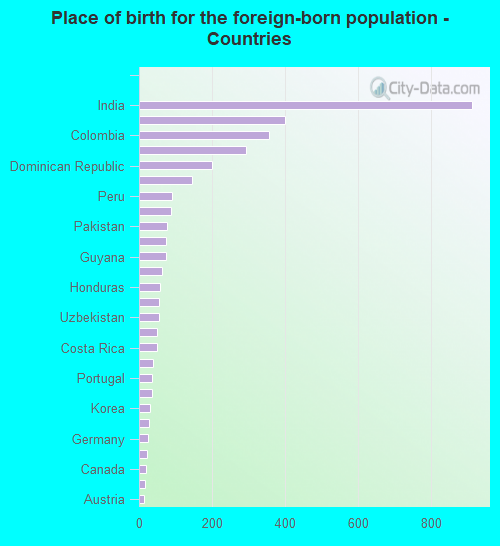
Place of birth for the foreign-born population - Ireland (%)
Place of birth for the foreign-born population - Denmark (%)
Place of birth for the foreign-born population - Norway (%)
Place of birth for the foreign-born population - Sweden (%)
Place of birth for the foreign-born population - United Kingdom (%)
Place of birth for the foreign-born population - England (%)
Place of birth for the foreign-born population - Scotland (%)
Place of birth for the foreign-born population - Other Northern Europe (%)
Place of birth for the foreign-born population - Austria (%)
Place of birth for the foreign-born population - Belgium (%)
Place of birth for the foreign-born population - France (%)
Place of birth for the foreign-born population - Germany (%)
Place of birth for the foreign-born population - Netherlands (%)
Place of birth for the foreign-born population - Switzerland (%)
Place of birth for the foreign-born population - Other Western Europe (%)
Place of birth for the foreign-born population - Greece (%)
Place of birth for the foreign-born population - Italy (%)
Place of birth for the foreign-born population - Portugal (%)
Place of birth for the foreign-born population - Spain (%)
Place of birth for the foreign-born population - Other Southern Europe (%)
Place of birth for the foreign-born population - Albania (%)
Place of birth for the foreign-born population - Belarus (%)
Place of birth for the foreign-born population - Bosnia and Herzegovina (%)
Place of birth for the foreign-born population - Bulgaria (%)
Place of birth for the foreign-born population - Croatia (%)
Place of birth for the foreign-born population - Czechoslovakia (%)
Place of birth for the foreign-born population - Hungary (%)
Place of birth for the foreign-born population - Latvia (%)
Place of birth for the foreign-born population - Lithuania (%)
Place of birth for the foreign-born population - North Macedonia (Macedonia) (%)
Place of birth for the foreign-born population - Moldova (%)
Place of birth for the foreign-born population - Poland (%)
Place of birth for the foreign-born population - Romania (%)
Place of birth for the foreign-born population - Russia (%)
Place of birth for the foreign-born population - Serbia (%)
Place of birth for the foreign-born population - Ukraine (%)
Place of birth for the foreign-born population - Other Eastern Europe (%)
Place of birth for the foreign-born population - China (%)
Place of birth for the foreign-born population - Hong Kong (%)
Place of birth for the foreign-born population - Taiwan (%)
Place of birth for the foreign-born population - Japan (%)
Place of birth for the foreign-born population - Korea (%)
Place of birth for the foreign-born population - Other Eastern Asia (%)
Place of birth for the foreign-born population - Afghanistan (%)
Place of birth for the foreign-born population - Bangladesh (%)
Place of birth for the foreign-born population - India (%)
Place of birth for the foreign-born population - Iran (%)
Place of birth for the foreign-born population - Kazakhstan (%)
Place of birth for the foreign-born population - Nepal (%)
Place of birth for the foreign-born population - Pakistan (%)
Place of birth for the foreign-born population - Sri Lanka (%)
Place of birth for the foreign-born population - Uzbekistan (%)
Place of birth for the foreign-born population - Other South Central Asia (%)
Place of birth for the foreign-born population - Burma (%)
Place of birth for the foreign-born population - Cambodia (%)
Place of birth for the foreign-born population - Indonesia (%)
Place of birth for the foreign-born population - Laos (%)
Place of birth for the foreign-born population - Malaysia (%)
Place of birth for the foreign-born population - Philippines (%)
Place of birth for the foreign-born population - Singapore (%)
Place of birth for the foreign-born population - Thailand (%)
Place of birth for the foreign-born population - Vietnam (%)
Place of birth for the foreign-born population - Other South Eastern Asia (%)
Place of birth for the foreign-born population - Armenia (%)
Place of birth for the foreign-born population - Iraq (%)
Place of birth for the foreign-born population - Israel (%)
Place of birth for the foreign-born population - Jordan (%)
Place of birth for the foreign-born population - Kuwait (%)
Place of birth for the foreign-born population - Lebanon (%)
Place of birth for the foreign-born population - Saudi Arabia (%)
Place of birth for the foreign-born population - Syria (%)
Place of birth for the foreign-born population - Turkey (%)
Place of birth for the foreign-born population - Yemen (%)
Place of birth for the foreign-born population - Other Western Asia (%)
Place of birth for the foreign-born population - Eritrea (%)
Place of birth for the foreign-born population - Ethiopia (%)
Place of birth for the foreign-born population - Kenya (%)
Place of birth for the foreign-born population - Somalia (%)
Place of birth for the foreign-born population - Uganda (%)
Place of birth for the foreign-born population - Zimbabwe (%)
Place of birth for the foreign-born population - Other Eastern Africa (%)
Place of birth for the foreign-born population - Cameroon (%)
Place of birth for the foreign-born population - Congo (%)
Place of birth for the foreign-born population - Democratic Republic of Congo (Zaire) (%)
Place of birth for the foreign-born population - Other Middle Africa (%)
Place of birth for the foreign-born population - Egypt (%)
Place of birth for the foreign-born population - Morocco (%)
Place of birth for the foreign-born population - Sudan (%)
Place of birth for the foreign-born population - Other Northern Africa (%)
Place of birth for the foreign-born population - South Africa (%)
Place of birth for the foreign-born population - Other Southern Africa (%)
Place of birth for the foreign-born population - Cabo Verde (%)
Place of birth for the foreign-born population - Ghana (%)
Place of birth for the foreign-born population - Liberia (%)
Place of birth for the foreign-born population - Nigeria (%)
Place of birth for the foreign-born population - Senegal (%)
Place of birth for the foreign-born population - Sierra Leone (%)
Place of birth for the foreign-born population - Other Western Africa (%)
Place of birth for the foreign-born population - Australia (%)
Place of birth for the foreign-born population - New Zealand (%)
Place of birth for the foreign-born population - Fiji (%)
Place of birth for the foreign-born population - Micronesia (%)
Place of birth for the foreign-born population - Bahamas (%)
Place of birth for the foreign-born population - Barbados (%)
Place of birth for the foreign-born population - Cuba (%)
Place of birth for the foreign-born population - Dominica (%)
Place of birth for the foreign-born population - Dominican Republic (%)
Place of birth for the foreign-born population - Grenada (%)
Place of birth for the foreign-born population - Haiti (%)
Place of birth for the foreign-born population - Jamaica (%)
Place of birth for the foreign-born population - St. Vincent and the Grenadines (%)
Place of birth for the foreign-born population - Trinidad and Tobago (%)
Place of birth for the foreign-born population - West Indies (%)
Place of birth for the foreign-born population - Other Caribbean (%)
Place of birth for the foreign-born population - Belize (%)
Place of birth for the foreign-born population - Costa Rica (%)
Place of birth for the foreign-born population - El Salvador (%)
Place of birth for the foreign-born population - Guatemala (%)
Place of birth for the foreign-born population - Honduras (%)
Place of birth for the foreign-born population - Mexico (%)
Place of birth for the foreign-born population - Nicaragua (%)
Place of birth for the foreign-born population - Panama (%)
Place of birth for the foreign-born population - Other Central America (%)
Place of birth for the foreign-born population - Argentina (%)
Place of birth for the foreign-born population - Bolivia (%)
Place of birth for the foreign-born population - Brazil (%)
Place of birth for the foreign-born population - Chile (%)
Place of birth for the foreign-born population - Colombia (%)
Place of birth for the foreign-born population - Ecuador (%)
Place of birth for the foreign-born population - Guyana (%)
Place of birth for the foreign-born population - Peru (%)
Place of birth for the foreign-born population - Uruguay (%)
Place of birth for the foreign-born population - Venezuela (%)
Place of birth for the foreign-born population - Other South America (%)
Place of birth for the foreign-born population - Canada (%)
Place of birth for the foreign-born population - Other Northern America (%)
Place of birth for the foreign-born population - Other (%)
Latest news about races in Middlesex, NJ collected exclusively by city-data.com from local newspapers, TV, and radio stations
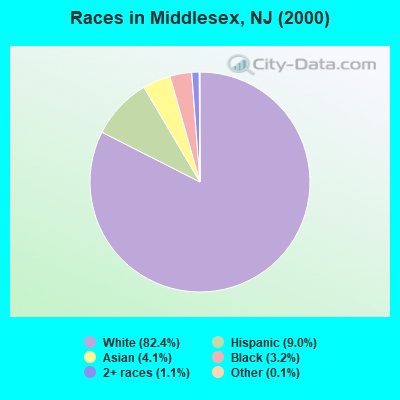
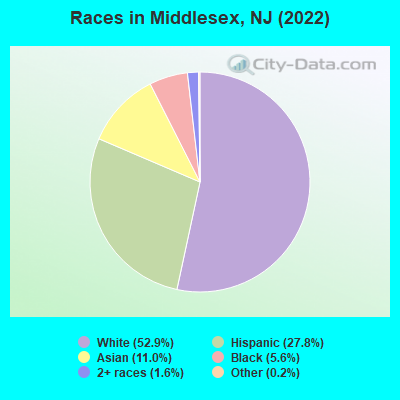
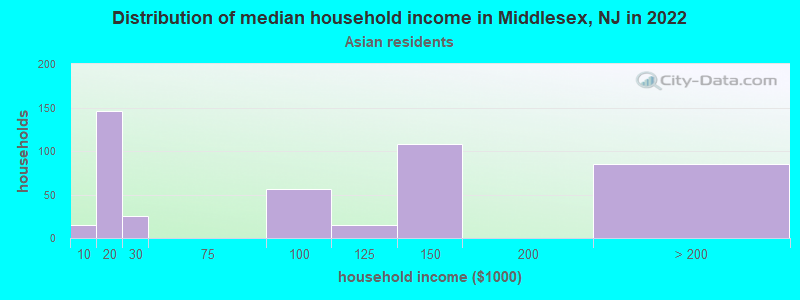
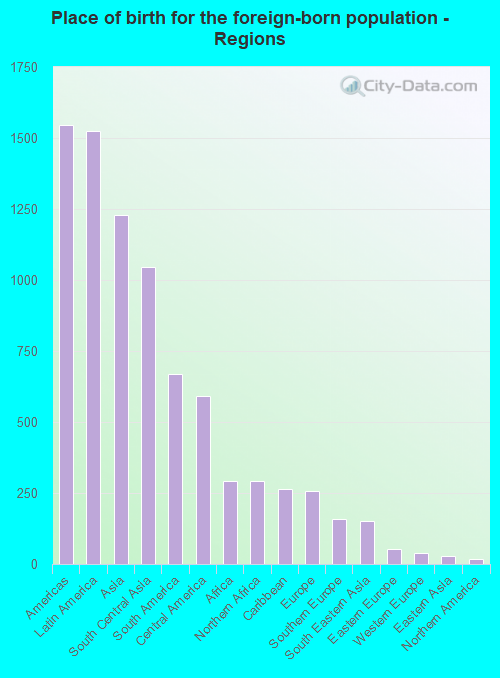
According to 2022 data, the most numerous races in Middlesex, NJ are White alone (7,701 residents), Hispanic (4,038 residents), and Black alone (813 residents). 67.3% of Middlesex residents speak English at home. 22.9% of Middlesex, NJ residents are foreign-born (10.3% born in Latin America, 8.3% born in Asia), which is about the same as the foreign-born rate of 23.0% across the entire state of New Jersey.
Race distribution in Middlesex
2000 2022
5,557,209 66.0% White alone 1,117,191 13.3% Hispanic 1,096,171 13.0% Black alone 477,012 5.7% Asian alone 133,689 1.6% Two or more races 19,565 0.2% Other race alone 11,338 0.1% American Indian alone 2,175 0.03% Native Hawaiian and Other
4,766,476 51.5% White alone 2,028,470 21.9% Hispanic 1,111,632 12.0% Black alone 923,546 10.0% Asian alone 332,237 3.6% Two or more races 89,847 1.0% Other race alone 8,557 0.09% American Indian alone 934 0.01% Native Hawaiian and Other
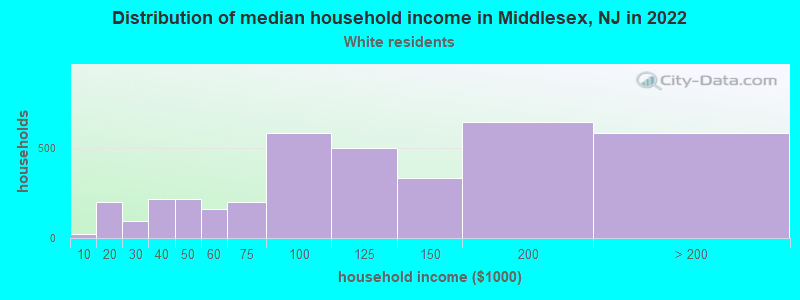
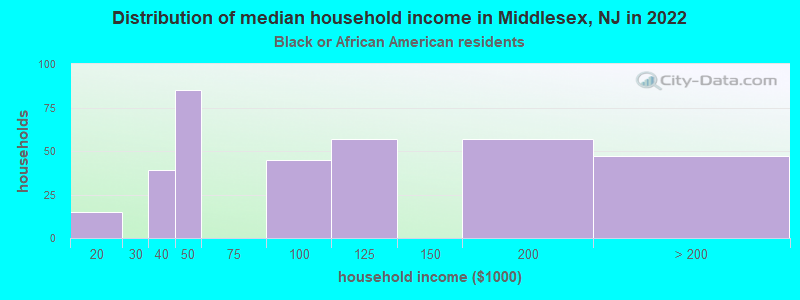
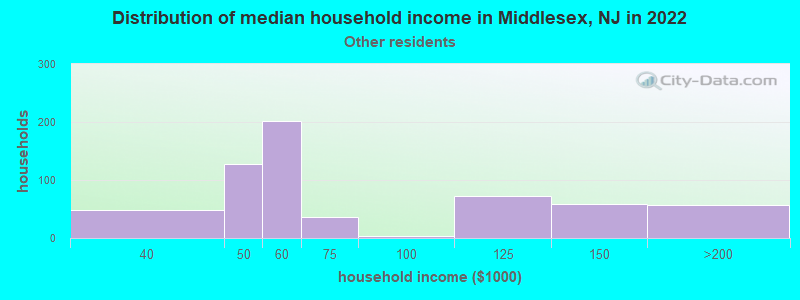
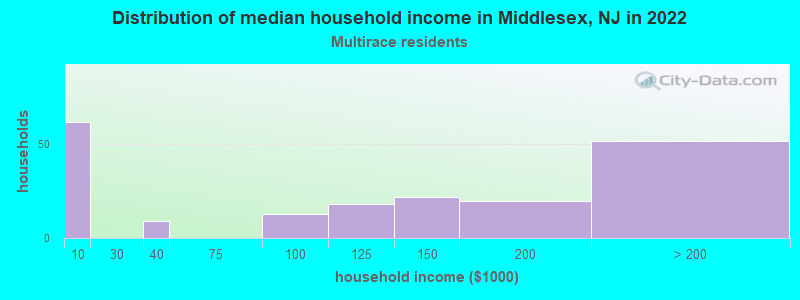
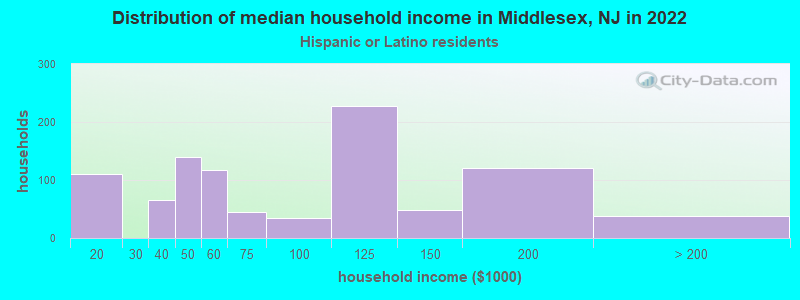
Income and house value in Middlesex Median household income in 2022 $107,272 White non-Hispanic householders$112,494 Black householders$50,589 Some other race householders$99,403 Two or more races householdersMedian 2022 house value $414,546 White Non-Hispanic householders$405,704 Black or African American householders $459,512 Asian householdersover $1,000,000 Native Hawaiian and other Pacific Islander householders$300,110 Some other race householders$884,162 Two or more races householders$349,875 Hispanic or Latino householders
Median age by race in Middlesex
51.5 Median age for White residents50.3 53.4 37.5 Median age for Black or African American residents39.6 35.6 19.1 Median age for American Indian / Alaska Native residents-624,624,624.0 -739,999,999.3 51.7 Median age for Asian residents53.3 48.9 -939,393,938.5 Median age for Native Hawaiian / Pacific Islander residents-860,335,194.7 -713,070,378.3 45.0 Median age for Other race residents36.3 46.4 26.3 Median age for Two or more races residents24.3 25.8 51.0 Median age for White alone residents50.8 51.2 30.9 Median age for Hispanic or Latino residents31.0 32.6
Owner/renter occupied households by race in Middlesex
House owners and renters - White residents 3,190 83.1% Owner occupied648 16.9% Renter occupiedHouse owners and renters - Black or African American residents 231 67.6% Owner occupied111 32.4% Renter occupiedHouse owners and renters - American Indian / Alaska Native residents 181 100.0% Owner occupiedHouse owners and renters - Asian residents 270 64.3% Owner occupied149 35.7% Renter occupiedHouse owners and renters - Other race residents 256 40.7% Owner occupied373 59.3% Renter occupiedHouse owners and renters - Two or more races residents 176 83.6% Owner occupied35 16.4% Renter occupiedHouse owners and renters - White alone residents 3,139 82.0% Owner occupied690 18.0% Renter occupiedHouse owners and renters - Hispanic or Latino residents 689 66.9% Owner occupied340 33.1% Renter occupied
Language usage in Middlesex
English speakers - Total 67.3% of residents of Middlesex speak English at home.
18.6% of residents speak Spanish at home 1,353 52.5% Speak English very well1,224 47.5% Speak English less than very well14.2% of residents speak other language at home 916 46.4% Speak English very well1,058 53.6% Speak English less than very well
English speakers - Born in the United States 85.2% of residents of Middlesex speak English at home.
10.7% of residents speak Spanish at home 204 69.6% Speak English very well89 30.4% Speak English less than very well4.2% of residents speak other language at home 106 92.2% Speak English very well9 7.8% Speak English less than very well
English speakers - Native, born elsewhere 72.7% of residents of Middlesex speak English at home.
31.6% of residents speak Spanish at home 46 63.0% Speak English very well27 37.0% Speak English less than very well
English speakers - Foreign-born 10.6% of residents of Middlesex speak English at home.
42.6% of residents speak Spanish at home 363 24.8% Speak English very well1,098 75.2% Speak English less than very well49.4% of residents speak other language at home 713 42.1% Speak English very well981 57.9% Speak English less than very well
White (Caucasian) - Speak only English Native:
100.0% (6,780)Foreign-born:
16.7% (109)
White (Caucasian) - Speak another language Native:
2.6% (175)Foreign-born:
81.9% (534)
Black or African American - Speak only English Native:
84.9% (656)Foreign-born:
82.2% (139)
Asian - Speak only English Native:
51.5% (193)Foreign-born:
3.2% (37)
Asian - Speak another language Native:
48.2% (181)Foreign-born:
96.3% (1,126)
Other race - Speak only English Native:
23.3% (138)Foreign-born:
7.1% (100)
Other race - Speak another language Native:
74.7% (442)Foreign-born:
92.8% (1,305)
Two or more races - Speak another language Native:
44.2% (519)Foreign-born:
100.0% (204)
White alone - Speak only English Native:
100.0% (6,763)Foreign-born:
16.1% (102)
White alone - Speak another language Native:
1.0% (69)Foreign-born:
83.3% (528)
Hispanic or Latino - Speak only English Native:
46.7% (1,004)Foreign-born:
6.4% (100)
Hispanic or Latino - Speak another language Native:
54.2% (1,165)Foreign-born:
93.2% (1,444)
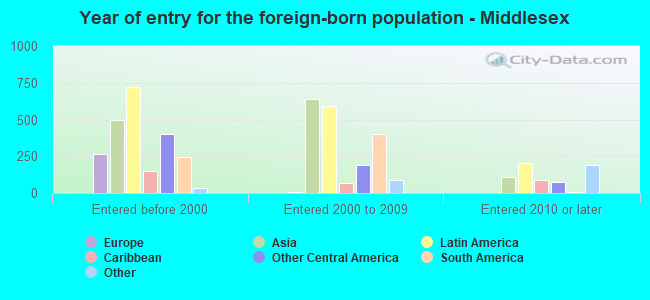
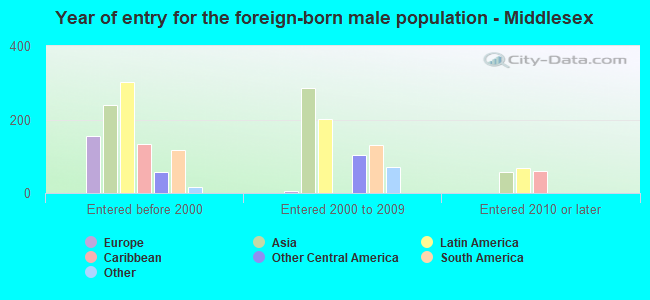
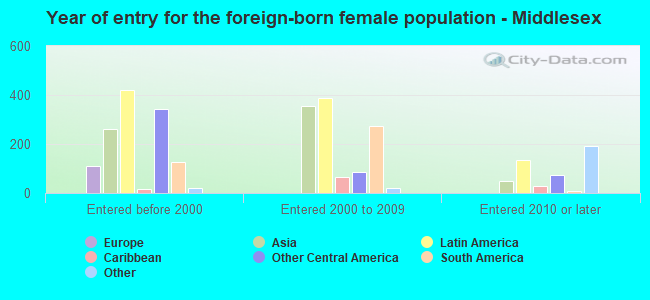
Foreign-born residents in Middlesex 3,325 residents are foreign born (10.3% Latin America , 8.3% Asia ).
This city:
22.9%New Jersey:
23.2%
Marital status for residents in Middlesex Marital status - White (Caucasian) population 15 years and over
Males 29.6% Never married62.7% Now married0.5% Separated2.8% Widowed4.4% DivorcedFemales 19.5% Never married56.8% Now married0.4% Separated9.2% Widowed14.1% DivorcedWomen who gave birth in the past 12 months Now married:
79.7% (96)Unmarried:
20.3% (24)
Women who did not give birth in the past 12 months Now married:
44.9% (570)Unmarried:
55.1% (699)
Marital status - Black or African American population 15 years and over
Males 25.7% Never married65.1% Now married0.0% Separated0.0% Widowed9.2% DivorcedFemales 28.8% Never married44.8% Now married13.6% Separated12.8% Widowed0.0% DivorcedWomen who did not give birth in the past 12 months Now married:
45.2% (178)Unmarried:
54.8% (216)
Marital status - American Indian / Alaska Native population 15 years and over
Males 50.8% Never married49.2% Now married0.0% Separated0.0% Widowed0.0% DivorcedFemales 53.0% Never married47.0% Now married0.0% Separated0.0% Widowed0.0% DivorcedWomen who did not give birth in the past 12 months Now married:
47.0% (133)Unmarried:
53.0% (150)
Marital status - Asian population 15 years and over
Males 17.6% Never married72.3% Now married0.0% Separated2.2% Widowed7.9% DivorcedFemales 18.8% Never married70.9% Now married0.0% Separated5.8% Widowed4.5% DivorcedWomen who did not give birth in the past 12 months Now married:
57.0% (208)Unmarried:
43.0% (157)
Marital status - Other race population 15 years and over
Males 24.5% Never married75.0% Now married0.0% Separated0.0% Widowed0.5% DivorcedFemales 25.6% Never married58.3% Now married8.3% Separated4.6% Widowed3.2% DivorcedWomen who gave birth in the past 12 months Now married:
100.0% (23)Unmarried:
0.0% (0)
Women who did not give birth in the past 12 months Now married:
58.7% (300)Unmarried:
41.3% (211)
Marital status - Two or more races population 15 years and over
Males 57.7% Never married42.3% Now married0.0% Separated0.0% Widowed0.0% DivorcedFemales 57.6% Never married37.6% Now married0.0% Separated0.0% Widowed4.8% DivorcedWomen who gave birth in the past 12 months Now married:
0.0% (0)Unmarried:
100.0% (24)
Women who did not give birth in the past 12 months Now married:
28.9% (108)Unmarried:
71.1% (266)
Marital status - White alone, not Hispanic / Latino population 15 years and over
Males 28.3% Never married63.1% Now married0.6% Separated3.1% Widowed4.8% DivorcedFemales 20.6% Never married55.3% Now married0.0% Separated10.0% Widowed14.2% DivorcedWomen who gave birth in the past 12 months Now married:
79.7% (113)Unmarried:
20.3% (29)
Women who did not give birth in the past 12 months Now married:
40.9% (544)Unmarried:
59.1% (787)
Marital status - Hispanic or Latino population 15 years and over
Males 36.7% Never married63.1% Now married0.0% Separated0.0% Widowed0.2% DivorcedFemales 32.4% Never married56.9% Now married4.5% Separated1.9% Widowed4.2% DivorcedWomen who gave birth in the past 12 months Now married:
47.1% (17)Unmarried:
52.9% (19)
Women who did not give birth in the past 12 months Now married:
53.7% (515)Unmarried:
46.3% (445)
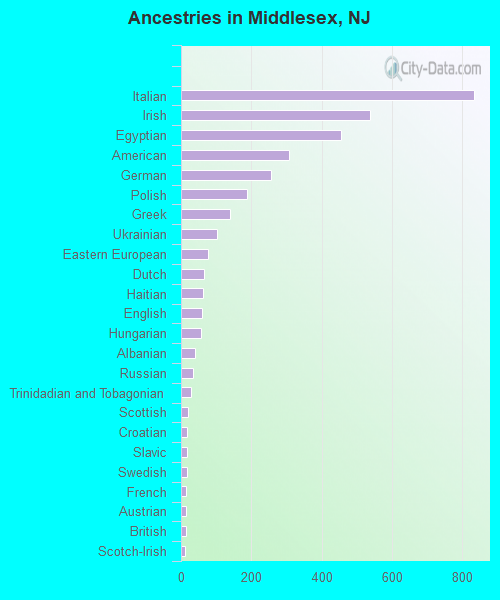
Ancestries in Middlesex
834 11.6% Italian537 7.5% Irish454 6.3% Egyptian308 4.3% American255 3.5% German189 2.6% Polish139 1.9% Greek103 1.4% Ukrainian77 1.1% Eastern European66 0.9% Dutch63 0.9% Haitian59 0.8% English56 0.8% Hungarian39 0.5% Albanian35 0.5% Russian29 0.4% Trinidadian and Tobagonian19 0.3% Scottish18 0.3% Croatian17 0.2% Slavic17 0.2% Swedish15 0.2% French14 0.2% Austrian14 0.2% British12 0.2% Scotch-Irish
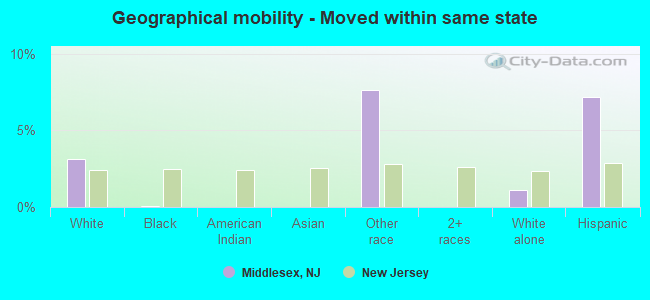
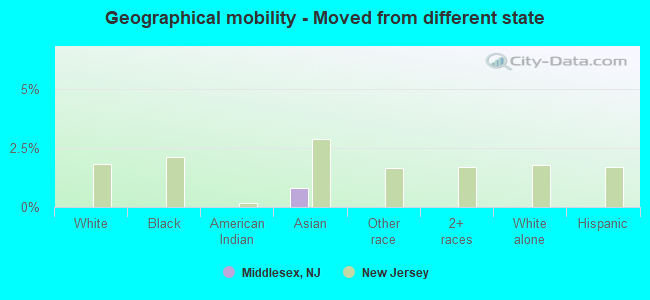
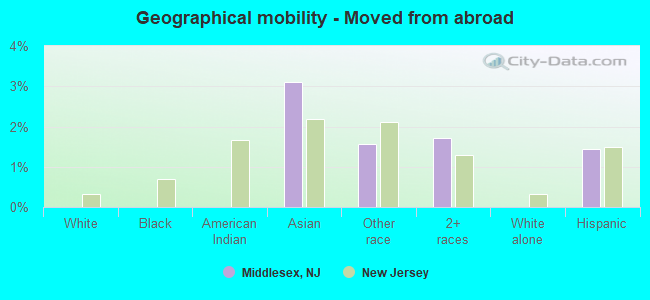
Geographical mobility in Middlesex Same house 1 year ago 6,877 91.7% White (Caucasian)1,035 99.9% Black or African American532 96.6% American Indian / Alaska Native1,440 89.8% Asian1,949 91.7% Other race1,381 95.0% Two or more races7,350 96.4% White alone, not Hispanic / Latino3,269 82.3% Hispanic or LatinoMoved within same county 361 4.8% White / Caucasian113 7.0% Asian69 4.7% Two or more races207 2.7% White alone, not Hispanic / Latino251 6.3% Hispanic or LatinoMoved within same state 236 3.2% White / Caucasian1 0.1% Black or African American162 7.6% Other race85 1.1% White alone, not Hispanic / Latino285 7.2% Hispanic or LatinoMoved from different state 13 0.8% AsianMoved from abroad 50 3.1% Asian33 1.6% Other race25 1.7% Two or more races58 1.5% Hispanic or Latino
Children Nativity (place of birth) in Middlesex
Children under 6 years - Living with two parents Both parents native 405 100.0% NativeBoth parents foreign-born 400 100.0% NativeOne native, one foreign-born parent 13 100.0% NativeChildren under 6 years - Living with one parent Native parent 19 100.0% NativeChildren 6 to 17 years - Living with two parents Both parents native 728 100.0% NativeBoth parents foreign-born 423 77.9% Native120 22.1% Foreign-bornOne native, one foreign-born parent 227 100.0% NativeChildren 6 to 17 years - Living with one parent Native parent 446 100.0% NativeForeign-born parent 183 52.6% Native164 47.4% Foreign-born