Races in Minneapolis, Minnesota (MN) Detailed Stats
Data:
Races - White alone (%)
Races - White alone (% change since 2000)
Races - Black alone (%)
Races - Black alone (% change since 2000)
Races - American Indian alone (%)
Races - American Indian alone (% change since 2000)
Races - Asian alone (%)
Races - Asian alone (% change since 2000)
Races - Hispanic (%)
Races - Hispanic (% change since 2000)
Races - Native Hawaiian and Other Pacific Islander alone (%)
Races - Native Hawaiian and Other Pacific Islander alone (% change since 2000)
Races - Two or more races(%)
Races - Two or more races(% change since 2000)
Races - Other race alone (%)
Races - Other race alone (% change since 2000)
Racial diversity
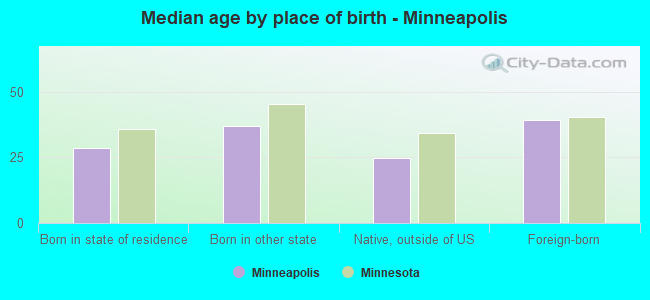
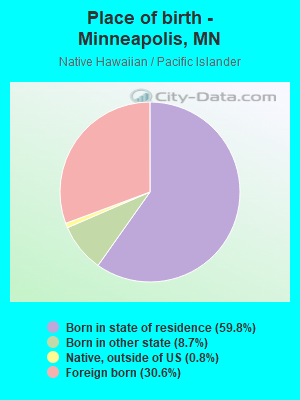
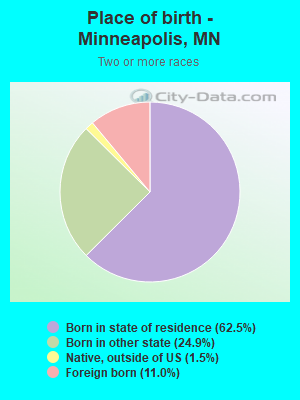
Place of birth - Born in state of residence (%)
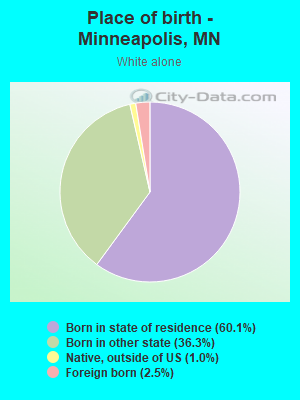
Place of birth - Born in state of residence (%) - White
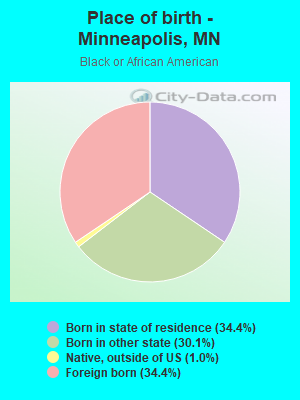
Place of birth - Born in state of residence (%) - Black or African American
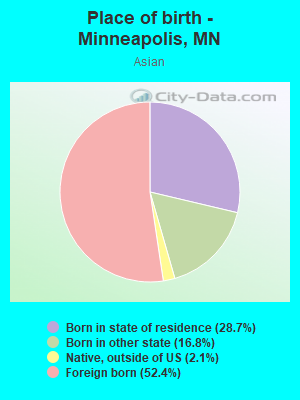
Place of birth - Born in state of residence (%) - Asian
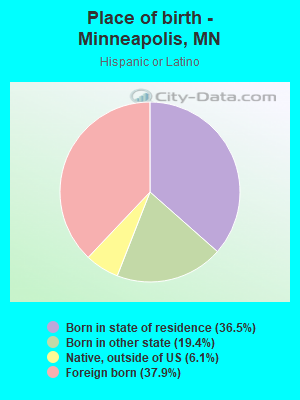
Place of birth - Born in state of residence (%) - Hispanic or Latino
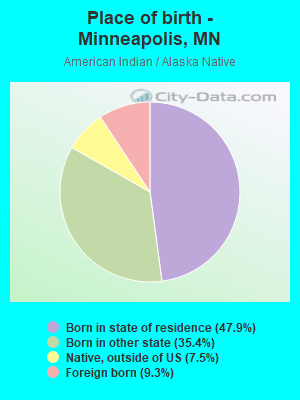
Place of birth - Born in state of residence (%) - American Indian and Alaska Native
Place of birth - Born in state of residence (%) - Multirace
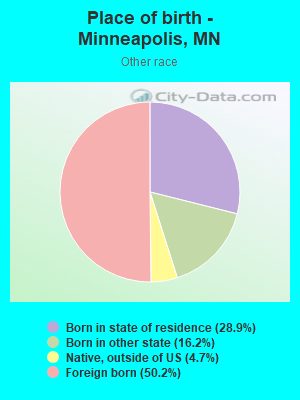
Place of birth - Born in state of residence (%) - Other Race
Place of birth - Born in other state (%)
Place of birth - Born in other state (%) - White
Place of birth - Born in other state (%) - Black or African American
Place of birth - Born in other state (%) - Asian
Place of birth - Born in other state (%) - Hispanic or Latino
Place of birth - Born in other state (%) - American Indian and Alaska Native
Place of birth - Born in other state (%) - Multirace
Place of birth - Born in other state (%) - Other Race
Place of birth - Native, outside of US (%)
Place of birth - Native, outside of US (%) - White
Place of birth - Native, outside of US (%) - Black or African American
Place of birth - Native, outside of US (%) - Asian
Place of birth - Native, outside of US (%) - Hispanic or Latino
Place of birth - Native, outside of US (%) - American Indian and Alaska Native
Place of birth - Native, outside of US (%) - Multirace
Place of birth - Native, outside of US (%) - Other Race
Place of birth - Foreign born (%)
Place of birth - Foreign born (%) - White
Place of birth - Foreign born (%) - Black or African American
Place of birth - Foreign born (%) - Asian
Place of birth - Foreign born (%) - Hispanic or Latino
Place of birth - Foreign born (%) - American Indian and Alaska Native
Place of birth - Foreign born (%) - Multirace
Place of birth - Foreign born (%) - Other Race
Residents speaking English at home (%)
Residents speaking English at home - Born in the United States (%)
Residents speaking English at home - Native, born elsewhere (%)
Residents speaking English at home - Foreign born (%)
Residents speaking Spanish at home (%)
Residents speaking Spanish at home - Born in the United States (%)
Residents speaking Spanish at home - Native, born elsewhere (%)
Residents speaking Spanish at home - Foreign born (%)
Residents speaking other language at home (%)
Residents speaking other language at home - Born in the United States (%)
Residents speaking other language at home - Native, born elsewhere (%)
Residents speaking other language at home - Foreign born (%)
Marital status - Never married (%)
Marital status - Now married (%)
Marital status - Separated (%)
Marital status - Widowed (%)
Marital status - Divorced (%)
Ancestries Reported - Arab (%)
Ancestries Reported - Czech (%)
Ancestries Reported - Danish (%)
Ancestries Reported - Dutch (%)
Ancestries Reported - English (%)
Ancestries Reported - French (%)
Ancestries Reported - French Canadian (%)
Ancestries Reported - German (%)
Ancestries Reported - Greek (%)
Ancestries Reported - Hungarian (%)
Ancestries Reported - Irish (%)
Ancestries Reported - Italian (%)
Ancestries Reported - Lithuanian (%)
Ancestries Reported - Norwegian (%)
Ancestries Reported - Polish (%)
Ancestries Reported - Portuguese (%)
Ancestries Reported - Russian (%)
Ancestries Reported - Scotch-Irish (%)
Ancestries Reported - Scottish (%)
Ancestries Reported - Slovak (%)
Ancestries Reported - Subsaharan African (%)
Ancestries Reported - Swedish (%)
Ancestries Reported - Swiss (%)
Ancestries Reported - Ukrainian (%)
Ancestries Reported - United States (%)
Ancestries Reported - Welsh (%)
Ancestries Reported - West Indian (%)
Ancestries Reported - Other (%)
Geographical mobility - Same house 1 year ago (%)
Geographical mobility - Same house 1 year ago (%) - White
Geographical mobility - Same house 1 year ago (%) - Black or African American
Geographical mobility - Same house 1 year ago (%) - Asian
Geographical mobility - Same house 1 year ago (%) - Hispanic or Latino
Geographical mobility - Same house 1 year ago (%) - American Indian and Alaska Native
Geographical mobility - Same house 1 year ago (%) - Multirace
Geographical mobility - Same house 1 year ago (%) - Other Race
Geographical mobility - Moved within same county (%)
Geographical mobility - Moved within same county (%) - White
Geographical mobility - Moved within same county (%) - Black or African American
Geographical mobility - Moved within same county (%) - Asian
Geographical mobility - Moved within same county (%) - Hispanic or Latino
Geographical mobility - Moved within same county (%) - American Indian and Alaska Native
Geographical mobility - Moved within same county (%) - Multirace
Geographical mobility - Moved within same county (%) - Other Race
Geographical mobility - Moved from different county within same state (%)
Geographical mobility - Moved from different county within same state (%) - White
Geographical mobility - Moved from different county within same state (%) - Black or African American
Geographical mobility - Moved from different county within same state (%) - Asian
Geographical mobility - Moved from different county within same state (%) - Hispanic or Latino
Geographical mobility - Moved from different county within same state (%) - American Indian and Alaska Native
Geographical mobility - Moved from different county within same state (%) - Multirace
Geographical mobility - Moved from different county within same state (%) - Other Race
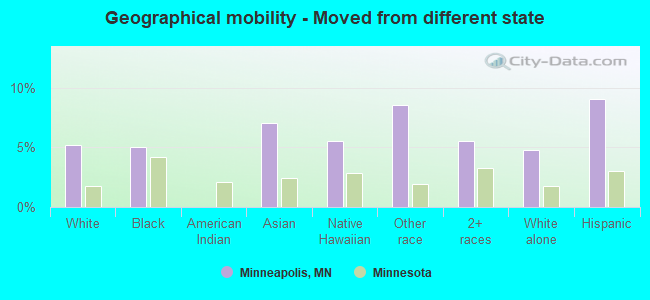
Geographical mobility - Moved from different state (%)
Geographical mobility - Moved from different state (%) - White
Geographical mobility - Moved from different state (%) - Black or African American
Geographical mobility - Moved from different state (%) - Asian
Geographical mobility - Moved from different state (%) - Hispanic or Latino
Geographical mobility - Moved from different state (%) - American Indian and Alaska Native
Geographical mobility - Moved from different state (%) - Multirace
Geographical mobility - Moved from different state (%) - Other Race
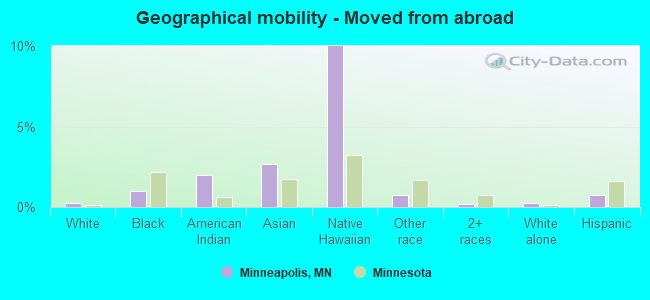
Geographical mobility - Moved from abroad (%)
Geographical mobility - Moved from abroad (%) - White
Geographical mobility - Moved from abroad (%) - Black or African American
Geographical mobility - Moved from abroad (%) - Asian
Geographical mobility - Moved from abroad (%) - Hispanic or Latino
Geographical mobility - Moved from abroad (%) - American Indian and Alaska Native
Geographical mobility - Moved from abroad (%) - Multirace
Geographical mobility - Moved from abroad (%) - Other Race
Place of birth for the foreign-born population - Ireland (%)
Place of birth for the foreign-born population - Denmark (%)
Place of birth for the foreign-born population - Norway (%)
Place of birth for the foreign-born population - Sweden (%)
Place of birth for the foreign-born population - United Kingdom (%)
Place of birth for the foreign-born population - England (%)
Place of birth for the foreign-born population - Scotland (%)
Place of birth for the foreign-born population - Other Northern Europe (%)
Place of birth for the foreign-born population - Austria (%)
Place of birth for the foreign-born population - Belgium (%)
Place of birth for the foreign-born population - France (%)
Place of birth for the foreign-born population - Germany (%)
Place of birth for the foreign-born population - Netherlands (%)
Place of birth for the foreign-born population - Switzerland (%)
Place of birth for the foreign-born population - Other Western Europe (%)
Place of birth for the foreign-born population - Greece (%)
Place of birth for the foreign-born population - Italy (%)
Place of birth for the foreign-born population - Portugal (%)
Place of birth for the foreign-born population - Spain (%)
Place of birth for the foreign-born population - Other Southern Europe (%)
Place of birth for the foreign-born population - Albania (%)
Place of birth for the foreign-born population - Belarus (%)
Place of birth for the foreign-born population - Bosnia and Herzegovina (%)
Place of birth for the foreign-born population - Bulgaria (%)
Place of birth for the foreign-born population - Croatia (%)
Place of birth for the foreign-born population - Czechoslovakia (%)
Place of birth for the foreign-born population - Hungary (%)
Place of birth for the foreign-born population - Latvia (%)
Place of birth for the foreign-born population - Lithuania (%)
Place of birth for the foreign-born population - North Macedonia (Macedonia) (%)
Place of birth for the foreign-born population - Moldova (%)
Place of birth for the foreign-born population - Poland (%)
Place of birth for the foreign-born population - Romania (%)
Place of birth for the foreign-born population - Russia (%)
Place of birth for the foreign-born population - Serbia (%)
Place of birth for the foreign-born population - Ukraine (%)
Place of birth for the foreign-born population - Other Eastern Europe (%)
Place of birth for the foreign-born population - China (%)
Place of birth for the foreign-born population - Hong Kong (%)
Place of birth for the foreign-born population - Taiwan (%)
Place of birth for the foreign-born population - Japan (%)
Place of birth for the foreign-born population - Korea (%)
Place of birth for the foreign-born population - Other Eastern Asia (%)
Place of birth for the foreign-born population - Afghanistan (%)
Place of birth for the foreign-born population - Bangladesh (%)
Place of birth for the foreign-born population - India (%)
Place of birth for the foreign-born population - Iran (%)
Place of birth for the foreign-born population - Kazakhstan (%)
Place of birth for the foreign-born population - Nepal (%)
Place of birth for the foreign-born population - Pakistan (%)
Place of birth for the foreign-born population - Sri Lanka (%)
Place of birth for the foreign-born population - Uzbekistan (%)
Place of birth for the foreign-born population - Other South Central Asia (%)
Place of birth for the foreign-born population - Burma (%)
Place of birth for the foreign-born population - Cambodia (%)
Place of birth for the foreign-born population - Indonesia (%)
Place of birth for the foreign-born population - Laos (%)
Place of birth for the foreign-born population - Malaysia (%)
Place of birth for the foreign-born population - Philippines (%)
Place of birth for the foreign-born population - Singapore (%)
Place of birth for the foreign-born population - Thailand (%)
Place of birth for the foreign-born population - Vietnam (%)
Place of birth for the foreign-born population - Other South Eastern Asia (%)
Place of birth for the foreign-born population - Armenia (%)
Place of birth for the foreign-born population - Iraq (%)
Place of birth for the foreign-born population - Israel (%)
Place of birth for the foreign-born population - Jordan (%)
Place of birth for the foreign-born population - Kuwait (%)
Place of birth for the foreign-born population - Lebanon (%)
Place of birth for the foreign-born population - Saudi Arabia (%)
Place of birth for the foreign-born population - Syria (%)
Place of birth for the foreign-born population - Turkey (%)
Place of birth for the foreign-born population - Yemen (%)
Place of birth for the foreign-born population - Other Western Asia (%)
Place of birth for the foreign-born population - Eritrea (%)
Place of birth for the foreign-born population - Ethiopia (%)
Place of birth for the foreign-born population - Kenya (%)
Place of birth for the foreign-born population - Somalia (%)
Place of birth for the foreign-born population - Uganda (%)
Place of birth for the foreign-born population - Zimbabwe (%)
Place of birth for the foreign-born population - Other Eastern Africa (%)
Place of birth for the foreign-born population - Cameroon (%)
Place of birth for the foreign-born population - Congo (%)
Place of birth for the foreign-born population - Democratic Republic of Congo (Zaire) (%)
Place of birth for the foreign-born population - Other Middle Africa (%)
Place of birth for the foreign-born population - Egypt (%)
Place of birth for the foreign-born population - Morocco (%)
Place of birth for the foreign-born population - Sudan (%)
Place of birth for the foreign-born population - Other Northern Africa (%)
Place of birth for the foreign-born population - South Africa (%)
Place of birth for the foreign-born population - Other Southern Africa (%)
Place of birth for the foreign-born population - Cabo Verde (%)
Place of birth for the foreign-born population - Ghana (%)
Place of birth for the foreign-born population - Liberia (%)
Place of birth for the foreign-born population - Nigeria (%)
Place of birth for the foreign-born population - Senegal (%)
Place of birth for the foreign-born population - Sierra Leone (%)
Place of birth for the foreign-born population - Other Western Africa (%)
Place of birth for the foreign-born population - Australia (%)
Place of birth for the foreign-born population - New Zealand (%)
Place of birth for the foreign-born population - Fiji (%)
Place of birth for the foreign-born population - Micronesia (%)
Place of birth for the foreign-born population - Bahamas (%)
Place of birth for the foreign-born population - Barbados (%)
Place of birth for the foreign-born population - Cuba (%)
Place of birth for the foreign-born population - Dominica (%)
Place of birth for the foreign-born population - Dominican Republic (%)
Place of birth for the foreign-born population - Grenada (%)
Place of birth for the foreign-born population - Haiti (%)
Place of birth for the foreign-born population - Jamaica (%)
Place of birth for the foreign-born population - St. Vincent and the Grenadines (%)
Place of birth for the foreign-born population - Trinidad and Tobago (%)
Place of birth for the foreign-born population - West Indies (%)
Place of birth for the foreign-born population - Other Caribbean (%)
Place of birth for the foreign-born population - Belize (%)
Place of birth for the foreign-born population - Costa Rica (%)
Place of birth for the foreign-born population - El Salvador (%)
Place of birth for the foreign-born population - Guatemala (%)
Place of birth for the foreign-born population - Honduras (%)
Place of birth for the foreign-born population - Mexico (%)
Place of birth for the foreign-born population - Nicaragua (%)
Place of birth for the foreign-born population - Panama (%)
Place of birth for the foreign-born population - Other Central America (%)
Place of birth for the foreign-born population - Argentina (%)
Place of birth for the foreign-born population - Bolivia (%)
Place of birth for the foreign-born population - Brazil (%)
Place of birth for the foreign-born population - Chile (%)
Place of birth for the foreign-born population - Colombia (%)
Place of birth for the foreign-born population - Ecuador (%)
Place of birth for the foreign-born population - Guyana (%)
Place of birth for the foreign-born population - Peru (%)
Place of birth for the foreign-born population - Uruguay (%)
Place of birth for the foreign-born population - Venezuela (%)
Place of birth for the foreign-born population - Other South America (%)
Place of birth for the foreign-born population - Canada (%)
Place of birth for the foreign-born population - Other Northern America (%)
Place of birth for the foreign-born population - Other (%)
Latest news about races in Minneapolis, MN collected exclusively by city-data.com from local newspapers, TV, and radio stations
According to 2022 data, the most numerous races in Minneapolis, MN are White alone (249,115 residents), Black alone (81,897 residents), and Hispanic (41,080 residents). 78.1% of Minneapolis residents speak English at home. 15.1% of Minneapolis, MN residents are foreign-born (5.9% born in Africa, 3.8% born in Latin America, 3.5% born in Asia), which is 47.0% greater than the foreign-born rate of 8.0% across the entire state of Minnesota.
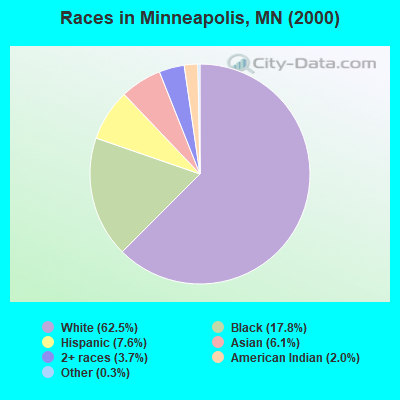
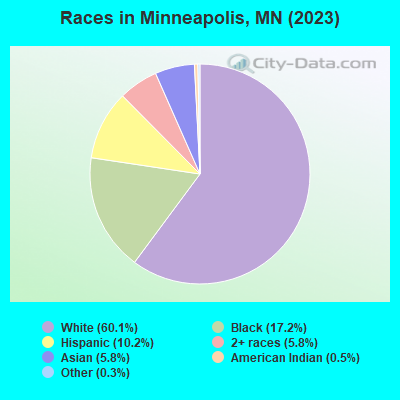
Race distribution in Minneapolis
2000 2022
239,080 62.5% White alone 67,966 17.8% Black alone 29,175 7.6% Hispanic 23,292 6.1% Asian alone 14,120 3.7% Two or more races 7,689 2.0% American Indian alone 1,046 0.3% Other race alone 250 0.07% Native Hawaiian and Other
249,115 58.6% White alone 81,897 19.3% Black alone 41,080 9.7% Hispanic 25,647 6.0% Two or more races 21,915 5.2% Asian alone 2,831 0.7% American Indian alone 2,488 0.6% Other race alone 131 0.03% Native Hawaiian and Other
2000 2022
4,337,143 88.2% White alone 168,813 3.4% Black alone 143,382 2.9% Hispanic 141,083 2.9% Asian alone 70,304 1.4% Two or more races 52,009 1.1% American Indian alone 5,031 0.1% Other race alone 1,714 0.03% Native Hawaiian and Other
4,356,347 76.2% White alone 395,179 6.9% Black alone 333,830 5.8% Hispanic 294,800 5.2% Asian alone 259,649 4.5% Two or more races 42,125 0.7% American Indian alone 32,976 0.6% Other race alone 2,278 0.04% Native Hawaiian and Other
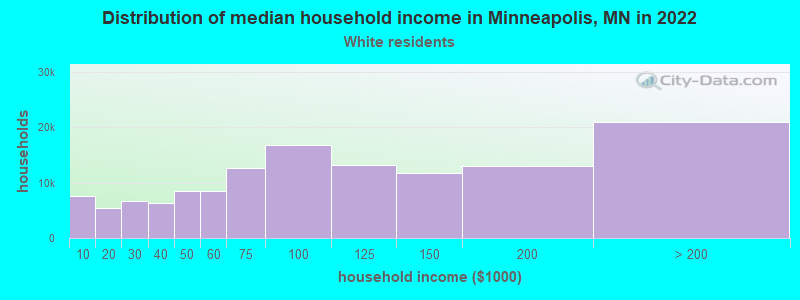
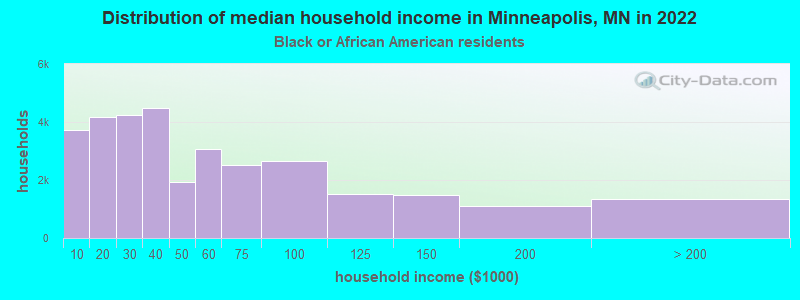
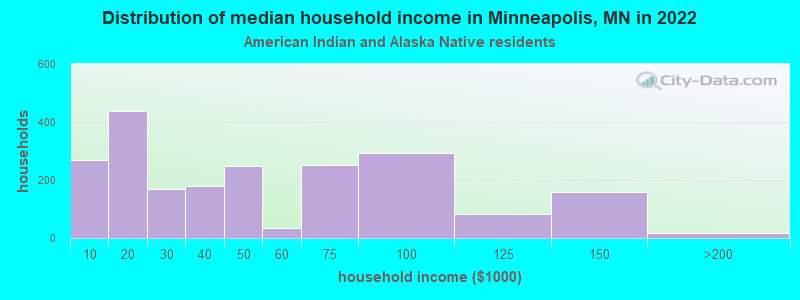
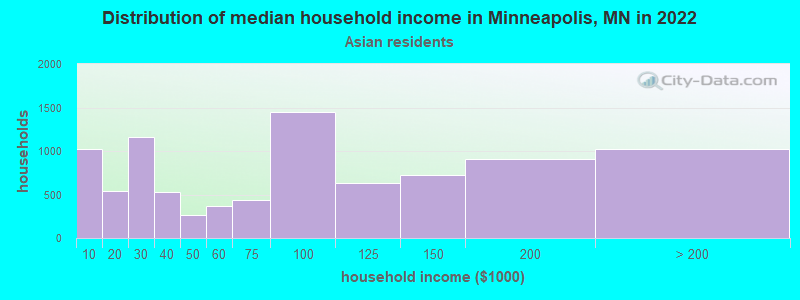
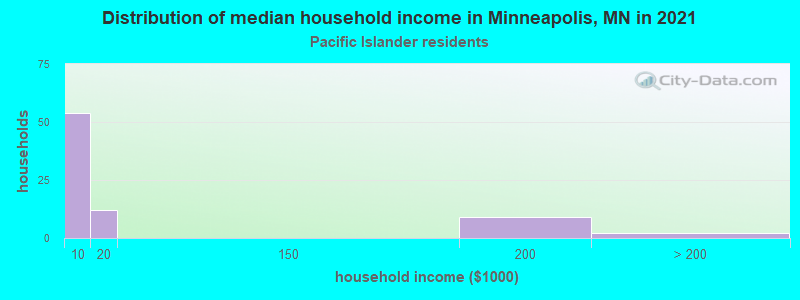
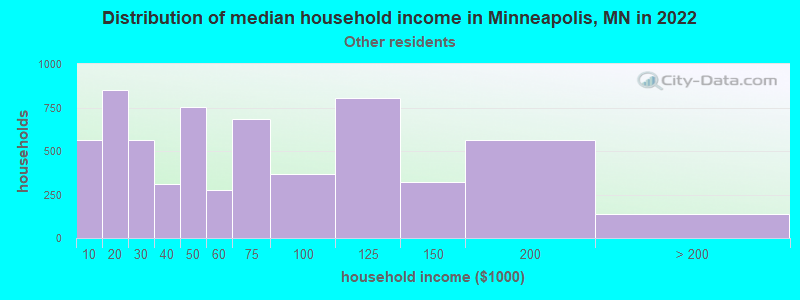
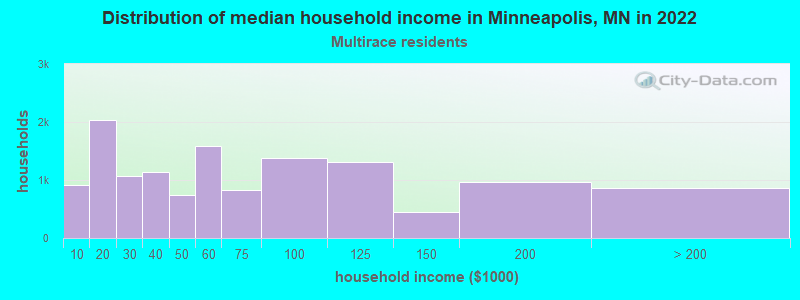
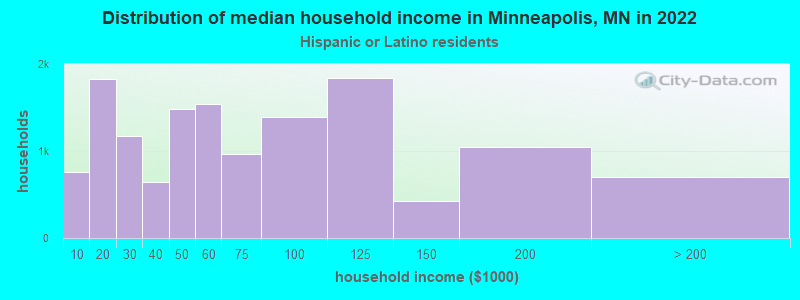
Income and house value in Minneapolis Median household income in 2022 $87,238 White non-Hispanic householders$37,494 Black householders$38,139 American Indian and Alaska Native householders$78,405 Asian householders$51,414 Some other race householders$53,689 Two or more races householders$54,445 Hispanic or Latino race householdersMedian 2022 house value $361,350 White Non-Hispanic householders$272,464 Black or African American householders$269,409 American Indian or Alaska Native householders $278,878 Asian householders$419,997 Native Hawaiian and other Pacific Islander householders$271,853 Some other race householders$297,205 Two or more races householders$298,122 Hispanic or Latino householders
Median age by race in Minneapolis
36.0 Median age for White residents36.2 35.8 30.9 Median age for Black or African American residents30.8 30.9 28.5 Median age for American Indian / Alaska Native residents25.9 34.5 28.7 Median age for Asian residents28.7 28.7 31.7 Median age for Native Hawaiian / Pacific Islander residents34.2 16.1 33.5 Median age for Other race residents33.7 33.2 24.5 Median age for Two or more races residents24.3 24.5 36.2 Median age for White alone residents36.4 36.1 27.4 Median age for Hispanic or Latino residents30.0 25.1
Owner/renter occupied households by race in Minneapolis
House owners and renters - White residents 75,540 57.7% Owner occupied55,365 42.3% Renter occupiedHouse owners and renters - Black or African American residents 6,843 21.2% Owner occupied25,402 78.8% Renter occupiedHouse owners and renters - American Indian / Alaska Native residents 436 21.5% Owner occupied1,595 78.5% Renter occupiedHouse owners and renters - Asian residents 3,571 39.6% Owner occupied5,458 60.4% Renter occupiedHouse owners and renters - Native Hawaiian / Pacific Islander residents 15 24.2% Owner occupied47 75.8% Renter occupiedHouse owners and renters - Other race residents 1,841 29.7% Owner occupied4,356 70.3% Renter occupiedHouse owners and renters - Two or more races residents 3,930 29.6% Owner occupied9,326 70.4% Renter occupiedHouse owners and renters - White alone residents 75,039 58.5% Owner occupied53,309 41.5% Renter occupiedHouse owners and renters - Hispanic or Latino residents 2,989 21.7% Owner occupied10,798 78.3% Renter occupied
Language usage in Minneapolis
English speakers - Total 78.1% of residents of Minneapolis speak English at home.
6.8% of residents speak Spanish at home 13,891 50.8% Speak English very well13,450 49.2% Speak English less than very well15.2% of residents speak other language at home 39,906 65.4% Speak English very well21,112 34.6% Speak English less than very well
English speakers - Born in the United States 90.8% of residents of Minneapolis speak English at home.
2.7% of residents speak Spanish at home 2,995 84.6% Speak English very well545 15.4% Speak English less than very well6.5% of residents speak other language at home 7,463 85.9% Speak English very well1,226 14.1% Speak English less than very well
English speakers - Native, born elsewhere 67.4% of residents of Minneapolis speak English at home.
20.5% of residents speak Spanish at home 744 62.4% Speak English very well448 37.6% Speak English less than very well12.2% of residents speak other language at home 353 49.8% Speak English very well356 50.2% Speak English less than very well
English speakers - Foreign-born 18.6% of residents of Minneapolis speak English at home.
22.0% of residents speak Spanish at home 4,601 33.5% Speak English very well9,130 66.5% Speak English less than very well59.4% of residents speak other language at home 19,894 53.7% Speak English very well17,156 46.3% Speak English less than very well
White (Caucasian) - Speak only English Native:
95.9% (227,538)Foreign-born:
39.1% (3,153)
White (Caucasian) - Speak another language Native:
4.1% (9,791)Foreign-born:
60.9% (4,911)
Black or African American - Speak only English Native:
76.2% (37,317)Foreign-born:
13.3% (3,752)
Black or African American - Speak another language Native:
23.8% (11,645)Foreign-born:
86.7% (24,472)
American Indian / Alaska Native - Speak only English Native:
65.1% (2,727)Foreign-born:
44.3% (244)
American Indian / Alaska Native - Speak another language Native:
35.5% (1,489)Foreign-born:
53.8% (296)
Asian - Speak only English Native:
35.6% (3,298)Foreign-born:
18.9% (2,168)
Asian - Speak another language Native:
64.4% (5,970)Foreign-born:
81.1% (9,297)
Native Hawaiian / Pacific Islander - Speak another language Native:
0.6% (1)Foreign-born:
91.2% (48)
Other race - Speak only English Native:
46.0% (4,171)Foreign-born:
14.2% (1,398)
Other race - Speak another language Native:
54.0% (4,888)Foreign-born:
85.8% (8,475)
Two or more races - Speak only English Native:
86.3% (27,567)Foreign-born:
18.8% (828)
Two or more races - Speak another language Native:
13.7% (4,372)Foreign-born:
81.2% (3,569)
White alone - Speak only English Native:
96.6% (224,789)Foreign-born:
47.5% (3,012)
White alone - Speak another language Native:
3.4% (7,956)Foreign-born:
52.5% (3,326)
Hispanic or Latino - Speak only English Native:
55.6% (12,671)Foreign-born:
14.4% (2,235)
Hispanic or Latino - Speak another language Native:
44.4% (10,128)Foreign-born:
85.6% (13,271)
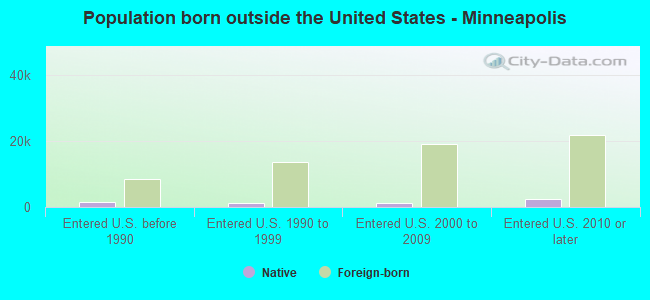
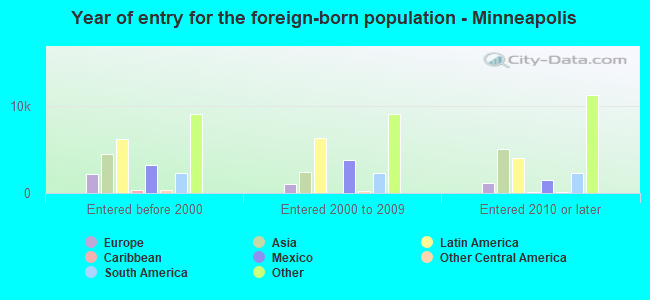
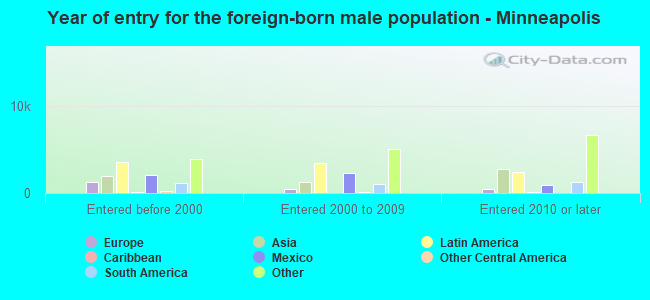
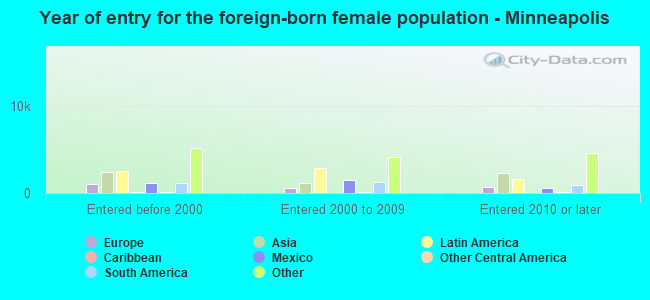
Foreign-born residents in Minneapolis 63,948 residents are foreign born (5.9% Africa , 3.8% Latin America , 3.5% Asia ).
This city:
15.1%Minnesota:
8.5%
Marital status for residents in Minneapolis Marital status - White (Caucasian) population 15 years and over
Males 51.2% Never married38.1% Now married0.7% Separated1.2% Widowed8.7% DivorcedFemales 48.5% Never married36.0% Now married0.4% Separated4.1% Widowed11.0% DivorcedWomen who gave birth in the past 12 months Now married:
91.9% (2,832)Unmarried:
8.1% (248)
Women who did not give birth in the past 12 months Now married:
30.3% (21,647)Unmarried:
69.7% (49,788)
Marital status - Black or African American population 15 years and over
Males 56.0% Never married27.1% Now married3.2% Separated1.1% Widowed12.6% DivorcedFemales 55.6% Never married29.5% Now married1.6% Separated5.3% Widowed8.0% DivorcedWomen who gave birth in the past 12 months Now married:
64.7% (264)Unmarried:
35.3% (144)
Women who did not give birth in the past 12 months Now married:
26.5% (5,799)Unmarried:
73.5% (16,099)
Marital status - American Indian / Alaska Native population 15 years and over
Males 69.8% Never married17.2% Now married0.2% Separated2.7% Widowed10.1% DivorcedFemales 53.1% Never married20.4% Now married2.0% Separated4.7% Widowed19.8% DivorcedWomen who gave birth in the past 12 months Now married:
12.5% (11)Unmarried:
87.5% (74)
Women who did not give birth in the past 12 months Now married:
24.1% (356)Unmarried:
75.9% (1,119)
Marital status - Asian population 15 years and over
Males 55.5% Never married37.3% Now married0.6% Separated1.2% Widowed5.4% DivorcedFemales 49.0% Never married43.1% Now married0.0% Separated1.6% Widowed6.3% DivorcedWomen who gave birth in the past 12 months Now married:
58.9% (279)Unmarried:
41.1% (195)
Women who did not give birth in the past 12 months Now married:
39.6% (2,942)Unmarried:
60.4% (4,494)
Marital status - Native Hawaiian / Pacific Islander population 15 years and over
Males 96.3% Never married3.7% Now married0.0% Separated0.0% Widowed0.0% DivorcedFemales 56.1% Never married43.9% Now married0.0% Separated0.0% Widowed0.0% DivorcedWomen who did not give birth in the past 12 months Now married:
30.3% (15)Unmarried:
69.7% (33)
Marital status - Other race population 15 years and over
Males 43.1% Never married42.8% Now married9.7% Separated0.0% Widowed4.5% DivorcedFemales 42.4% Never married46.1% Now married1.3% Separated1.8% Widowed8.4% DivorcedWomen who gave birth in the past 12 months Now married:
80.0% (70)Unmarried:
20.0% (17)
Women who did not give birth in the past 12 months Now married:
41.9% (2,166)Unmarried:
58.1% (3,003)
Marital status - Two or more races population 15 years and over
Males 66.7% Never married21.7% Now married2.2% Separated0.0% Widowed9.4% DivorcedFemales 70.2% Never married25.5% Now married0.0% Separated0.6% Widowed3.6% DivorcedWomen who gave birth in the past 12 months Now married:
30.1% (125)Unmarried:
69.9% (290)
Women who did not give birth in the past 12 months Now married:
20.1% (2,292)Unmarried:
79.9% (9,119)
Marital status - White alone, not Hispanic / Latino population 15 years and over
Males 51.2% Never married38.2% Now married0.6% Separated1.2% Widowed8.8% DivorcedFemales 47.8% Never married36.5% Now married0.4% Separated4.2% Widowed11.1% DivorcedWomen who gave birth in the past 12 months Now married:
92.6% (2,654)Unmarried:
7.4% (213)
Women who did not give birth in the past 12 months Now married:
30.8% (21,407)Unmarried:
69.2% (48,162)
Marital status - Hispanic or Latino population 15 years and over
Males 51.3% Never married34.6% Now married5.7% Separated0.4% Widowed8.1% DivorcedFemales 59.9% Never married33.7% Now married0.6% Separated0.0% Widowed5.7% DivorcedWomen who gave birth in the past 12 months Now married:
83.6% (178)Unmarried:
16.4% (35)
Women who did not give birth in the past 12 months Now married:
30.8% (3,668)Unmarried:
69.2% (8,229)
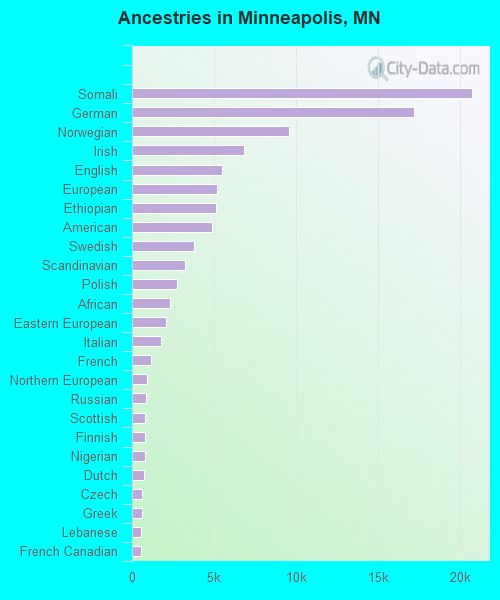
Ancestries in Minneapolis
20,742 11.7% Somali17,227 9.7% German9,604 5.4% Norwegian6,813 3.8% Irish5,500 3.1% English5,156 2.9% European5,123 2.9% Ethiopian4,895 2.7% American3,778 2.1% Swedish3,231 1.8% Scandinavian2,724 1.5% Polish2,323 1.3% African2,059 1.2% Eastern European1,794 1.0% Italian1,163 0.7% French929 0.5% Northern European849 0.5% Russian820 0.5% Scottish770 0.4% Finnish765 0.4% Nigerian736 0.4% Dutch639 0.4% Czech594 0.3% Greek569 0.3% Lebanese561 0.3% French Canadian440 0.2% Ukrainian364 0.2% Canadian351 0.2% Latvian339 0.2% Scotch-Irish317 0.2% Iranian295 0.2% Danish274 0.2% Swiss261 0.1% Jamaican258 0.1% British220 0.1% Liberian211 0.1% Trinidadian and Tobagonian190 0.1% Arab187 0.1% Ugandan181 0.1% German Russian181 0.1% Yugoslavian179 0.1% Haitian178 0.10% Moroccan177 0.10% Bahamian173 0.10% Czechoslovakian173 0.10% Sierra Leonean159 0.09% Brazilian143 0.08% Welsh139 0.08% Austrian139 0.08% Belgian134 0.08% Kenyan134 0.08% Slovak130 0.07% Romanian126 0.07% Guyanese123 0.07% Turkish120 0.07% Hungarian120 0.07% Ghanaian104 0.06% Egyptian102 0.06% Australian93 0.05% Luxembourger88 0.05% Lithuanian87 0.05% Albanian83 0.05% Jordanian82 0.05% Syrian70 0.04% Icelander69 0.04% Cajun61 0.03% Croatian59 0.03% Serbian54 0.03% Slovene54 0.03% Iraqi49 0.03% West Indian48 0.03% Armenian47 0.03% Carpatho Rusyn47 0.03% Cypriot47 0.03% Israeli46 0.03% Bulgarian46 0.03% Belizean43 0.02% Portuguese40 0.02% Slavic38 0.02% Palestinian29 0.02% Cape Verdean26 0.01% Sudanese24 0.01% South African19 0.01% Estonian18 0.01% Pennsylvania German14 0.01% Alsatian12 0.01% Macedonian
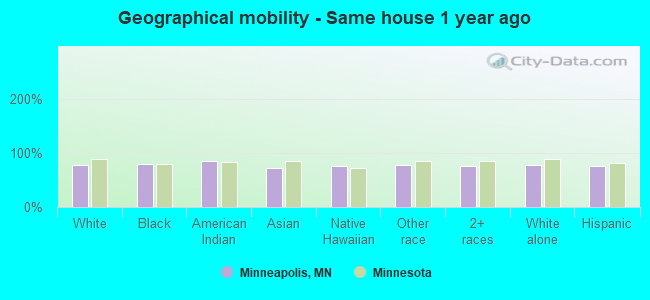
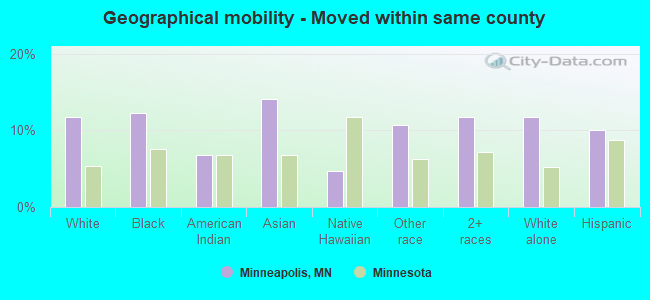
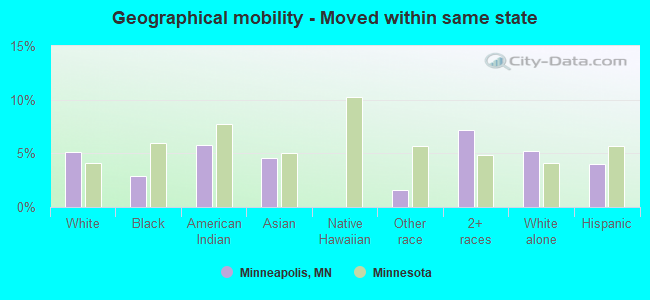
Geographical mobility in Minneapolis Same house 1 year ago 196,560 77.7% White (Caucasian)64,319 78.8% Black or African American3,495 85.5% American Indian / Alaska Native15,607 71.7% Asian131 76.1% Native Hawaiian / Pacific Islander15,417 78.3% Other race29,871 75.3% Two or more races191,852 78.0% White alone, not Hispanic / Latino30,798 76.1% Hispanic or LatinoMoved within same county 29,650 11.7% White / Caucasian10,052 12.3% Black or African American275 6.7% American Indian / Alaska Native3,065 14.1% Asian8 4.7% Native Hawaiian / Pacific Islander2,116 10.8% Other race4,661 11.8% Two or more races28,999 11.8% White alone, not Hispanic / Latino4,069 10.1% Hispanic or LatinoMoved within same state 12,994 5.1% White / Caucasian2,322 2.8% Black or African American237 5.8% American Indian / Alaska Native986 4.5% Asian319 1.6% Other race2,838 7.2% Two or more races12,780 5.2% White alone, not Hispanic / Latino1,603 4.0% Hispanic or LatinoMoved from different state 13,076 5.2% White / Caucasian4,128 5.1% Black or African American1,536 7.1% Asian10 5.5% Native Hawaiian / Pacific Islander1,686 8.6% Other race2,206 5.6% Two or more races11,721 4.8% White alone, not Hispanic / Latino3,673 9.1% Hispanic or LatinoMoved from abroad 620 0.2% White793 1.0% Black or African American80 2.0% American Indian / Alaska Native576 2.6% Asian17 10.0% Native Hawaiian / Pacific Islander142 0.7% Other race81 0.2% Two or more races620 0.3% White alone, not Hispanic / Latino303 0.7% Hispanic or Latino
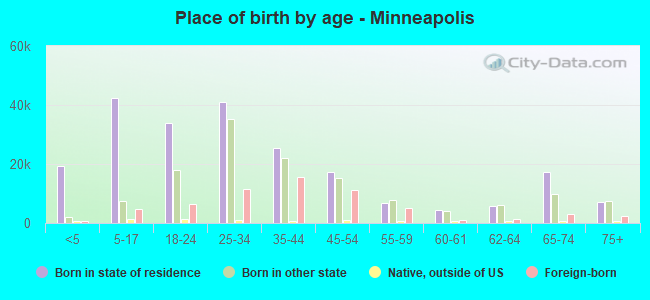
Children Nativity (place of birth) in Minneapolis
Children under 6 years - Living with two parents Both parents native 12,976 100.0% NativeBoth parents foreign-born 4,149 90.5% Native436 9.5% Foreign-bornOne native, one foreign-born parent 1,590 100.0% NativeChildren under 6 years - Living with one parent Native parent 5,299 100.0% NativeForeign-born parent 1,522 100.0% NativeChildren 6 to 17 years - Living with two parents Both parents native 17,117 100.0% NativeBoth parents foreign-born 8,566 80.6% Native2,060 19.4% Foreign-bornOne native, one foreign-born parent 3,132 92.2% Native264 7.8% Foreign-bornChildren 6 to 17 years - Living with one parent Native parent 9,958 100.0% NativeForeign-born parent 5,579 59.8% Native3,744 40.2% Foreign-born
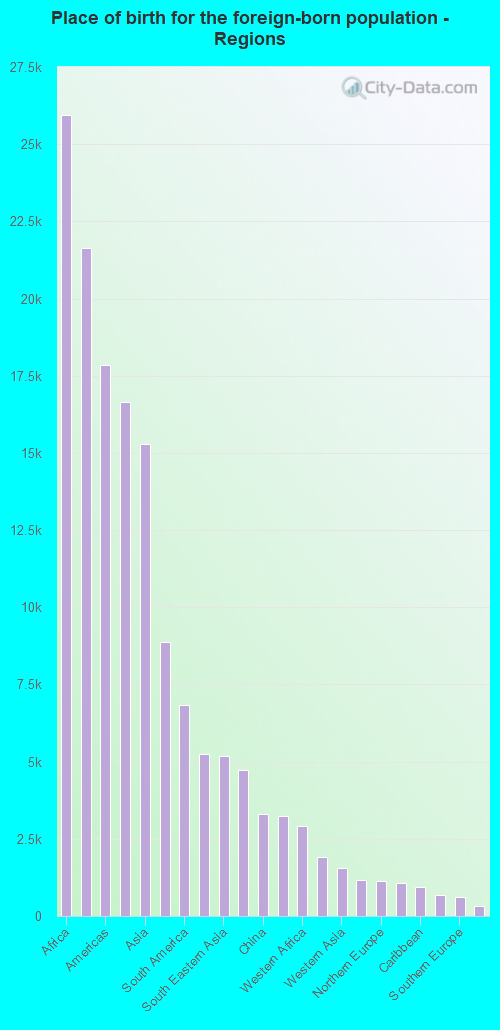
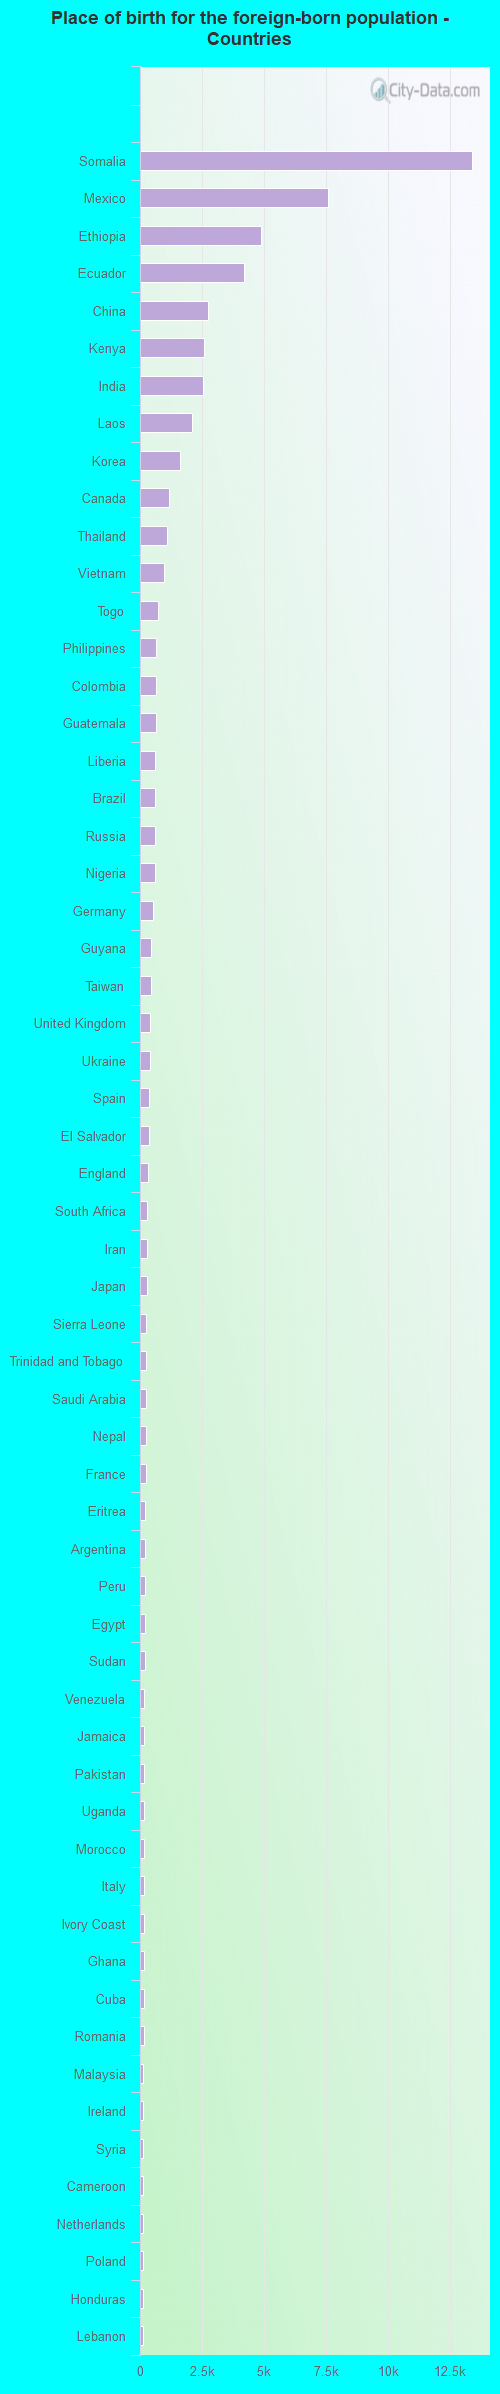
Place of birth for residents in Minneapolis 25,961 Africa21,643 Eastern Africa17,840 Americas16,659 Latin America15,277 Asia8,884 Central America6,827 South America5,250 Eastern Asia5,190 South Eastern Asia4,715 Europe3,290 China3,247 South Central Asia2,899 Western Africa1,898 Eastern Europe1,551 Western Asia1,181 Northern America1,138 Northern Europe1,069 Western Europe948 Caribbean665 Northern Africa609 Southern Europe333 Southern Africa152 Oceania148 Middle Africa113 Australia and New Zealand Subregion13,410 Somalia7,600 Mexico4,874 Ethiopia4,210 Ecuador2,763 China2,581 Kenya2,525 India2,115 Laos1,633 Korea1,181 Canada1,108 Thailand980 Vietnam711 Togo660 Philippines645 Colombia640 Guatemala624 Liberia615 Brazil600 Russia599 Nigeria538 Germany448 Guyana426 Taiwan423 United Kingdom389 Ukraine362 Spain360 El Salvador320 England298 South Africa290 Iran286 Japan259 Sierra Leone246 Trinidad and Tobago235 Saudi Arabia232 Nepal229 France219 Eritrea218 Argentina190 Peru185 Egypt182 Sudan172 Venezuela171 Jamaica166 Pakistan165 Uganda159 Morocco158 Italy153 Ivory Coast152 Ghana150 Cuba149 Romania140 Malaysia139 Ireland138 Syria137 Cameroon133 Netherlands131 Poland129 Honduras127 Lebanon120 Yemen116 Uruguay115 Cambodia115 Jordan105 Haiti104 Belarus100 Hong Kong99 Australia96 Zimbabwe94 Turkey93 Bahamas87 Latvia85 Bosnia and Herzegovina84 United Arab Emirates83 Bolivia78 Senegal77 Algeria74 Israel74 Czechoslovakia73 Greece71 Norway70 Austria70 Panama69 Kuwait67 Albania62 Chile58 Sweden56 Scotland55 Switzerland50 Costa Rica46 Iraq46 Serbia41 Belgium39 Dominican Republic35 Singapore34 Bulgaria32 Belize27 Hungary24 Cabo Verde22 Lithuania20 Indonesia18 Sri Lanka15 Portugal15 Denmark14 New Zealand13 Burma (Myanmar)10 Congo10 Azerbaijan8 Barbados7 Moldova5 Bangladesh3 Micronesia1 St. Lucia
Grandparents responsible for own grandchildren in Minneapolis
Grandparents (30 to 59 years) White / Caucasian 80 28.4% Responsible for grandchildren201 71.6% Not responsible for grandchildrenBlack or African American 424 57.7% Responsible for grandchildren311 42.3% Not responsible for grandchildrenAmerican Indian / Alaska Native 149 94.8% Responsible for grandchildren8 5.2% Not responsible for grandchildrenAsian 10 8.2% Responsible for grandchildren107 91.8% Not responsible for grandchildrenOther race 100 64.6% Responsible for grandchildren55 35.4% Not responsible for grandchildrenTwo or more races 65 81.1% Responsible for grandchildren15 18.9% Not responsible for grandchildrenWhite alone, not Hispanic / Latino 38 19.1% Responsible for grandchildren163 80.9% Not responsible for grandchildrenHispanic or Latino 200 62.3% Responsible for grandchildren121 37.7% Not responsible for grandchildrenGrandparents (60 years and over) White / Caucasian 173 19.7% Responsible for grandchildren708 80.3% Not responsible for grandchildrenBlack or African American 438 67.4% Responsible for grandchildren212 32.6% Not responsible for grandchildrenAmerican Indian / Alaska Native 7 100.0% Not responsible for grandchildrenAsian 15 12.4% Responsible for grandchildren106 87.6% Not responsible for grandchildrenOther race 68 100.0% Not responsible for grandchildrenTwo or more races 24 23.4% Responsible for grandchildren78 76.6% Not responsible for grandchildrenWhite alone, not Hispanic / Latino 157 20.1% Responsible for grandchildren624 79.9% Not responsible for grandchildrenHispanic or Latino 12 8.0% Responsible for grandchildren135 92.0% Not responsible for grandchildren
Zip codes: 55401 , 55402 , 55403 , 55404 , 55405 , 55406 , 55407 , 55408 , 55409 , 55412 , 55413 , 55414 , 55415 , 55417 , 55418 , 55419 , 55450, 55454 , 55455 .