Races in Minot, North Dakota (ND) Detailed Stats
Data:
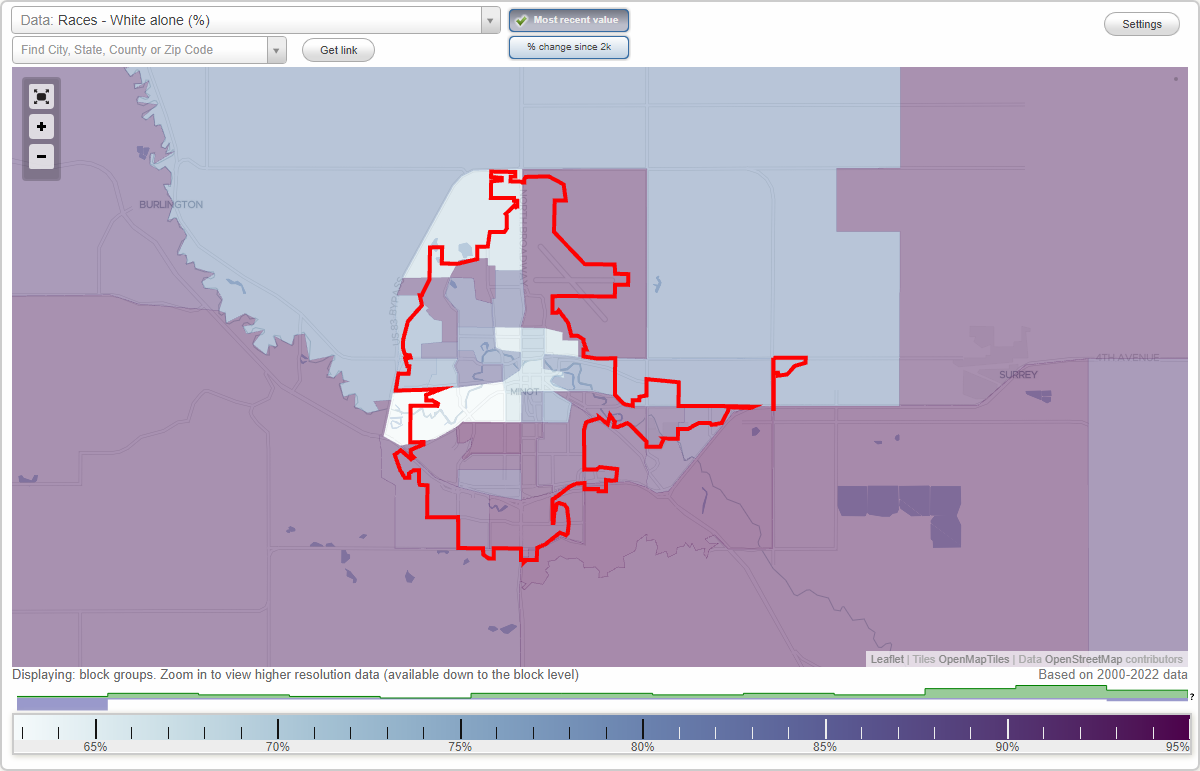
Races - White alone (%)
Races - White alone (% change since 2000)
Races - Black alone (%)
Races - Black alone (% change since 2000)
Races - American Indian alone (%)
Races - American Indian alone (% change since 2000)
Races - Asian alone (%)
Races - Asian alone (% change since 2000)
Races - Hispanic (%)
Races - Hispanic (% change since 2000)
Races - Native Hawaiian and Other Pacific Islander alone (%)
Races - Native Hawaiian and Other Pacific Islander alone (% change since 2000)
Races - Two or more races(%)
Races - Two or more races(% change since 2000)
Races - Other race alone (%)
Races - Other race alone (% change since 2000)
Racial diversity
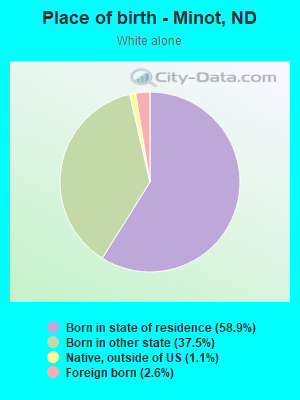
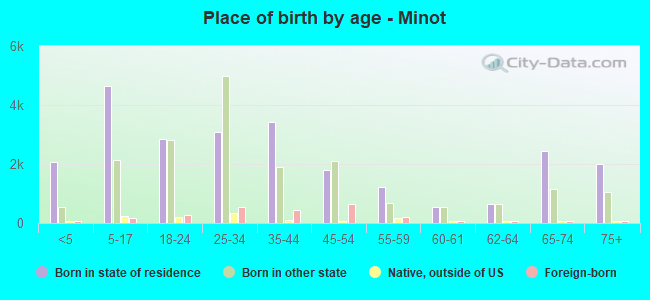
Place of birth - Born in state of residence (%)
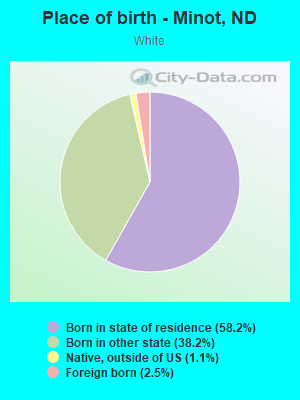
Place of birth - Born in state of residence (%) - White
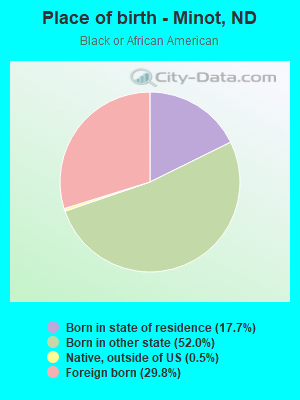
Place of birth - Born in state of residence (%) - Black or African American
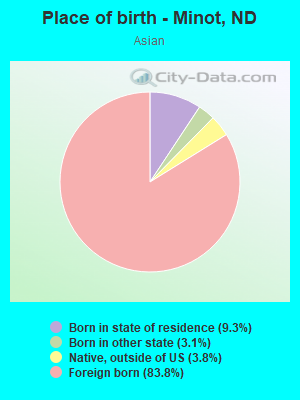
Place of birth - Born in state of residence (%) - Asian
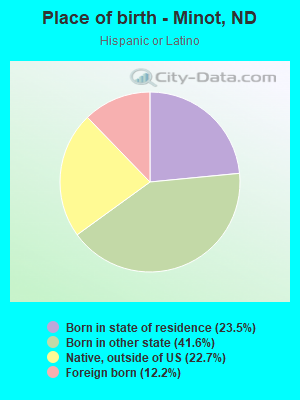
Place of birth - Born in state of residence (%) - Hispanic or Latino
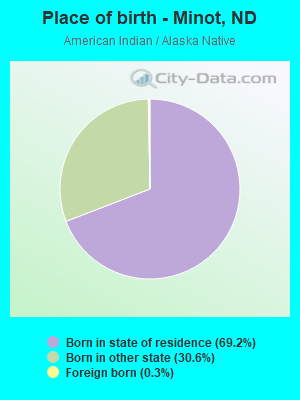
Place of birth - Born in state of residence (%) - American Indian and Alaska Native
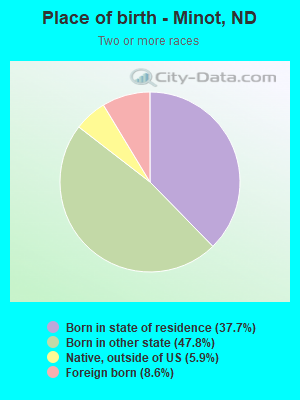
Place of birth - Born in state of residence (%) - Multirace
Place of birth - Born in state of residence (%) - Other Race
Place of birth - Born in other state (%)
Place of birth - Born in other state (%) - White
Place of birth - Born in other state (%) - Black or African American
Place of birth - Born in other state (%) - Asian
Place of birth - Born in other state (%) - Hispanic or Latino
Place of birth - Born in other state (%) - American Indian and Alaska Native
Place of birth - Born in other state (%) - Multirace
Place of birth - Born in other state (%) - Other Race
Place of birth - Native, outside of US (%)
Place of birth - Native, outside of US (%) - White
Place of birth - Native, outside of US (%) - Black or African American
Place of birth - Native, outside of US (%) - Asian
Place of birth - Native, outside of US (%) - Hispanic or Latino
Place of birth - Native, outside of US (%) - American Indian and Alaska Native
Place of birth - Native, outside of US (%) - Multirace
Place of birth - Native, outside of US (%) - Other Race
Place of birth - Foreign born (%)
Place of birth - Foreign born (%) - White
Place of birth - Foreign born (%) - Black or African American
Place of birth - Foreign born (%) - Asian
Place of birth - Foreign born (%) - Hispanic or Latino
Place of birth - Foreign born (%) - American Indian and Alaska Native
Place of birth - Foreign born (%) - Multirace
Place of birth - Foreign born (%) - Other Race
Residents speaking English at home (%)
Residents speaking English at home - Born in the United States (%)
Residents speaking English at home - Native, born elsewhere (%)
Residents speaking English at home - Foreign born (%)
Residents speaking Spanish at home (%)
Residents speaking Spanish at home - Born in the United States (%)
Residents speaking Spanish at home - Native, born elsewhere (%)
Residents speaking Spanish at home - Foreign born (%)
Residents speaking other language at home (%)
Residents speaking other language at home - Born in the United States (%)
Residents speaking other language at home - Native, born elsewhere (%)
Residents speaking other language at home - Foreign born (%)
Marital status - Never married (%)
Marital status - Now married (%)
Marital status - Separated (%)
Marital status - Widowed (%)
Marital status - Divorced (%)
Ancestries Reported - Arab (%)
Ancestries Reported - Czech (%)
Ancestries Reported - Danish (%)
Ancestries Reported - Dutch (%)
Ancestries Reported - English (%)
Ancestries Reported - French (%)
Ancestries Reported - French Canadian (%)
Ancestries Reported - German (%)
Ancestries Reported - Greek (%)
Ancestries Reported - Hungarian (%)
Ancestries Reported - Irish (%)
Ancestries Reported - Italian (%)
Ancestries Reported - Lithuanian (%)
Ancestries Reported - Norwegian (%)
Ancestries Reported - Polish (%)
Ancestries Reported - Portuguese (%)
Ancestries Reported - Russian (%)
Ancestries Reported - Scotch-Irish (%)
Ancestries Reported - Scottish (%)
Ancestries Reported - Slovak (%)
Ancestries Reported - Subsaharan African (%)
Ancestries Reported - Swedish (%)
Ancestries Reported - Swiss (%)
Ancestries Reported - Ukrainian (%)
Ancestries Reported - United States (%)
Ancestries Reported - Welsh (%)
Ancestries Reported - West Indian (%)
Ancestries Reported - Other (%)
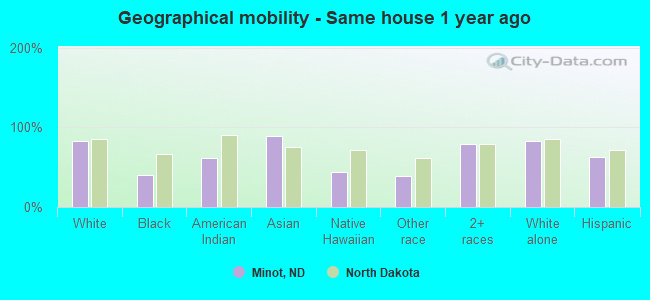
Geographical mobility - Same house 1 year ago (%)
Geographical mobility - Same house 1 year ago (%) - White
Geographical mobility - Same house 1 year ago (%) - Black or African American
Geographical mobility - Same house 1 year ago (%) - Asian
Geographical mobility - Same house 1 year ago (%) - Hispanic or Latino
Geographical mobility - Same house 1 year ago (%) - American Indian and Alaska Native
Geographical mobility - Same house 1 year ago (%) - Multirace
Geographical mobility - Same house 1 year ago (%) - Other Race
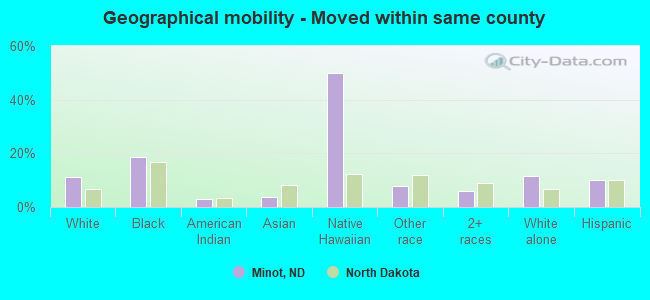
Geographical mobility - Moved within same county (%)
Geographical mobility - Moved within same county (%) - White
Geographical mobility - Moved within same county (%) - Black or African American
Geographical mobility - Moved within same county (%) - Asian
Geographical mobility - Moved within same county (%) - Hispanic or Latino
Geographical mobility - Moved within same county (%) - American Indian and Alaska Native
Geographical mobility - Moved within same county (%) - Multirace
Geographical mobility - Moved within same county (%) - Other Race
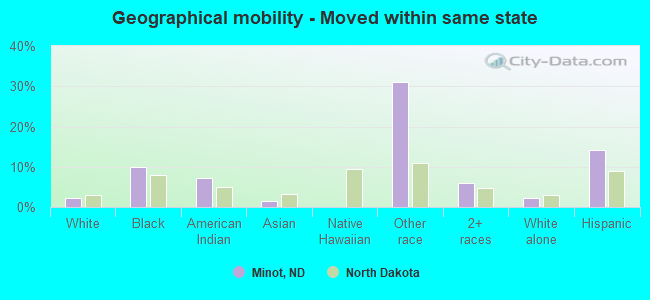
Geographical mobility - Moved from different county within same state (%)
Geographical mobility - Moved from different county within same state (%) - White
Geographical mobility - Moved from different county within same state (%) - Black or African American
Geographical mobility - Moved from different county within same state (%) - Asian
Geographical mobility - Moved from different county within same state (%) - Hispanic or Latino
Geographical mobility - Moved from different county within same state (%) - American Indian and Alaska Native
Geographical mobility - Moved from different county within same state (%) - Multirace
Geographical mobility - Moved from different county within same state (%) - Other Race
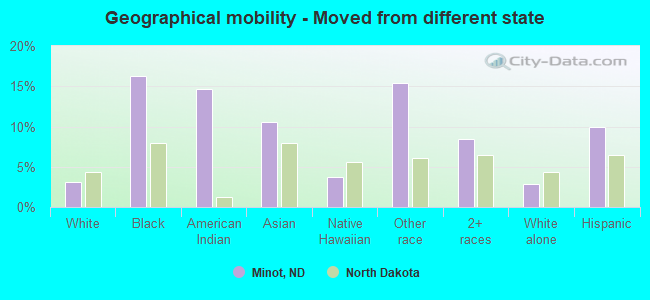
Geographical mobility - Moved from different state (%)
Geographical mobility - Moved from different state (%) - White
Geographical mobility - Moved from different state (%) - Black or African American
Geographical mobility - Moved from different state (%) - Asian
Geographical mobility - Moved from different state (%) - Hispanic or Latino
Geographical mobility - Moved from different state (%) - American Indian and Alaska Native
Geographical mobility - Moved from different state (%) - Multirace
Geographical mobility - Moved from different state (%) - Other Race
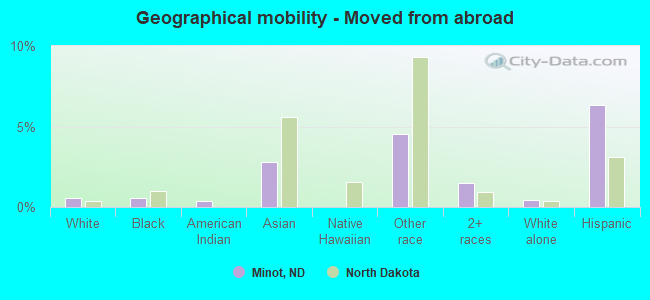
Geographical mobility - Moved from abroad (%)
Geographical mobility - Moved from abroad (%) - White
Geographical mobility - Moved from abroad (%) - Black or African American
Geographical mobility - Moved from abroad (%) - Asian
Geographical mobility - Moved from abroad (%) - Hispanic or Latino
Geographical mobility - Moved from abroad (%) - American Indian and Alaska Native
Geographical mobility - Moved from abroad (%) - Multirace
Geographical mobility - Moved from abroad (%) - Other Race
Place of birth for the foreign-born population - Ireland (%)
Place of birth for the foreign-born population - Denmark (%)
Place of birth for the foreign-born population - Norway (%)
Place of birth for the foreign-born population - Sweden (%)
Place of birth for the foreign-born population - United Kingdom (%)
Place of birth for the foreign-born population - England (%)
Place of birth for the foreign-born population - Scotland (%)
Place of birth for the foreign-born population - Other Northern Europe (%)
Place of birth for the foreign-born population - Austria (%)
Place of birth for the foreign-born population - Belgium (%)
Place of birth for the foreign-born population - France (%)
Place of birth for the foreign-born population - Germany (%)
Place of birth for the foreign-born population - Netherlands (%)
Place of birth for the foreign-born population - Switzerland (%)
Place of birth for the foreign-born population - Other Western Europe (%)
Place of birth for the foreign-born population - Greece (%)
Place of birth for the foreign-born population - Italy (%)
Place of birth for the foreign-born population - Portugal (%)
Place of birth for the foreign-born population - Spain (%)
Place of birth for the foreign-born population - Other Southern Europe (%)
Place of birth for the foreign-born population - Albania (%)
Place of birth for the foreign-born population - Belarus (%)
Place of birth for the foreign-born population - Bosnia and Herzegovina (%)
Place of birth for the foreign-born population - Bulgaria (%)
Place of birth for the foreign-born population - Croatia (%)
Place of birth for the foreign-born population - Czechoslovakia (%)
Place of birth for the foreign-born population - Hungary (%)
Place of birth for the foreign-born population - Latvia (%)
Place of birth for the foreign-born population - Lithuania (%)
Place of birth for the foreign-born population - North Macedonia (Macedonia) (%)
Place of birth for the foreign-born population - Moldova (%)
Place of birth for the foreign-born population - Poland (%)
Place of birth for the foreign-born population - Romania (%)
Place of birth for the foreign-born population - Russia (%)
Place of birth for the foreign-born population - Serbia (%)
Place of birth for the foreign-born population - Ukraine (%)
Place of birth for the foreign-born population - Other Eastern Europe (%)
Place of birth for the foreign-born population - China (%)
Place of birth for the foreign-born population - Hong Kong (%)
Place of birth for the foreign-born population - Taiwan (%)
Place of birth for the foreign-born population - Japan (%)
Place of birth for the foreign-born population - Korea (%)
Place of birth for the foreign-born population - Other Eastern Asia (%)
Place of birth for the foreign-born population - Afghanistan (%)
Place of birth for the foreign-born population - Bangladesh (%)
Place of birth for the foreign-born population - India (%)
Place of birth for the foreign-born population - Iran (%)
Place of birth for the foreign-born population - Kazakhstan (%)
Place of birth for the foreign-born population - Nepal (%)
Place of birth for the foreign-born population - Pakistan (%)
Place of birth for the foreign-born population - Sri Lanka (%)
Place of birth for the foreign-born population - Uzbekistan (%)
Place of birth for the foreign-born population - Other South Central Asia (%)
Place of birth for the foreign-born population - Burma (%)
Place of birth for the foreign-born population - Cambodia (%)
Place of birth for the foreign-born population - Indonesia (%)
Place of birth for the foreign-born population - Laos (%)
Place of birth for the foreign-born population - Malaysia (%)
Place of birth for the foreign-born population - Philippines (%)
Place of birth for the foreign-born population - Singapore (%)
Place of birth for the foreign-born population - Thailand (%)
Place of birth for the foreign-born population - Vietnam (%)
Place of birth for the foreign-born population - Other South Eastern Asia (%)
Place of birth for the foreign-born population - Armenia (%)
Place of birth for the foreign-born population - Iraq (%)
Place of birth for the foreign-born population - Israel (%)
Place of birth for the foreign-born population - Jordan (%)
Place of birth for the foreign-born population - Kuwait (%)
Place of birth for the foreign-born population - Lebanon (%)
Place of birth for the foreign-born population - Saudi Arabia (%)
Place of birth for the foreign-born population - Syria (%)
Place of birth for the foreign-born population - Turkey (%)
Place of birth for the foreign-born population - Yemen (%)
Place of birth for the foreign-born population - Other Western Asia (%)
Place of birth for the foreign-born population - Eritrea (%)
Place of birth for the foreign-born population - Ethiopia (%)
Place of birth for the foreign-born population - Kenya (%)
Place of birth for the foreign-born population - Somalia (%)
Place of birth for the foreign-born population - Uganda (%)
Place of birth for the foreign-born population - Zimbabwe (%)
Place of birth for the foreign-born population - Other Eastern Africa (%)
Place of birth for the foreign-born population - Cameroon (%)
Place of birth for the foreign-born population - Congo (%)
Place of birth for the foreign-born population - Democratic Republic of Congo (Zaire) (%)
Place of birth for the foreign-born population - Other Middle Africa (%)
Place of birth for the foreign-born population - Egypt (%)
Place of birth for the foreign-born population - Morocco (%)
Place of birth for the foreign-born population - Sudan (%)
Place of birth for the foreign-born population - Other Northern Africa (%)
Place of birth for the foreign-born population - South Africa (%)
Place of birth for the foreign-born population - Other Southern Africa (%)
Place of birth for the foreign-born population - Cabo Verde (%)
Place of birth for the foreign-born population - Ghana (%)
Place of birth for the foreign-born population - Liberia (%)
Place of birth for the foreign-born population - Nigeria (%)
Place of birth for the foreign-born population - Senegal (%)
Place of birth for the foreign-born population - Sierra Leone (%)
Place of birth for the foreign-born population - Other Western Africa (%)
Place of birth for the foreign-born population - Australia (%)
Place of birth for the foreign-born population - New Zealand (%)
Place of birth for the foreign-born population - Fiji (%)
Place of birth for the foreign-born population - Micronesia (%)
Place of birth for the foreign-born population - Bahamas (%)
Place of birth for the foreign-born population - Barbados (%)
Place of birth for the foreign-born population - Cuba (%)
Place of birth for the foreign-born population - Dominica (%)
Place of birth for the foreign-born population - Dominican Republic (%)
Place of birth for the foreign-born population - Grenada (%)
Place of birth for the foreign-born population - Haiti (%)
Place of birth for the foreign-born population - Jamaica (%)
Place of birth for the foreign-born population - St. Vincent and the Grenadines (%)
Place of birth for the foreign-born population - Trinidad and Tobago (%)
Place of birth for the foreign-born population - West Indies (%)
Place of birth for the foreign-born population - Other Caribbean (%)
Place of birth for the foreign-born population - Belize (%)
Place of birth for the foreign-born population - Costa Rica (%)
Place of birth for the foreign-born population - El Salvador (%)
Place of birth for the foreign-born population - Guatemala (%)
Place of birth for the foreign-born population - Honduras (%)
Place of birth for the foreign-born population - Mexico (%)
Place of birth for the foreign-born population - Nicaragua (%)
Place of birth for the foreign-born population - Panama (%)
Place of birth for the foreign-born population - Other Central America (%)
Place of birth for the foreign-born population - Argentina (%)
Place of birth for the foreign-born population - Bolivia (%)
Place of birth for the foreign-born population - Brazil (%)
Place of birth for the foreign-born population - Chile (%)
Place of birth for the foreign-born population - Colombia (%)
Place of birth for the foreign-born population - Ecuador (%)
Place of birth for the foreign-born population - Guyana (%)
Place of birth for the foreign-born population - Peru (%)
Place of birth for the foreign-born population - Uruguay (%)
Place of birth for the foreign-born population - Venezuela (%)
Place of birth for the foreign-born population - Other South America (%)
Place of birth for the foreign-born population - Canada (%)
Place of birth for the foreign-born population - Other Northern America (%)
Place of birth for the foreign-born population - Other (%)
Latest news about races in Minot, ND collected exclusively by city-data.com from local newspapers, TV, and radio stations
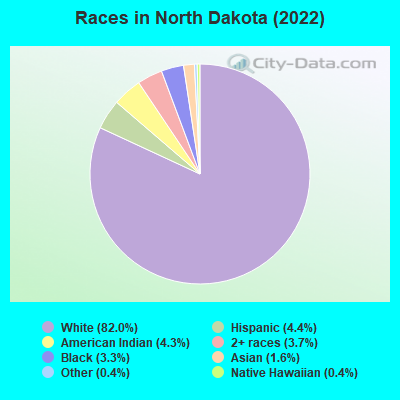
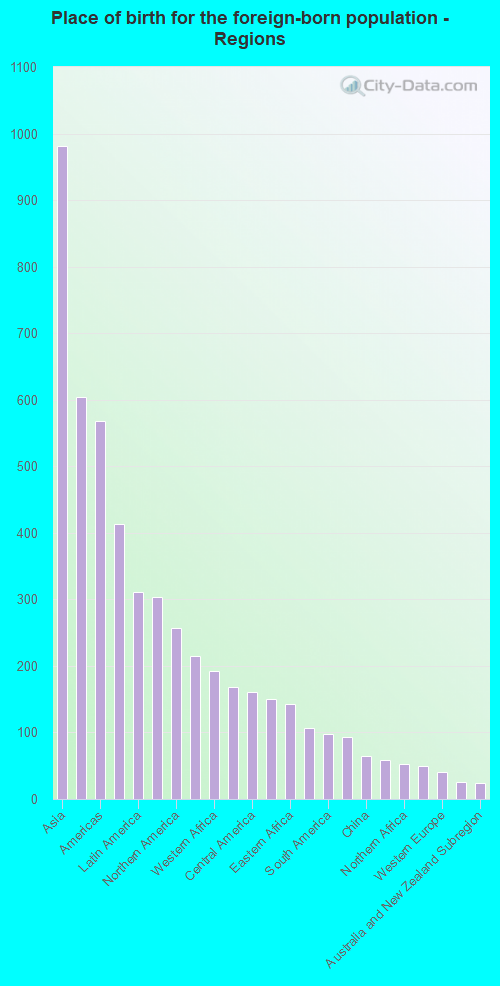
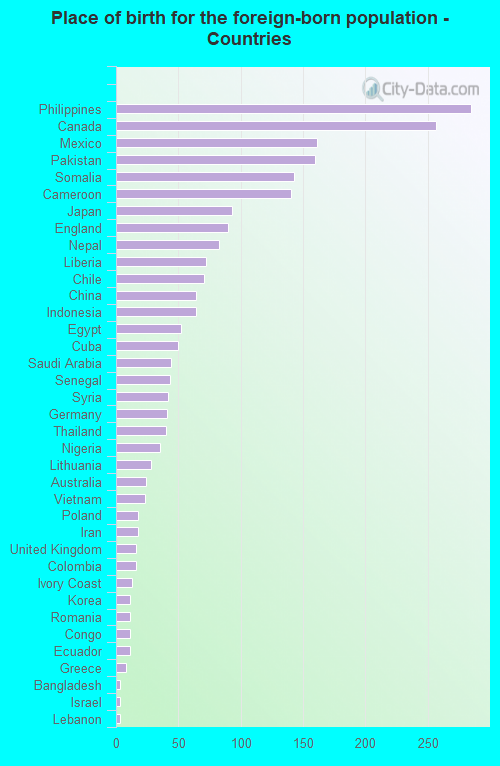
According to 2022 data, the most numerous races in Minot, ND are White alone (37,157 residents), Hispanic (3,683 residents), and American Indian alone (882 residents). 93.1% of Minot residents speak English at home. 5.0% of Minot, ND residents are foreign-born (2.0% born in Asia, 1.2% born in Africa, 0.6% born in Latin America, 0.5% born in North America), which is 20.6% greater than the foreign-born rate of 4.0% across the entire state of North Dakota.
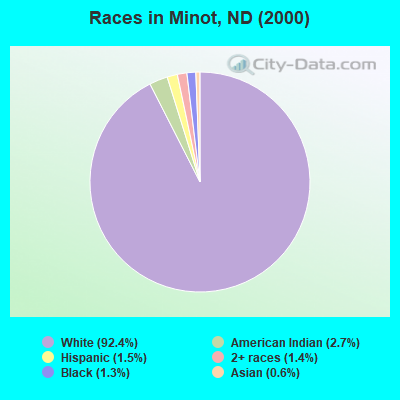
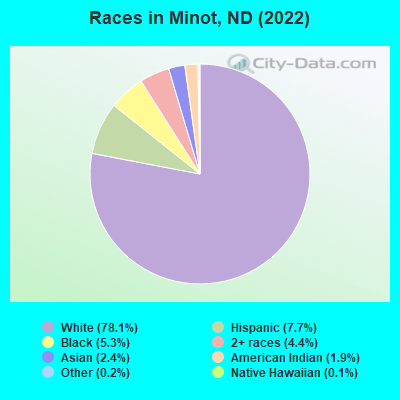
Race distribution in Minot
2000 2022
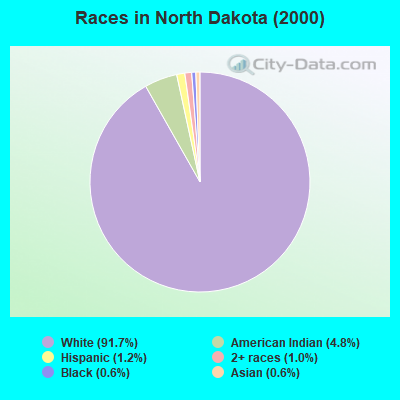
589,149 91.7% White alone 30,772 4.8% American Indian alone 7,786 1.2% Hispanic 6,666 1.0% Two or more races 3,761 0.6% Black alone 3,566 0.6% Asian alone 282 0.04% Other race alone 218 0.03% Native Hawaiian and Other
639,297 82.0% White alone 34,233 4.4% Hispanic 33,252 4.3% American Indian alone 28,831 3.7% Two or more races 25,426 3.3% Black alone 12,271 1.6% Asian alone 3,206 0.4% Other race alone 2,745 0.4% Native Hawaiian and Other
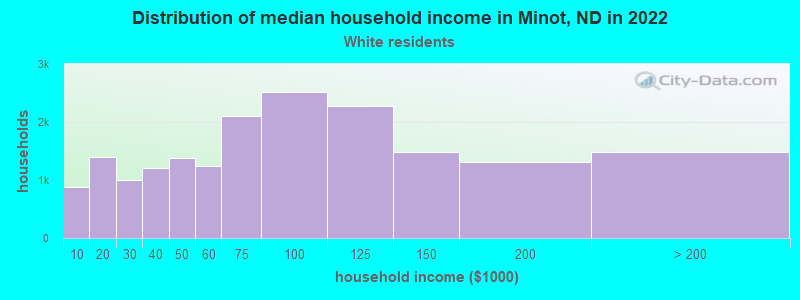
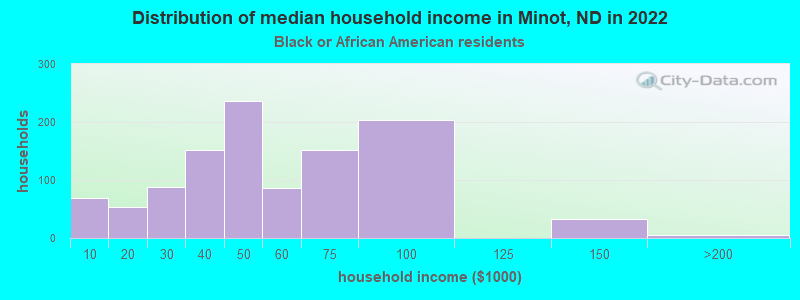
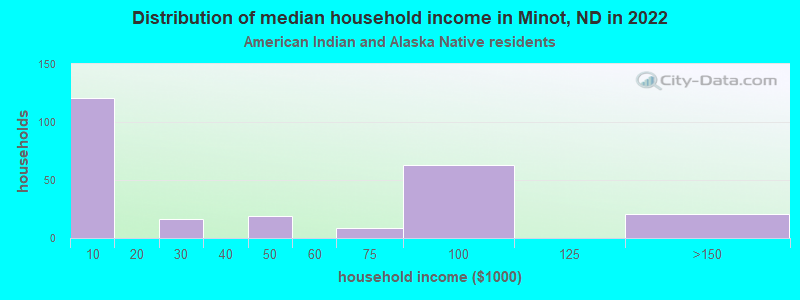
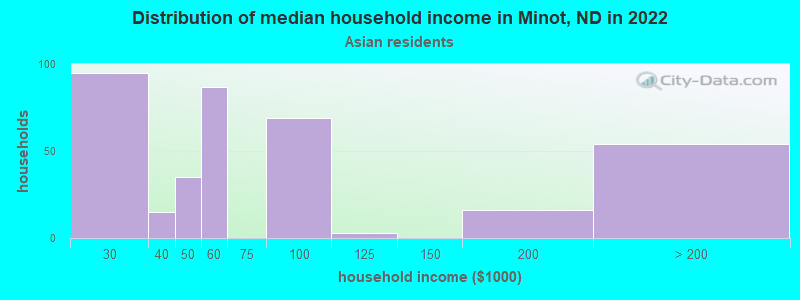
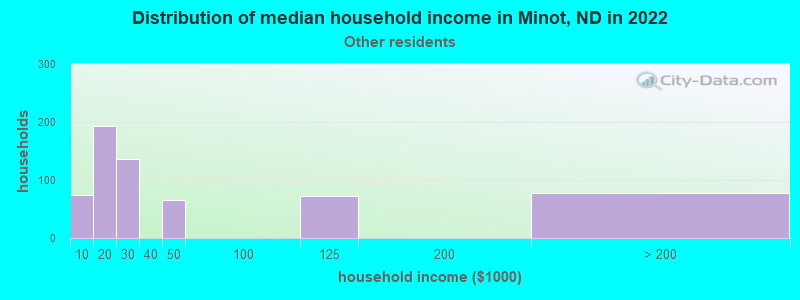
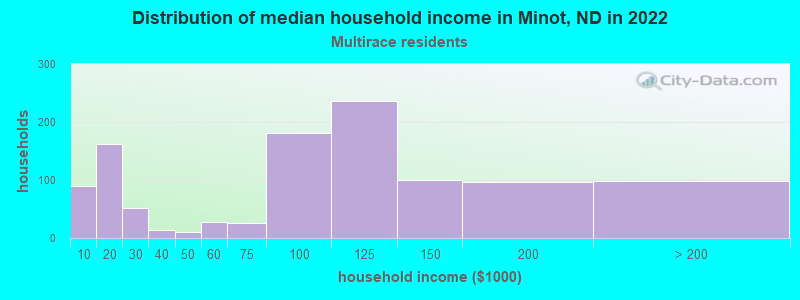
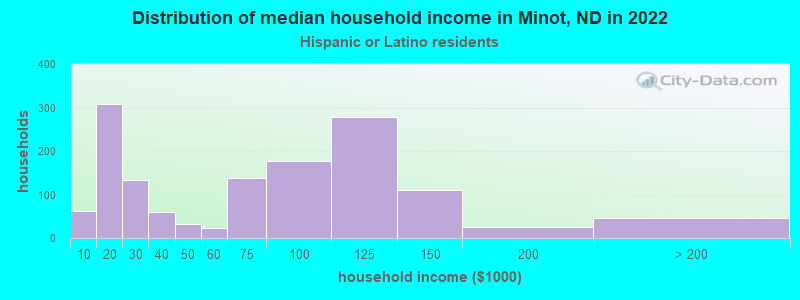
Income and house value in Minot Median household income in 2022 $73,261 White non-Hispanic householders$39,019 Black householders$58,053 Asian householders$27,226 Some other race householders$53,435 Two or more races householders$82,915 Hispanic or Latino race householdersMedian 2022 house value $251,035 White Non-Hispanic householders$471,784 Black or African American householders$341,582 American Indian or Alaska Native householders $224,183 Asian householders$202,951 Native Hawaiian and other Pacific Islander householders$702,524 Some other race householders$154,243 Two or more races householders$211,693 Hispanic or Latino householders
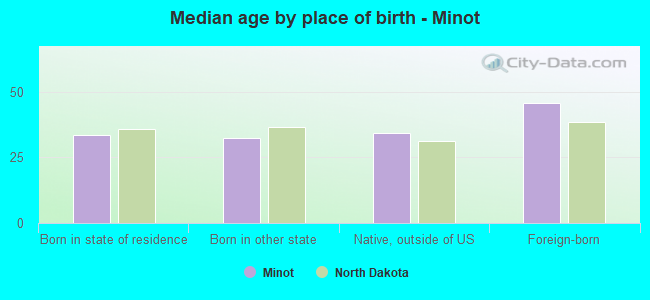
Median age by race in Minot
36.3 Median age for White residents34.7 38.0 27.7 Median age for Black or African American residents26.6 30.4 31.0 Median age for American Indian / Alaska Native residents28.1 31.5 28.6 Median age for Asian residents28.6 28.7 25.1 Median age for Native Hawaiian / Pacific Islander residents19.0 -666,666,666.0 30.9 Median age for Other race residents34.6 30.7 20.7 Median age for Two or more races residents20.9 21.5 37.4 Median age for White alone residents35.9 38.4 24.0 Median age for Hispanic or Latino residents22.5 29.5
Owner/renter occupied households by race in Minot
House owners and renters - White residents 11,659 63.8% Owner occupied6,607 36.2% Renter occupiedHouse owners and renters - Black or African American residents 542 37.5% Owner occupied904 62.5% Renter occupiedHouse owners and renters - American Indian / Alaska Native residents 64 24.4% Owner occupied198 75.6% Renter occupiedHouse owners and renters - Asian residents 67 19.5% Owner occupied278 80.5% Renter occupiedHouse owners and renters - Native Hawaiian / Pacific Islander residents 31 100.0% Renter occupiedHouse owners and renters - Other race residents 176 42.1% Owner occupied242 57.9% Renter occupiedHouse owners and renters - Two or more races residents 629 59.6% Owner occupied426 40.4% Renter occupiedHouse owners and renters - White alone residents 11,623 64.4% Owner occupied6,425 35.6% Renter occupiedHouse owners and renters - Hispanic or Latino residents 1,001 75.5% Owner occupied325 24.5% Renter occupied
Language usage in Minot
English speakers - Total 93.1% of residents of Minot speak English at home.
2.4% of residents speak Spanish at home 706 64.5% Speak English very well389 35.5% Speak English less than very well4.5% of residents speak other language at home 1,498 73.5% Speak English very well539 26.5% Speak English less than very well
English speakers - Born in the United States 95.3% of residents of Minot speak English at home.
2.2% of residents speak Spanish at home 346 94.5% Speak English very well20 5.5% Speak English less than very well2.4% of residents speak other language at home 333 85.4% Speak English very well57 14.6% Speak English less than very well
English speakers - Native, born elsewhere 71.9% of residents of Minot speak English at home.
19.1% of residents speak Spanish at home 140 54.7% Speak English very well116 45.3% Speak English less than very well
English speakers - Foreign-born 36.0% of residents of Minot speak English at home.
7.5% of residents speak Spanish at home 15 7.9% Speak English very well174 92.1% Speak English less than very well56.5% of residents speak other language at home 1,033 72.6% Speak English very well389 27.4% Speak English less than very well
White (Caucasian) - Speak only English Native:
98.4% (34,736)Foreign-born:
81.3% (781)
White (Caucasian) - Speak another language Native:
1.6% (578)Foreign-born:
21.3% (205)
Black or African American - Speak only English Native:
100.0% (1,857)Foreign-born:
24.0% (122)
Black or African American - Speak another language Native:
1.3% (24)Foreign-born:
69.5% (351)
American Indian / Alaska Native - Speak only English Native:
92.4% (803)Foreign-born:
81.2% (4)
Asian - Speak only English Native:
46.0% (56)Foreign-born:
6.6% (58)
Asian - Speak another language Native:
51.7% (63)Foreign-born:
94.9% (835)
Native Hawaiian / Pacific Islander - Speak only English Native:
99.5% (55)Foreign-born:
96.3% (2)
Other race - Speak only English Native:
65.9% (671)Foreign-born:
52.9% (116)
Other race - Speak another language Native:
30.1% (307)Foreign-born:
50.3% (110)
Two or more races - Speak only English Native:
85.0% (2,914)Foreign-born:
78.4% (163)
Two or more races - Speak another language Native:
15.8% (543)Foreign-born:
33.0% (69)
White alone - Speak only English Native:
98.5% (33,911)Foreign-born:
81.3% (774)
White alone - Speak another language Native:
1.5% (506)Foreign-born:
21.1% (201)
Hispanic or Latino - Speak only English Native:
64.0% (1,825)Foreign-born:
44.9% (158)
Hispanic or Latino - Speak another language Native:
35.0% (996)Foreign-born:
46.8% (164)
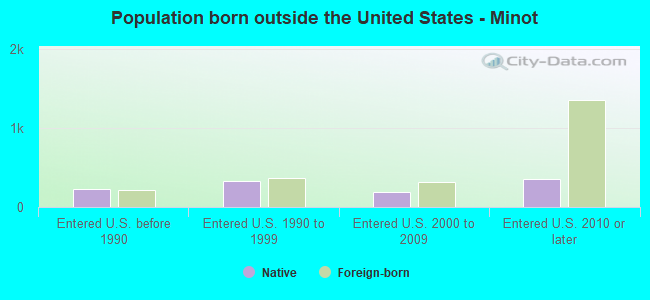
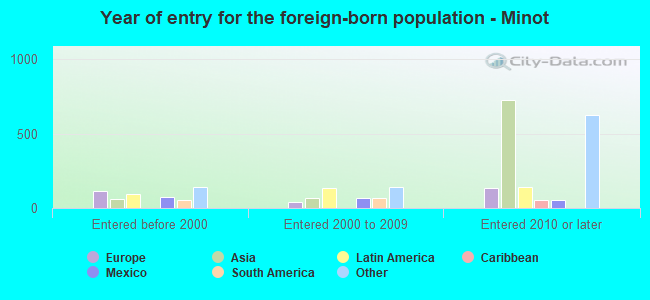
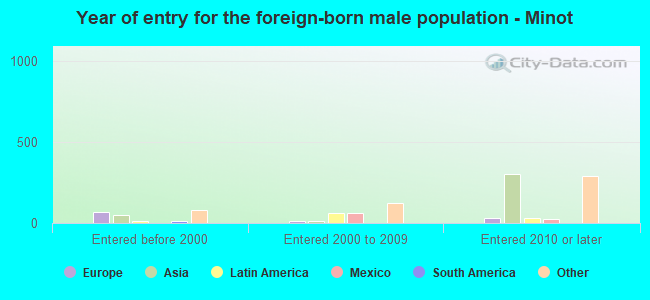
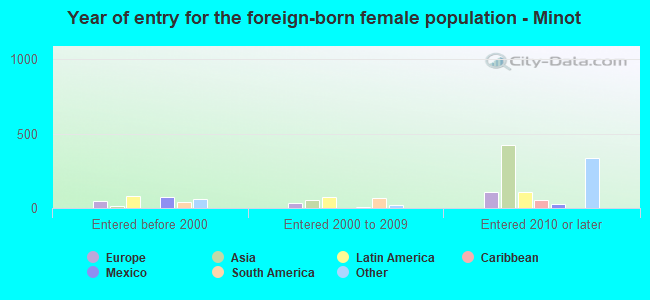
Foreign-born residents in Minot 2,396 residents are foreign born (2.0% Asia , 1.2% Africa , 0.6% Latin America , 0.5% North America ).
This city:
5.0%North Dakota:
4.6%
Marital status for residents in Minot Marital status - White (Caucasian) population 15 years and over
Males 38.1% Never married48.3% Now married1.2% Separated2.5% Widowed9.8% DivorcedFemales 27.7% Never married49.6% Now married1.5% Separated8.3% Widowed13.0% DivorcedWomen who gave birth in the past 12 months Now married:
73.3% (395)Unmarried:
26.7% (144)
Women who did not give birth in the past 12 months Now married:
47.2% (3,948)Unmarried:
52.8% (4,413)
Marital status - Black or African American population 15 years and over
Males 72.6% Never married19.5% Now married0.2% Separated0.0% Widowed7.8% DivorcedFemales 70.8% Never married11.7% Now married0.0% Separated0.0% Widowed17.5% DivorcedWomen who did not give birth in the past 12 months Now married:
13.5% (83)Unmarried:
86.5% (532)
Marital status - American Indian / Alaska Native population 15 years and over
Males 71.7% Never married21.4% Now married0.0% Separated0.0% Widowed6.8% DivorcedFemales 58.9% Never married34.8% Now married0.5% Separated0.0% Widowed5.8% DivorcedWomen who gave birth in the past 12 months Now married:
84.6% (11)Unmarried:
15.4% (2)
Women who did not give birth in the past 12 months Now married:
19.5% (60)Unmarried:
80.5% (249)
Marital status - Asian population 15 years and over
Males 64.4% Never married23.2% Now married12.5% Separated0.0% Widowed0.0% DivorcedFemales 35.0% Never married61.2% Now married0.0% Separated3.8% Widowed0.0% DivorcedWomen who did not give birth in the past 12 months Now married:
61.7% (278)Unmarried:
38.3% (173)
Marital status - Other race population 15 years and over
Males 38.5% Never married57.1% Now married0.0% Separated0.0% Widowed4.4% DivorcedFemales 24.4% Never married40.0% Now married0.0% Separated11.2% Widowed24.4% DivorcedWomen who gave birth in the past 12 months Now married:
100.0% (20)Unmarried:
0.0% (0)
Women who did not give birth in the past 12 months Now married:
42.7% (203)Unmarried:
57.3% (272)
Marital status - Two or more races population 15 years and over
Males 37.5% Never married58.4% Now married0.0% Separated0.0% Widowed4.1% DivorcedFemales 36.6% Never married52.5% Now married1.3% Separated1.4% Widowed8.2% DivorcedWomen who gave birth in the past 12 months Now married:
100.0% (6)Unmarried:
0.0% (0)
Women who did not give birth in the past 12 months Now married:
51.5% (463)Unmarried:
48.5% (436)
Marital status - White alone, not Hispanic / Latino population 15 years and over
Males 37.7% Never married48.5% Now married1.2% Separated2.6% Widowed10.1% DivorcedFemales 27.4% Never married49.6% Now married1.4% Separated8.5% Widowed13.1% DivorcedWomen who gave birth in the past 12 months Now married:
74.5% (404)Unmarried:
25.5% (138)
Women who did not give birth in the past 12 months Now married:
47.1% (3,877)Unmarried:
52.9% (4,347)
Marital status - Hispanic or Latino population 15 years and over
Males 45.7% Never married51.2% Now married0.9% Separated0.0% Widowed2.2% DivorcedFemales 31.3% Never married52.9% Now married0.8% Separated0.0% Widowed15.0% DivorcedWomen who gave birth in the past 12 months Now married:
62.5% (16)Unmarried:
37.5% (10)
Women who did not give birth in the past 12 months Now married:
52.4% (570)Unmarried:
47.6% (519)
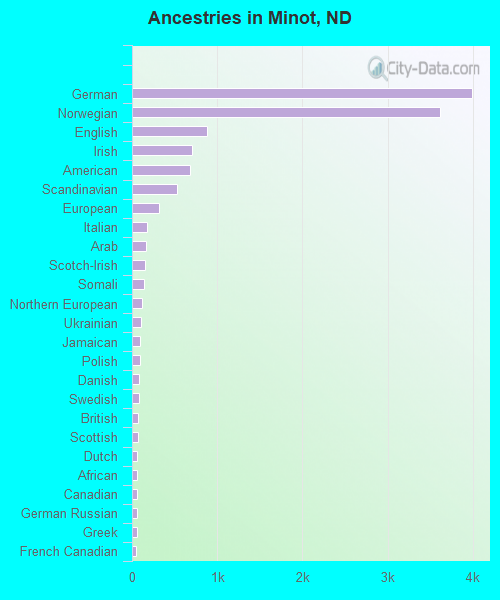
Ancestries in Minot
3,991 22.1% German3,617 20.1% Norwegian877 4.9% English706 3.9% Irish684 3.8% American523 2.9% Scandinavian314 1.7% European173 1.0% Italian167 0.9% Arab147 0.8% Scotch-Irish135 0.7% Somali123 0.7% Northern European111 0.6% Ukrainian94 0.5% Jamaican90 0.5% Polish84 0.5% Danish79 0.4% Swedish69 0.4% British68 0.4% Scottish60 0.3% Dutch58 0.3% African57 0.3% Canadian55 0.3% German Russian55 0.3% Greek47 0.3% French Canadian38 0.2% Lithuanian34 0.2% Russian34 0.2% Liberian30 0.2% Romanian28 0.2% Finnish24 0.1% French22 0.1% Hungarian19 0.1% Nigerian18 0.10% Lebanese18 0.10% Icelander16 0.09% Czech14 0.08% Swiss13 0.07% Belgian11 0.06% Welsh2 0.01% Haitian
Geographical mobility in Minot Same house 1 year ago 31,408 82.9% White (Caucasian)990 40.1% Black or African American507 61.1% American Indian / Alaska Native927 89.3% Asian25 43.9% Native Hawaiian / Pacific Islander536 39.5% Other race3,267 79.7% Two or more races30,655 83.1% White alone, not Hispanic / Latino2,249 62.6% Hispanic or LatinoMoved within same county 4,267 11.3% White / Caucasian459 18.6% Black or African American24 2.9% American Indian / Alaska Native39 3.7% Asian28 50.0% Native Hawaiian / Pacific Islander104 7.7% Other race241 5.9% Two or more races4,213 11.4% White alone, not Hispanic / Latino361 10.1% Hispanic or LatinoMoved within same state 820 2.2% White / Caucasian244 9.9% Black or African American60 7.3% American Indian / Alaska Native14 1.4% Asian423 31.1% Other race248 6.1% Two or more races819 2.2% White alone, not Hispanic / Latino512 14.2% Hispanic or LatinoMoved from different state 1,168 3.1% White / Caucasian402 16.3% Black or African American122 14.7% American Indian / Alaska Native110 10.6% Asian2 3.7% Native Hawaiian / Pacific Islander210 15.4% Other race344 8.4% Two or more races1,053 2.9% White alone, not Hispanic / Latino355 9.9% Hispanic or LatinoMoved from abroad 205 0.5% White13 0.5% Black or African American3 0.4% American Indian / Alaska Native29 2.8% Asian61 4.5% Other race62 1.5% Two or more races167 0.5% White alone, not Hispanic / Latino227 6.3% Hispanic or Latino
Children Nativity (place of birth) in Minot
Children under 6 years - Living with two parents Both parents native 2,350 100.0% NativeBoth parents foreign-born 39 100.0% NativeOne native, one foreign-born parent 65 100.0% NativeChildren under 6 years - Living with one parent Native parent 616 100.0% NativeForeign-born parent 99 100.0% NativeChildren 6 to 17 years - Living with two parents Both parents native 4,331 100.0% NativeBoth parents foreign-born 91 36.0% Native161 64.0% Foreign-bornOne native, one foreign-born parent 100 100.0% NativeChildren 6 to 17 years - Living with one parent Native parent 1,433 100.0% NativeForeign-born parent 64 53.3% Native56 46.7% Foreign-born
Grandparents responsible for own grandchildren in Minot
Grandparents (30 to 59 years) White / Caucasian 116 51.3% Responsible for grandchildren110 48.7% Not responsible for grandchildrenBlack or African American 103 95.4% Responsible for grandchildren5 4.6% Not responsible for grandchildrenWhite alone, not Hispanic / Latino 117 48.2% Responsible for grandchildren125 51.8% Not responsible for grandchildrenHispanic or Latino 7 100.0% Not responsible for grandchildrenGrandparents (60 years and over) White / Caucasian 57 14.4% Responsible for grandchildren337 85.6% Not responsible for grandchildrenBlack or African American 5 100.0% Not responsible for grandchildrenWhite alone, not Hispanic / Latino 57 14.3% Responsible for grandchildren344 85.7% Not responsible for grandchildren