Races in Montgomery, Alabama (AL) Detailed Stats
Data:
Races - White alone (%)
Races - White alone (% change since 2000)
Races - Black alone (%)
Races - Black alone (% change since 2000)
Races - American Indian alone (%)
Races - American Indian alone (% change since 2000)
Races - Asian alone (%)
Races - Asian alone (% change since 2000)
Races - Hispanic (%)
Races - Hispanic (% change since 2000)
Races - Native Hawaiian and Other Pacific Islander alone (%)
Races - Native Hawaiian and Other Pacific Islander alone (% change since 2000)
Races - Two or more races(%)
Races - Two or more races(% change since 2000)
Races - Other race alone (%)
Races - Other race alone (% change since 2000)
Racial diversity
Place of birth - Born in state of residence (%)
Place of birth - Born in state of residence (%) - White
Place of birth - Born in state of residence (%) - Black or African American
Place of birth - Born in state of residence (%) - Asian
Place of birth - Born in state of residence (%) - Hispanic or Latino
Place of birth - Born in state of residence (%) - American Indian and Alaska Native
Place of birth - Born in state of residence (%) - Multirace
Place of birth - Born in state of residence (%) - Other Race
Place of birth - Born in other state (%)
Place of birth - Born in other state (%) - White
Place of birth - Born in other state (%) - Black or African American
Place of birth - Born in other state (%) - Asian
Place of birth - Born in other state (%) - Hispanic or Latino
Place of birth - Born in other state (%) - American Indian and Alaska Native
Place of birth - Born in other state (%) - Multirace
Place of birth - Born in other state (%) - Other Race
Place of birth - Native, outside of US (%)
Place of birth - Native, outside of US (%) - White
Place of birth - Native, outside of US (%) - Black or African American
Place of birth - Native, outside of US (%) - Asian
Place of birth - Native, outside of US (%) - Hispanic or Latino
Place of birth - Native, outside of US (%) - American Indian and Alaska Native
Place of birth - Native, outside of US (%) - Multirace
Place of birth - Native, outside of US (%) - Other Race
Place of birth - Foreign born (%)
Place of birth - Foreign born (%) - White
Place of birth - Foreign born (%) - Black or African American
Place of birth - Foreign born (%) - Asian
Place of birth - Foreign born (%) - Hispanic or Latino
Place of birth - Foreign born (%) - American Indian and Alaska Native
Place of birth - Foreign born (%) - Multirace
Place of birth - Foreign born (%) - Other Race
Residents speaking English at home (%)
Residents speaking English at home - Born in the United States (%)
Residents speaking English at home - Native, born elsewhere (%)
Residents speaking English at home - Foreign born (%)
Residents speaking Spanish at home (%)
Residents speaking Spanish at home - Born in the United States (%)
Residents speaking Spanish at home - Native, born elsewhere (%)
Residents speaking Spanish at home - Foreign born (%)
Residents speaking other language at home (%)
Residents speaking other language at home - Born in the United States (%)
Residents speaking other language at home - Native, born elsewhere (%)
Residents speaking other language at home - Foreign born (%)
Marital status - Never married (%)
Marital status - Now married (%)
Marital status - Separated (%)
Marital status - Widowed (%)
Marital status - Divorced (%)
Ancestries Reported - Arab (%)
Ancestries Reported - Czech (%)
Ancestries Reported - Danish (%)
Ancestries Reported - Dutch (%)
Ancestries Reported - English (%)
Ancestries Reported - French (%)
Ancestries Reported - French Canadian (%)
Ancestries Reported - German (%)
Ancestries Reported - Greek (%)
Ancestries Reported - Hungarian (%)
Ancestries Reported - Irish (%)
Ancestries Reported - Italian (%)
Ancestries Reported - Lithuanian (%)
Ancestries Reported - Norwegian (%)
Ancestries Reported - Polish (%)
Ancestries Reported - Portuguese (%)
Ancestries Reported - Russian (%)
Ancestries Reported - Scotch-Irish (%)
Ancestries Reported - Scottish (%)
Ancestries Reported - Slovak (%)
Ancestries Reported - Subsaharan African (%)
Ancestries Reported - Swedish (%)
Ancestries Reported - Swiss (%)
Ancestries Reported - Ukrainian (%)
Ancestries Reported - United States (%)
Ancestries Reported - Welsh (%)
Ancestries Reported - West Indian (%)
Ancestries Reported - Other (%)
Geographical mobility - Same house 1 year ago (%)
Geographical mobility - Same house 1 year ago (%) - White
Geographical mobility - Same house 1 year ago (%) - Black or African American
Geographical mobility - Same house 1 year ago (%) - Asian
Geographical mobility - Same house 1 year ago (%) - Hispanic or Latino
Geographical mobility - Same house 1 year ago (%) - American Indian and Alaska Native
Geographical mobility - Same house 1 year ago (%) - Multirace
Geographical mobility - Same house 1 year ago (%) - Other Race
Geographical mobility - Moved within same county (%)
Geographical mobility - Moved within same county (%) - White
Geographical mobility - Moved within same county (%) - Black or African American
Geographical mobility - Moved within same county (%) - Asian
Geographical mobility - Moved within same county (%) - Hispanic or Latino
Geographical mobility - Moved within same county (%) - American Indian and Alaska Native
Geographical mobility - Moved within same county (%) - Multirace
Geographical mobility - Moved within same county (%) - Other Race
Geographical mobility - Moved from different county within same state (%)
Geographical mobility - Moved from different county within same state (%) - White
Geographical mobility - Moved from different county within same state (%) - Black or African American
Geographical mobility - Moved from different county within same state (%) - Asian
Geographical mobility - Moved from different county within same state (%) - Hispanic or Latino
Geographical mobility - Moved from different county within same state (%) - American Indian and Alaska Native
Geographical mobility - Moved from different county within same state (%) - Multirace
Geographical mobility - Moved from different county within same state (%) - Other Race
Geographical mobility - Moved from different state (%)
Geographical mobility - Moved from different state (%) - White
Geographical mobility - Moved from different state (%) - Black or African American
Geographical mobility - Moved from different state (%) - Asian
Geographical mobility - Moved from different state (%) - Hispanic or Latino
Geographical mobility - Moved from different state (%) - American Indian and Alaska Native
Geographical mobility - Moved from different state (%) - Multirace
Geographical mobility - Moved from different state (%) - Other Race
Geographical mobility - Moved from abroad (%)
Geographical mobility - Moved from abroad (%) - White
Geographical mobility - Moved from abroad (%) - Black or African American
Geographical mobility - Moved from abroad (%) - Asian
Geographical mobility - Moved from abroad (%) - Hispanic or Latino
Geographical mobility - Moved from abroad (%) - American Indian and Alaska Native
Geographical mobility - Moved from abroad (%) - Multirace
Geographical mobility - Moved from abroad (%) - Other Race
Place of birth for the foreign-born population - Ireland (%)
Place of birth for the foreign-born population - Denmark (%)
Place of birth for the foreign-born population - Norway (%)
Place of birth for the foreign-born population - Sweden (%)
Place of birth for the foreign-born population - United Kingdom (%)
Place of birth for the foreign-born population - England (%)
Place of birth for the foreign-born population - Scotland (%)
Place of birth for the foreign-born population - Other Northern Europe (%)
Place of birth for the foreign-born population - Austria (%)
Place of birth for the foreign-born population - Belgium (%)
Place of birth for the foreign-born population - France (%)
Place of birth for the foreign-born population - Germany (%)
Place of birth for the foreign-born population - Netherlands (%)
Place of birth for the foreign-born population - Switzerland (%)
Place of birth for the foreign-born population - Other Western Europe (%)
Place of birth for the foreign-born population - Greece (%)
Place of birth for the foreign-born population - Italy (%)
Place of birth for the foreign-born population - Portugal (%)
Place of birth for the foreign-born population - Spain (%)
Place of birth for the foreign-born population - Other Southern Europe (%)
Place of birth for the foreign-born population - Albania (%)
Place of birth for the foreign-born population - Belarus (%)
Place of birth for the foreign-born population - Bosnia and Herzegovina (%)
Place of birth for the foreign-born population - Bulgaria (%)
Place of birth for the foreign-born population - Croatia (%)
Place of birth for the foreign-born population - Czechoslovakia (%)
Place of birth for the foreign-born population - Hungary (%)
Place of birth for the foreign-born population - Latvia (%)
Place of birth for the foreign-born population - Lithuania (%)
Place of birth for the foreign-born population - North Macedonia (Macedonia) (%)
Place of birth for the foreign-born population - Moldova (%)
Place of birth for the foreign-born population - Poland (%)
Place of birth for the foreign-born population - Romania (%)
Place of birth for the foreign-born population - Russia (%)
Place of birth for the foreign-born population - Serbia (%)
Place of birth for the foreign-born population - Ukraine (%)
Place of birth for the foreign-born population - Other Eastern Europe (%)
Place of birth for the foreign-born population - China (%)
Place of birth for the foreign-born population - Hong Kong (%)
Place of birth for the foreign-born population - Taiwan (%)
Place of birth for the foreign-born population - Japan (%)
Place of birth for the foreign-born population - Korea (%)
Place of birth for the foreign-born population - Other Eastern Asia (%)
Place of birth for the foreign-born population - Afghanistan (%)
Place of birth for the foreign-born population - Bangladesh (%)
Place of birth for the foreign-born population - India (%)
Place of birth for the foreign-born population - Iran (%)
Place of birth for the foreign-born population - Kazakhstan (%)
Place of birth for the foreign-born population - Nepal (%)
Place of birth for the foreign-born population - Pakistan (%)
Place of birth for the foreign-born population - Sri Lanka (%)
Place of birth for the foreign-born population - Uzbekistan (%)
Place of birth for the foreign-born population - Other South Central Asia (%)
Place of birth for the foreign-born population - Burma (%)
Place of birth for the foreign-born population - Cambodia (%)
Place of birth for the foreign-born population - Indonesia (%)
Place of birth for the foreign-born population - Laos (%)
Place of birth for the foreign-born population - Malaysia (%)
Place of birth for the foreign-born population - Philippines (%)
Place of birth for the foreign-born population - Singapore (%)
Place of birth for the foreign-born population - Thailand (%)
Place of birth for the foreign-born population - Vietnam (%)
Place of birth for the foreign-born population - Other South Eastern Asia (%)
Place of birth for the foreign-born population - Armenia (%)
Place of birth for the foreign-born population - Iraq (%)
Place of birth for the foreign-born population - Israel (%)
Place of birth for the foreign-born population - Jordan (%)
Place of birth for the foreign-born population - Kuwait (%)
Place of birth for the foreign-born population - Lebanon (%)
Place of birth for the foreign-born population - Saudi Arabia (%)
Place of birth for the foreign-born population - Syria (%)
Place of birth for the foreign-born population - Turkey (%)
Place of birth for the foreign-born population - Yemen (%)
Place of birth for the foreign-born population - Other Western Asia (%)
Place of birth for the foreign-born population - Eritrea (%)
Place of birth for the foreign-born population - Ethiopia (%)
Place of birth for the foreign-born population - Kenya (%)
Place of birth for the foreign-born population - Somalia (%)
Place of birth for the foreign-born population - Uganda (%)
Place of birth for the foreign-born population - Zimbabwe (%)
Place of birth for the foreign-born population - Other Eastern Africa (%)
Place of birth for the foreign-born population - Cameroon (%)
Place of birth for the foreign-born population - Congo (%)
Place of birth for the foreign-born population - Democratic Republic of Congo (Zaire) (%)
Place of birth for the foreign-born population - Other Middle Africa (%)
Place of birth for the foreign-born population - Egypt (%)
Place of birth for the foreign-born population - Morocco (%)
Place of birth for the foreign-born population - Sudan (%)
Place of birth for the foreign-born population - Other Northern Africa (%)
Place of birth for the foreign-born population - South Africa (%)
Place of birth for the foreign-born population - Other Southern Africa (%)
Place of birth for the foreign-born population - Cabo Verde (%)
Place of birth for the foreign-born population - Ghana (%)
Place of birth for the foreign-born population - Liberia (%)
Place of birth for the foreign-born population - Nigeria (%)
Place of birth for the foreign-born population - Senegal (%)
Place of birth for the foreign-born population - Sierra Leone (%)
Place of birth for the foreign-born population - Other Western Africa (%)
Place of birth for the foreign-born population - Australia (%)
Place of birth for the foreign-born population - New Zealand (%)
Place of birth for the foreign-born population - Fiji (%)
Place of birth for the foreign-born population - Micronesia (%)
Place of birth for the foreign-born population - Bahamas (%)
Place of birth for the foreign-born population - Barbados (%)
Place of birth for the foreign-born population - Cuba (%)
Place of birth for the foreign-born population - Dominica (%)
Place of birth for the foreign-born population - Dominican Republic (%)
Place of birth for the foreign-born population - Grenada (%)
Place of birth for the foreign-born population - Haiti (%)
Place of birth for the foreign-born population - Jamaica (%)
Place of birth for the foreign-born population - St. Vincent and the Grenadines (%)
Place of birth for the foreign-born population - Trinidad and Tobago (%)
Place of birth for the foreign-born population - West Indies (%)
Place of birth for the foreign-born population - Other Caribbean (%)
Place of birth for the foreign-born population - Belize (%)
Place of birth for the foreign-born population - Costa Rica (%)
Place of birth for the foreign-born population - El Salvador (%)
Place of birth for the foreign-born population - Guatemala (%)
Place of birth for the foreign-born population - Honduras (%)
Place of birth for the foreign-born population - Mexico (%)
Place of birth for the foreign-born population - Nicaragua (%)
Place of birth for the foreign-born population - Panama (%)
Place of birth for the foreign-born population - Other Central America (%)
Place of birth for the foreign-born population - Argentina (%)
Place of birth for the foreign-born population - Bolivia (%)
Place of birth for the foreign-born population - Brazil (%)
Place of birth for the foreign-born population - Chile (%)
Place of birth for the foreign-born population - Colombia (%)
Place of birth for the foreign-born population - Ecuador (%)
Place of birth for the foreign-born population - Guyana (%)
Place of birth for the foreign-born population - Peru (%)
Place of birth for the foreign-born population - Uruguay (%)
Place of birth for the foreign-born population - Venezuela (%)
Place of birth for the foreign-born population - Other South America (%)
Place of birth for the foreign-born population - Canada (%)
Place of birth for the foreign-born population - Other Northern America (%)
Place of birth for the foreign-born population - Other (%)
Latest news about races in Montgomery, AL collected exclusively by city-data.com from local newspapers, TV, and radio stations
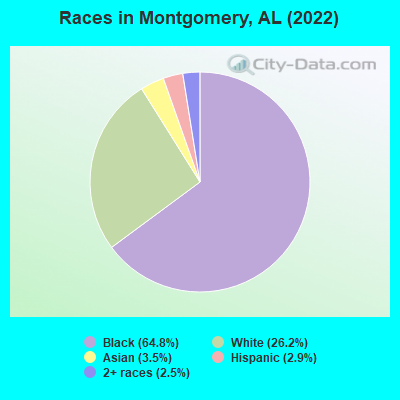
According to 2022 data, the most numerous races in Montgomery, AL are White alone (62,309 residents), Black alone (125,780 residents), and Hispanic (8,666 residents). 93.5% of Montgomery residents speak English at home. 4.8% of Montgomery, AL residents are foreign-born (2.4% born in Asia, 1.5% born in Latin America), which is 37.1% greater than the foreign-born rate of 3.0% across the entire state of Alabama.
Race distribution in Montgomery
2000 2022
99,631 49.4% Black alone 94,868 47.1% White alone 2,484 1.2% Hispanic 2,120 1.1% Asian alone 1,758 0.9% Two or more races 468 0.2% American Indian alone 173 0.09% Other race alone 66 0.03% Native Hawaiian and Other
125,780 60.7% Black alone 62,309 30.1% White alone 8,666 4.2% Hispanic 6,135 3.0% Asian alone 5,395 2.6% Two or more races 496 0.2% Other race alone 138 0.07% American Indian alone 11 0.01% Native Hawaiian and Other
2000 2022
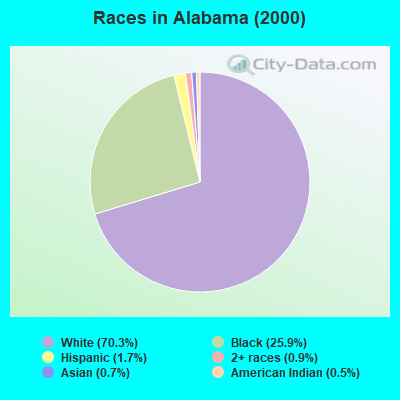
3,125,819 70.3% White alone 1,150,076 25.9% Black alone 75,830 1.7% Hispanic 39,086 0.9% Two or more races 30,989 0.7% Asian alone 21,618 0.5% American Indian alone 2,623 0.06% Other race alone 1,059 0.02% Native Hawaiian and Other
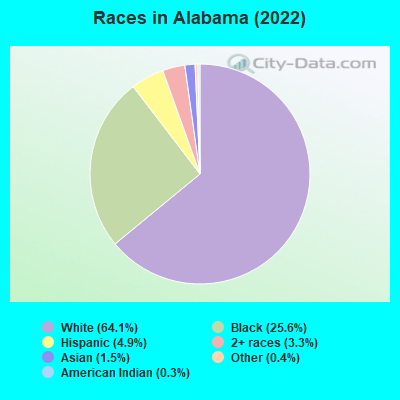
3,250,182 64.1% White alone 1,296,500 25.6% Black alone 246,477 4.9% Hispanic 169,880 3.3% Two or more races 76,682 1.5% Asian alone 19,927 0.4% Other race alone 12,694 0.3% American Indian alone 1,954 0.04% Native Hawaiian and Other
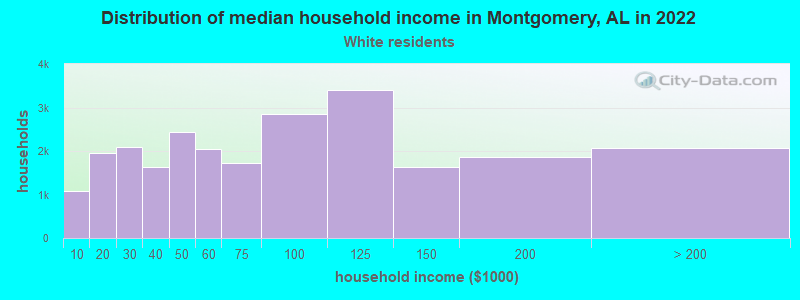
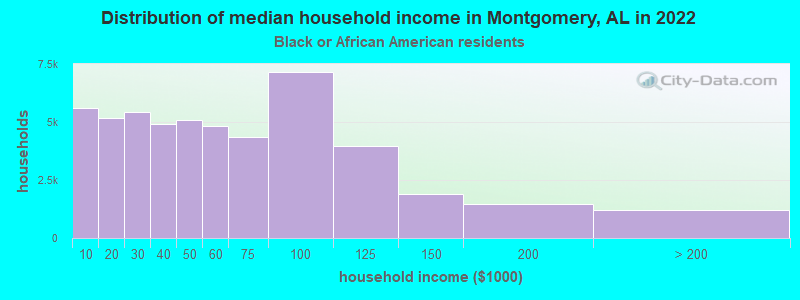
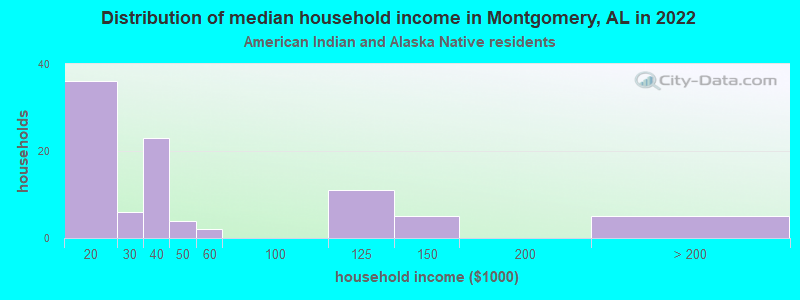
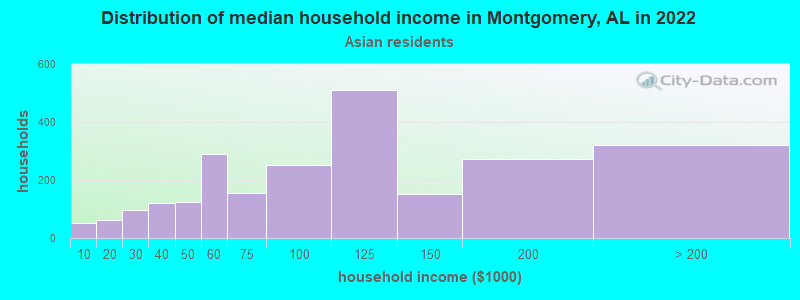
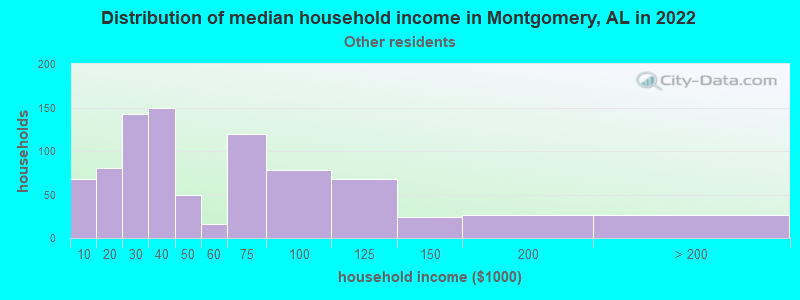
Income and house value in Montgomery Median household income in 2022 $78,388 White non-Hispanic householders$52,173 Black householders$39,370 American Indian and Alaska Native householders$115,389 Asian householders$1,610 Native Hawaiian and other Pacific Islander householders$40,844 Some other race householders$105,177 Two or more races householders$98,971 Hispanic or Latino race householdersMedian 2022 house value $267,168 White Non-Hispanic householders$166,325 Black or African American householders$244,904 American Indian or Alaska Native householders $261,929 Asian householders$425,635 Native Hawaiian and other Pacific Islander householders$232,593 Some other race householders$232,855 Two or more races householders$261,667 Hispanic or Latino householders
Median age by race in Montgomery
45.4 Median age for White residents41.6 47.7 33.8 Median age for Black or African American residents31.5 35.7 43.4 Median age for American Indian / Alaska Native residents43.0 37.4 39.8 Median age for Asian residents38.9 41.8 25.2 Median age for Native Hawaiian / Pacific Islander residents16.1 Median age for Other race residents17.2 15.0 21.1 Median age for Two or more races residents19.2 22.7 46.9 Median age for White alone residents44.9 48.7 18.1 Median age for Hispanic or Latino residents14.6 22.4
Owner/renter occupied households by race in Montgomery
House owners and renters - White residents 19,625 73.1% Owner occupied7,222 26.9% Renter occupiedHouse owners and renters - Black or African American residents 21,936 44.5% Owner occupied27,310 55.5% Renter occupiedHouse owners and renters - American Indian / Alaska Native residents 64 59.0% Owner occupied44 41.0% Renter occupiedHouse owners and renters - Asian residents 1,684 68.3% Owner occupied781 31.7% Renter occupiedHouse owners and renters - Native Hawaiian / Pacific Islander residents 4 100.0% Renter occupiedHouse owners and renters - Other race residents 1,123 77.5% Owner occupied325 22.5% Renter occupiedHouse owners and renters - Two or more races residents 253 21.4% Owner occupied930 78.6% Renter occupiedHouse owners and renters - White alone residents 19,209 73.4% Owner occupied6,968 26.6% Renter occupiedHouse owners and renters - Hispanic or Latino residents 1,255 60.5% Owner occupied819 39.5% Renter occupied
Language usage in Montgomery
English speakers - Total 93.5% of residents of Montgomery speak English at home.
2.9% of residents speak Spanish at home 2,800 50.8% Speak English very well2,710 49.2% Speak English less than very well3.7% of residents speak other language at home 3,780 53.8% Speak English very well3,250 46.2% Speak English less than very well
English speakers - Born in the United States 97.1% of residents of Montgomery speak English at home.
1.9% of residents speak Spanish at home 814 93.9% Speak English very well53 6.1% Speak English less than very well1.0% of residents speak other language at home 386 82.3% Speak English very well83 17.7% Speak English less than very well
English speakers - Native, born elsewhere 86.3% of residents of Montgomery speak English at home.
7.1% of residents speak Spanish at home 115 72.8% Speak English very well43 27.2% Speak English less than very well7.9% of residents speak other language at home 169 96.6% Speak English very well6 3.4% Speak English less than very well
English speakers - Foreign-born 16.4% of residents of Montgomery speak English at home.
26.1% of residents speak Spanish at home 581 22.3% Speak English very well2,025 77.7% Speak English less than very well57.8% of residents speak other language at home 2,617 45.4% Speak English very well3,150 54.6% Speak English less than very well
White (Caucasian) - Speak only English Native:
97.9% (58,558)Foreign-born:
41.1% (344)
White (Caucasian) - Speak another language Native:
2.0% (1,204)Foreign-born:
61.2% (512)
Black or African American - Speak only English Native:
99.3% (115,975)Foreign-born:
53.6% (502)
Black or African American - Speak another language Native:
0.6% (661)Foreign-born:
46.0% (432)
American Indian / Alaska Native - Speak only English Native:
72.1% (125)Foreign-born:
12.1% (17)
American Indian / Alaska Native - Speak another language Native:
53.9% (93)Foreign-born:
86.7% (124)
Asian - Speak only English Native:
22.8% (311)Foreign-born:
2.1% (120)
Asian - Speak another language Native:
67.8% (927)Foreign-born:
98.9% (5,562)
Other race - Speak only English Native:
57.1% (1,715)Foreign-born:
16.3% (183)
Other race - Speak another language Native:
48.4% (1,456)Foreign-born:
84.8% (950)
Two or more races - Speak only English Native:
81.1% (4,077)Foreign-born:
9.0% (192)
Two or more races - Speak another language Native:
28.5% (1,433)Foreign-born:
100.0% (2,143)
White alone - Speak only English Native:
98.9% (58,111)Foreign-born:
43.3% (505)
White alone - Speak another language Native:
1.1% (629)Foreign-born:
56.8% (662)
Hispanic or Latino - Speak only English Native:
63.8% (4,326)Foreign-born:
12.6% (232)
Hispanic or Latino - Speak another language Native:
38.6% (2,614)Foreign-born:
87.8% (1,608)
Foreign-born residents in Montgomery 9,810 residents are foreign born (2.4% Asia , 1.5% Latin America ).
This city:
4.8%Alabama:
100.0%
Marital status for residents in Montgomery Marital status - White (Caucasian) population 15 years and over
Males 31.5% Never married52.8% Now married1.7% Separated2.3% Widowed11.7% DivorcedFemales 21.3% Never married49.7% Now married1.9% Separated8.7% Widowed18.5% DivorcedWomen who gave birth in the past 12 months Now married:
32.4% (129)Unmarried:
67.6% (269)
Women who did not give birth in the past 12 months Now married:
50.7% (6,246)Unmarried:
49.3% (6,071)
Marital status - Black or African American population 15 years and over
Males 56.3% Never married28.4% Now married4.3% Separated2.0% Widowed8.9% DivorcedFemales 48.7% Never married23.2% Now married3.7% Separated6.4% Widowed18.0% DivorcedWomen who gave birth in the past 12 months Now married:
27.8% (393)Unmarried:
72.2% (1,022)
Women who did not give birth in the past 12 months Now married:
20.5% (6,634)Unmarried:
79.5% (25,766)
Marital status - American Indian / Alaska Native population 15 years and over
Males 33.9% Never married39.0% Now married0.0% Separated0.0% Widowed27.1% DivorcedFemales 31.0% Never married45.2% Now married0.0% Separated4.2% Widowed19.6% DivorcedWomen who did not give birth in the past 12 months Now married:
55.4% (39)Unmarried:
44.6% (31)
Marital status - Asian population 15 years and over
Males 33.5% Never married58.4% Now married0.0% Separated3.0% Widowed5.1% DivorcedFemales 16.8% Never married71.8% Now married1.7% Separated5.9% Widowed3.8% DivorcedWomen who gave birth in the past 12 months Now married:
100.0% (117)Unmarried:
0.0% (0)
Women who did not give birth in the past 12 months Now married:
81.5% (1,543)Unmarried:
18.5% (349)
Marital status - Native Hawaiian / Pacific Islander population 15 years and over
Males 0.0% Never married100.0% Now married0.0% Separated0.0% Widowed0.0% DivorcedFemales 0.0% Never married100.0% Now married0.0% Separated0.0% Widowed0.0% DivorcedWomen who did not give birth in the past 12 months Now married:
100.0% (4)Unmarried:
0.0% (0)
Marital status - Other race population 15 years and over
Males 55.0% Never married34.4% Now married4.3% Separated0.0% Widowed6.3% DivorcedFemales 50.2% Never married30.3% Now married0.3% Separated6.9% Widowed12.3% DivorcedWomen who gave birth in the past 12 months Now married:
68.3% (38)Unmarried:
31.7% (17)
Women who did not give birth in the past 12 months Now married:
30.7% (215)Unmarried:
69.3% (485)
Marital status - Two or more races population 15 years and over
Males 41.4% Never married46.5% Now married0.0% Separated1.6% Widowed10.5% DivorcedFemales 42.6% Never married34.0% Now married1.1% Separated2.5% Widowed19.9% DivorcedWomen who gave birth in the past 12 months Now married:
40.3% (59)Unmarried:
59.7% (87)
Women who did not give birth in the past 12 months Now married:
34.7% (539)Unmarried:
65.3% (1,013)
Marital status - White alone, not Hispanic / Latino population 15 years and over
Males 30.0% Never married54.2% Now married1.8% Separated2.5% Widowed11.5% DivorcedFemales 20.5% Never married49.0% Now married2.0% Separated9.1% Widowed19.5% DivorcedWomen who gave birth in the past 12 months Now married:
33.2% (131)Unmarried:
66.8% (263)
Women who did not give birth in the past 12 months Now married:
50.1% (5,680)Unmarried:
49.9% (5,660)
Marital status - Hispanic or Latino population 15 years and over
Males 48.0% Never married39.7% Now married4.2% Separated0.4% Widowed7.8% DivorcedFemales 45.1% Never married42.7% Now married1.1% Separated2.8% Widowed8.3% DivorcedWomen who gave birth in the past 12 months Now married:
61.4% (53)Unmarried:
38.6% (33)
Women who did not give birth in the past 12 months Now married:
37.8% (678)Unmarried:
62.2% (1,115)
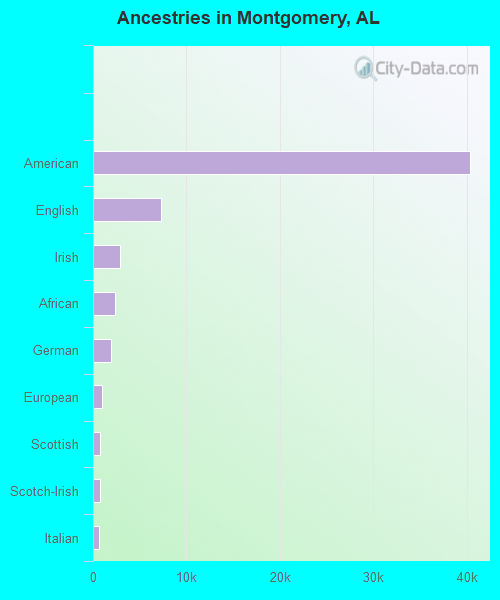
Ancestries in Montgomery
45,725 31.3% American7,034 4.8% English2,611 1.8% Irish2,212 1.5% African1,940 1.3% European1,836 1.3% German795 0.5% Scottish763 0.5% Scotch-Irish449 0.3% British428 0.3% Italian264 0.2% French232 0.2% Norwegian232 0.2% Jamaican209 0.1% Northern European208 0.1% Nigerian191 0.1% Lebanese166 0.1% Romanian148 0.1% Welsh146 0.1% Polish144 0.10% Haitian125 0.09% Scandinavian120 0.08% Danish106 0.07% Ukrainian101 0.07% Greek90 0.06% Swedish86 0.06% Liberian83 0.06% Dutch77 0.05% French Canadian77 0.05% Ethiopian68 0.05% Russian66 0.05% Moroccan59 0.04% Swiss48 0.03% Arab45 0.03% Czech44 0.03% Turkish44 0.03% Yugoslavian42 0.03% Eastern European40 0.03% Trinidadian and Tobagonian35 0.02% Canadian34 0.02% Slovak32 0.02% Hungarian31 0.02% Ghanaian30 0.02% Celtic28 0.02% Portuguese20 0.01% Armenian19 0.01% Serbian16 0.01% West Indian15 0.01% Brazilian14 0.01% Austrian8 0.01% Finnish
Geographical mobility in Montgomery Same house 1 year ago 52,492 83.4% White (Caucasian)93,613 76.7% Black or African American205 68.4% American Indian / Alaska Native4,695 64.3% Asian3,470 86.1% Other race5,952 78.8% Two or more races53,126 85.7% White alone, not Hispanic / Latino6,291 77.6% Hispanic or LatinoMoved within same county 4,277 6.8% White / Caucasian18,067 14.8% Black or African American37 12.4% American Indian / Alaska Native1,180 16.2% Asian290 7.2% Other race776 10.3% Two or more races3,525 5.7% White alone, not Hispanic / Latino866 10.7% Hispanic or LatinoMoved within same state 1,730 2.7% White / Caucasian3,925 3.2% Black or African American26 8.8% American Indian / Alaska Native36 0.9% Other race315 4.2% Two or more races2,151 3.5% White alone, not Hispanic / Latino280 3.5% Hispanic or LatinoMoved from different state 3,408 5.4% White / Caucasian4,389 3.6% Black or African American5 1.8% American Indian / Alaska Native419 5.7% Asian2 11.8% Native Hawaiian / Pacific Islander152 3.8% Other race244 3.2% Two or more races2,755 4.4% White alone, not Hispanic / Latino583 7.2% Hispanic or LatinoMoved from abroad 1,020 1.6% White271 0.2% Black or African American51 16.8% American Indian / Alaska Native784 10.7% Asian46 1.1% Other race215 2.9% Two or more races497 0.8% White alone, not Hispanic / Latino102 1.3% Hispanic or Latino
Children Nativity (place of birth) in Montgomery
Children under 6 years - Living with two parents Both parents native 5,172 100.0% NativeBoth parents foreign-born 386 54.7% Native319 45.3% Foreign-bornOne native, one foreign-born parent 42 100.0% NativeChildren under 6 years - Living with one parent Native parent 7,650 100.0% NativeForeign-born parent 333 100.0% Foreign-bornChildren 6 to 17 years - Living with two parents Both parents native 11,654 100.0% NativeBoth parents foreign-born 1,278 70.4% Native538 29.6% Foreign-bornOne native, one foreign-born parent 286 74.1% Native100 25.9% Foreign-bornChildren 6 to 17 years - Living with one parent Native parent 14,724 100.0% NativeForeign-born parent 861 49.8% Native870 50.2% Foreign-born
Grandparents responsible for own grandchildren in Montgomery
Grandparents (30 to 59 years) White / Caucasian 157 50.8% Responsible for grandchildren152 49.2% Not responsible for grandchildrenBlack or African American 619 24.3% Responsible for grandchildren1,931 75.7% Not responsible for grandchildrenOther race 21 100.0% Responsible for grandchildrenTwo or more races 26 46.7% Responsible for grandchildren30 53.3% Not responsible for grandchildrenWhite alone, not Hispanic / Latino 151 49.6% Responsible for grandchildren154 50.4% Not responsible for grandchildrenHispanic or Latino 27 77.1% Responsible for grandchildren8 22.9% Not responsible for grandchildrenGrandparents (60 years and over) White / Caucasian 177 35.7% Responsible for grandchildren319 64.3% Not responsible for grandchildrenBlack or African American 402 31.2% Responsible for grandchildren887 68.8% Not responsible for grandchildrenOther race 12 100.0% Responsible for grandchildrenTwo or more races 59 100.0% Responsible for grandchildrenWhite alone, not Hispanic / Latino 179 37.5% Responsible for grandchildren299 62.5% Not responsible for grandchildrenHispanic or Latino 8 18.5% Responsible for grandchildren37 81.5% Not responsible for grandchildren
Zip codes: 36043 , 36064 , 36104 , 36105 , 36106 , 36107 , 36108 , 36109 , 36110 , 36111 , 36112 , 36113 , 36115 , 36116 , 36117 .