Races in Mount Vernon, New York (NY) Detailed Stats
Data:
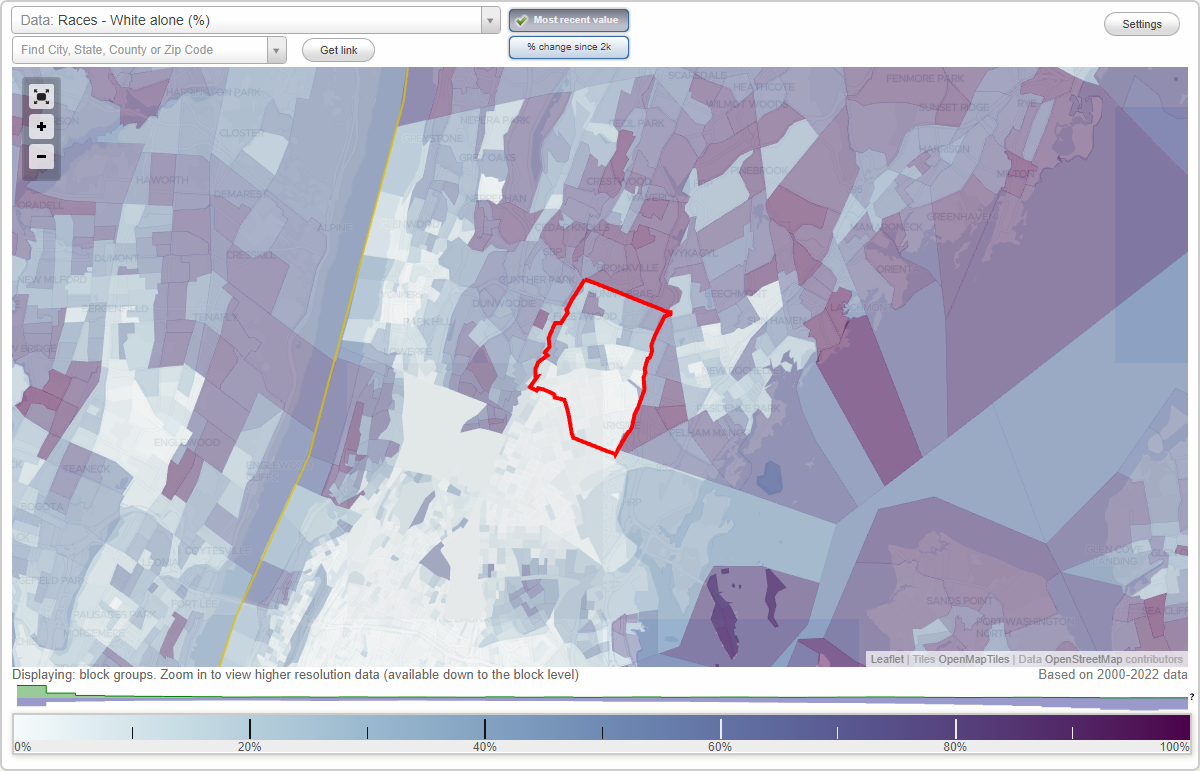
Races - White alone (%)
Races - White alone (% change since 2000)
Races - Black alone (%)
Races - Black alone (% change since 2000)
Races - American Indian alone (%)
Races - American Indian alone (% change since 2000)
Races - Asian alone (%)
Races - Asian alone (% change since 2000)
Races - Hispanic (%)
Races - Hispanic (% change since 2000)
Races - Native Hawaiian and Other Pacific Islander alone (%)
Races - Native Hawaiian and Other Pacific Islander alone (% change since 2000)
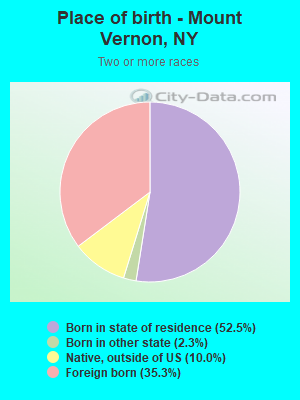
Races - Two or more races(%)
Races - Two or more races(% change since 2000)
Races - Other race alone (%)
Races - Other race alone (% change since 2000)
Racial diversity
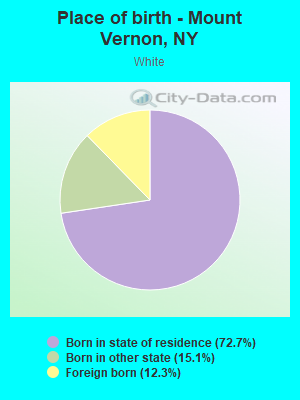
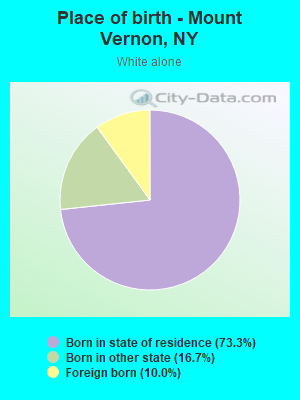
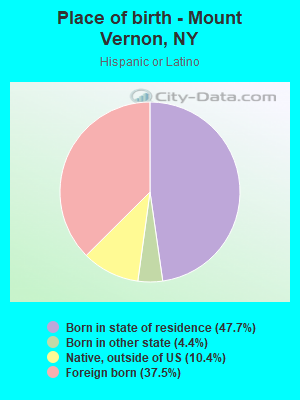
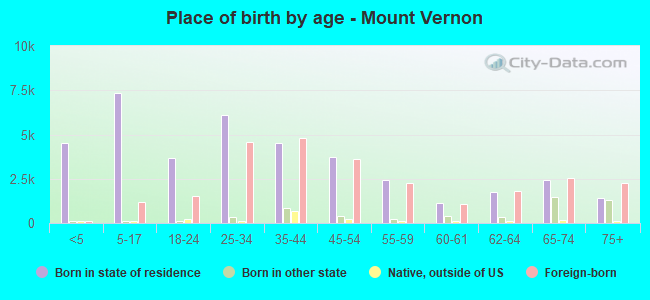
Place of birth - Born in state of residence (%)
Place of birth - Born in state of residence (%) - White
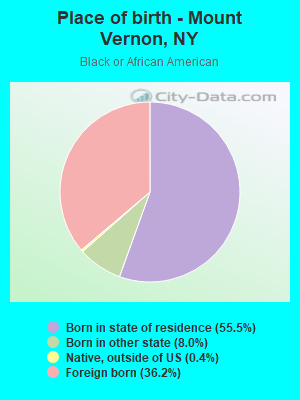
Place of birth - Born in state of residence (%) - Black or African American
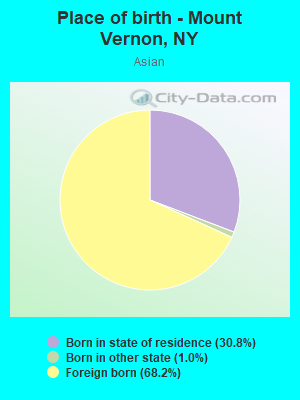
Place of birth - Born in state of residence (%) - Asian
Place of birth - Born in state of residence (%) - Hispanic or Latino
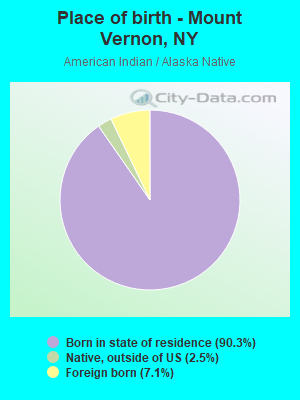
Place of birth - Born in state of residence (%) - American Indian and Alaska Native
Place of birth - Born in state of residence (%) - Multirace
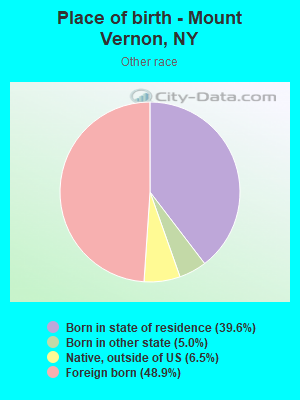
Place of birth - Born in state of residence (%) - Other Race
Place of birth - Born in other state (%)
Place of birth - Born in other state (%) - White
Place of birth - Born in other state (%) - Black or African American
Place of birth - Born in other state (%) - Asian
Place of birth - Born in other state (%) - Hispanic or Latino
Place of birth - Born in other state (%) - American Indian and Alaska Native
Place of birth - Born in other state (%) - Multirace
Place of birth - Born in other state (%) - Other Race
Place of birth - Native, outside of US (%)
Place of birth - Native, outside of US (%) - White
Place of birth - Native, outside of US (%) - Black or African American
Place of birth - Native, outside of US (%) - Asian
Place of birth - Native, outside of US (%) - Hispanic or Latino
Place of birth - Native, outside of US (%) - American Indian and Alaska Native
Place of birth - Native, outside of US (%) - Multirace
Place of birth - Native, outside of US (%) - Other Race
Place of birth - Foreign born (%)
Place of birth - Foreign born (%) - White
Place of birth - Foreign born (%) - Black or African American
Place of birth - Foreign born (%) - Asian
Place of birth - Foreign born (%) - Hispanic or Latino
Place of birth - Foreign born (%) - American Indian and Alaska Native
Place of birth - Foreign born (%) - Multirace
Place of birth - Foreign born (%) - Other Race
Residents speaking English at home (%)
Residents speaking English at home - Born in the United States (%)
Residents speaking English at home - Native, born elsewhere (%)
Residents speaking English at home - Foreign born (%)
Residents speaking Spanish at home (%)
Residents speaking Spanish at home - Born in the United States (%)
Residents speaking Spanish at home - Native, born elsewhere (%)
Residents speaking Spanish at home - Foreign born (%)
Residents speaking other language at home (%)
Residents speaking other language at home - Born in the United States (%)
Residents speaking other language at home - Native, born elsewhere (%)
Residents speaking other language at home - Foreign born (%)
Marital status - Never married (%)
Marital status - Now married (%)
Marital status - Separated (%)
Marital status - Widowed (%)
Marital status - Divorced (%)
Ancestries Reported - Arab (%)
Ancestries Reported - Czech (%)
Ancestries Reported - Danish (%)
Ancestries Reported - Dutch (%)
Ancestries Reported - English (%)
Ancestries Reported - French (%)
Ancestries Reported - French Canadian (%)
Ancestries Reported - German (%)
Ancestries Reported - Greek (%)
Ancestries Reported - Hungarian (%)
Ancestries Reported - Irish (%)
Ancestries Reported - Italian (%)
Ancestries Reported - Lithuanian (%)
Ancestries Reported - Norwegian (%)
Ancestries Reported - Polish (%)
Ancestries Reported - Portuguese (%)
Ancestries Reported - Russian (%)
Ancestries Reported - Scotch-Irish (%)
Ancestries Reported - Scottish (%)
Ancestries Reported - Slovak (%)
Ancestries Reported - Subsaharan African (%)
Ancestries Reported - Swedish (%)
Ancestries Reported - Swiss (%)
Ancestries Reported - Ukrainian (%)
Ancestries Reported - United States (%)
Ancestries Reported - Welsh (%)
Ancestries Reported - West Indian (%)
Ancestries Reported - Other (%)
Geographical mobility - Same house 1 year ago (%)
Geographical mobility - Same house 1 year ago (%) - White
Geographical mobility - Same house 1 year ago (%) - Black or African American
Geographical mobility - Same house 1 year ago (%) - Asian
Geographical mobility - Same house 1 year ago (%) - Hispanic or Latino
Geographical mobility - Same house 1 year ago (%) - American Indian and Alaska Native
Geographical mobility - Same house 1 year ago (%) - Multirace
Geographical mobility - Same house 1 year ago (%) - Other Race
Geographical mobility - Moved within same county (%)
Geographical mobility - Moved within same county (%) - White
Geographical mobility - Moved within same county (%) - Black or African American
Geographical mobility - Moved within same county (%) - Asian
Geographical mobility - Moved within same county (%) - Hispanic or Latino
Geographical mobility - Moved within same county (%) - American Indian and Alaska Native
Geographical mobility - Moved within same county (%) - Multirace
Geographical mobility - Moved within same county (%) - Other Race
Geographical mobility - Moved from different county within same state (%)
Geographical mobility - Moved from different county within same state (%) - White
Geographical mobility - Moved from different county within same state (%) - Black or African American
Geographical mobility - Moved from different county within same state (%) - Asian
Geographical mobility - Moved from different county within same state (%) - Hispanic or Latino
Geographical mobility - Moved from different county within same state (%) - American Indian and Alaska Native
Geographical mobility - Moved from different county within same state (%) - Multirace
Geographical mobility - Moved from different county within same state (%) - Other Race
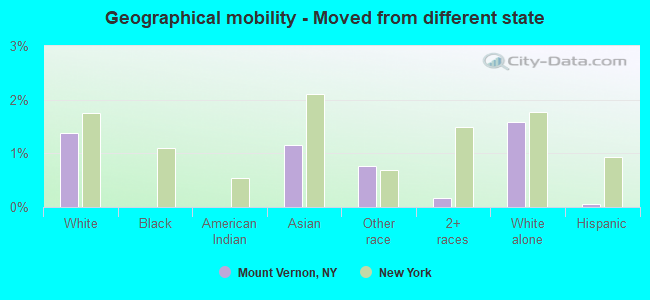
Geographical mobility - Moved from different state (%)
Geographical mobility - Moved from different state (%) - White
Geographical mobility - Moved from different state (%) - Black or African American
Geographical mobility - Moved from different state (%) - Asian
Geographical mobility - Moved from different state (%) - Hispanic or Latino
Geographical mobility - Moved from different state (%) - American Indian and Alaska Native
Geographical mobility - Moved from different state (%) - Multirace
Geographical mobility - Moved from different state (%) - Other Race
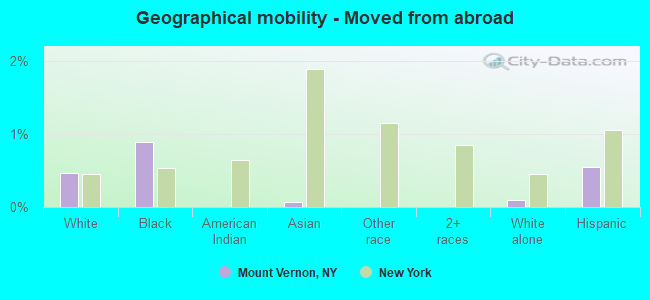
Geographical mobility - Moved from abroad (%)
Geographical mobility - Moved from abroad (%) - White
Geographical mobility - Moved from abroad (%) - Black or African American
Geographical mobility - Moved from abroad (%) - Asian
Geographical mobility - Moved from abroad (%) - Hispanic or Latino
Geographical mobility - Moved from abroad (%) - American Indian and Alaska Native
Geographical mobility - Moved from abroad (%) - Multirace
Geographical mobility - Moved from abroad (%) - Other Race
Place of birth for the foreign-born population - Ireland (%)
Place of birth for the foreign-born population - Denmark (%)
Place of birth for the foreign-born population - Norway (%)
Place of birth for the foreign-born population - Sweden (%)
Place of birth for the foreign-born population - United Kingdom (%)
Place of birth for the foreign-born population - England (%)
Place of birth for the foreign-born population - Scotland (%)
Place of birth for the foreign-born population - Other Northern Europe (%)
Place of birth for the foreign-born population - Austria (%)
Place of birth for the foreign-born population - Belgium (%)
Place of birth for the foreign-born population - France (%)
Place of birth for the foreign-born population - Germany (%)
Place of birth for the foreign-born population - Netherlands (%)
Place of birth for the foreign-born population - Switzerland (%)
Place of birth for the foreign-born population - Other Western Europe (%)
Place of birth for the foreign-born population - Greece (%)
Place of birth for the foreign-born population - Italy (%)
Place of birth for the foreign-born population - Portugal (%)
Place of birth for the foreign-born population - Spain (%)
Place of birth for the foreign-born population - Other Southern Europe (%)
Place of birth for the foreign-born population - Albania (%)
Place of birth for the foreign-born population - Belarus (%)
Place of birth for the foreign-born population - Bosnia and Herzegovina (%)
Place of birth for the foreign-born population - Bulgaria (%)
Place of birth for the foreign-born population - Croatia (%)
Place of birth for the foreign-born population - Czechoslovakia (%)
Place of birth for the foreign-born population - Hungary (%)
Place of birth for the foreign-born population - Latvia (%)
Place of birth for the foreign-born population - Lithuania (%)
Place of birth for the foreign-born population - North Macedonia (Macedonia) (%)
Place of birth for the foreign-born population - Moldova (%)
Place of birth for the foreign-born population - Poland (%)
Place of birth for the foreign-born population - Romania (%)
Place of birth for the foreign-born population - Russia (%)
Place of birth for the foreign-born population - Serbia (%)
Place of birth for the foreign-born population - Ukraine (%)
Place of birth for the foreign-born population - Other Eastern Europe (%)
Place of birth for the foreign-born population - China (%)
Place of birth for the foreign-born population - Hong Kong (%)
Place of birth for the foreign-born population - Taiwan (%)
Place of birth for the foreign-born population - Japan (%)
Place of birth for the foreign-born population - Korea (%)
Place of birth for the foreign-born population - Other Eastern Asia (%)
Place of birth for the foreign-born population - Afghanistan (%)
Place of birth for the foreign-born population - Bangladesh (%)
Place of birth for the foreign-born population - India (%)
Place of birth for the foreign-born population - Iran (%)
Place of birth for the foreign-born population - Kazakhstan (%)
Place of birth for the foreign-born population - Nepal (%)
Place of birth for the foreign-born population - Pakistan (%)
Place of birth for the foreign-born population - Sri Lanka (%)
Place of birth for the foreign-born population - Uzbekistan (%)
Place of birth for the foreign-born population - Other South Central Asia (%)
Place of birth for the foreign-born population - Burma (%)
Place of birth for the foreign-born population - Cambodia (%)
Place of birth for the foreign-born population - Indonesia (%)
Place of birth for the foreign-born population - Laos (%)
Place of birth for the foreign-born population - Malaysia (%)
Place of birth for the foreign-born population - Philippines (%)
Place of birth for the foreign-born population - Singapore (%)
Place of birth for the foreign-born population - Thailand (%)
Place of birth for the foreign-born population - Vietnam (%)
Place of birth for the foreign-born population - Other South Eastern Asia (%)
Place of birth for the foreign-born population - Armenia (%)
Place of birth for the foreign-born population - Iraq (%)
Place of birth for the foreign-born population - Israel (%)
Place of birth for the foreign-born population - Jordan (%)
Place of birth for the foreign-born population - Kuwait (%)
Place of birth for the foreign-born population - Lebanon (%)
Place of birth for the foreign-born population - Saudi Arabia (%)
Place of birth for the foreign-born population - Syria (%)
Place of birth for the foreign-born population - Turkey (%)
Place of birth for the foreign-born population - Yemen (%)
Place of birth for the foreign-born population - Other Western Asia (%)
Place of birth for the foreign-born population - Eritrea (%)
Place of birth for the foreign-born population - Ethiopia (%)
Place of birth for the foreign-born population - Kenya (%)
Place of birth for the foreign-born population - Somalia (%)
Place of birth for the foreign-born population - Uganda (%)
Place of birth for the foreign-born population - Zimbabwe (%)
Place of birth for the foreign-born population - Other Eastern Africa (%)
Place of birth for the foreign-born population - Cameroon (%)
Place of birth for the foreign-born population - Congo (%)
Place of birth for the foreign-born population - Democratic Republic of Congo (Zaire) (%)
Place of birth for the foreign-born population - Other Middle Africa (%)
Place of birth for the foreign-born population - Egypt (%)
Place of birth for the foreign-born population - Morocco (%)
Place of birth for the foreign-born population - Sudan (%)
Place of birth for the foreign-born population - Other Northern Africa (%)
Place of birth for the foreign-born population - South Africa (%)
Place of birth for the foreign-born population - Other Southern Africa (%)
Place of birth for the foreign-born population - Cabo Verde (%)
Place of birth for the foreign-born population - Ghana (%)
Place of birth for the foreign-born population - Liberia (%)
Place of birth for the foreign-born population - Nigeria (%)
Place of birth for the foreign-born population - Senegal (%)
Place of birth for the foreign-born population - Sierra Leone (%)
Place of birth for the foreign-born population - Other Western Africa (%)
Place of birth for the foreign-born population - Australia (%)
Place of birth for the foreign-born population - New Zealand (%)
Place of birth for the foreign-born population - Fiji (%)
Place of birth for the foreign-born population - Micronesia (%)
Place of birth for the foreign-born population - Bahamas (%)
Place of birth for the foreign-born population - Barbados (%)
Place of birth for the foreign-born population - Cuba (%)
Place of birth for the foreign-born population - Dominica (%)
Place of birth for the foreign-born population - Dominican Republic (%)
Place of birth for the foreign-born population - Grenada (%)
Place of birth for the foreign-born population - Haiti (%)
Place of birth for the foreign-born population - Jamaica (%)
Place of birth for the foreign-born population - St. Vincent and the Grenadines (%)
Place of birth for the foreign-born population - Trinidad and Tobago (%)
Place of birth for the foreign-born population - West Indies (%)
Place of birth for the foreign-born population - Other Caribbean (%)
Place of birth for the foreign-born population - Belize (%)
Place of birth for the foreign-born population - Costa Rica (%)
Place of birth for the foreign-born population - El Salvador (%)
Place of birth for the foreign-born population - Guatemala (%)
Place of birth for the foreign-born population - Honduras (%)
Place of birth for the foreign-born population - Mexico (%)
Place of birth for the foreign-born population - Nicaragua (%)
Place of birth for the foreign-born population - Panama (%)
Place of birth for the foreign-born population - Other Central America (%)
Place of birth for the foreign-born population - Argentina (%)
Place of birth for the foreign-born population - Bolivia (%)
Place of birth for the foreign-born population - Brazil (%)
Place of birth for the foreign-born population - Chile (%)
Place of birth for the foreign-born population - Colombia (%)
Place of birth for the foreign-born population - Ecuador (%)
Place of birth for the foreign-born population - Guyana (%)
Place of birth for the foreign-born population - Peru (%)
Place of birth for the foreign-born population - Uruguay (%)
Place of birth for the foreign-born population - Venezuela (%)
Place of birth for the foreign-born population - Other South America (%)
Place of birth for the foreign-born population - Canada (%)
Place of birth for the foreign-born population - Other Northern America (%)
Place of birth for the foreign-born population - Other (%)
According to 2022 data, the most numerous races in Mount Vernon, NY are White alone (7,321 residents), Hispanic (12,531 residents), and Black alone (43,882 residents). 72.6% of Mount Vernon residents speak English at home. 32.4% of Mount Vernon, NY residents are foreign-born (26.6% born in Latin America), which is 32.0% greater than the foreign-born rate of 22.0% across the entire state of New York.
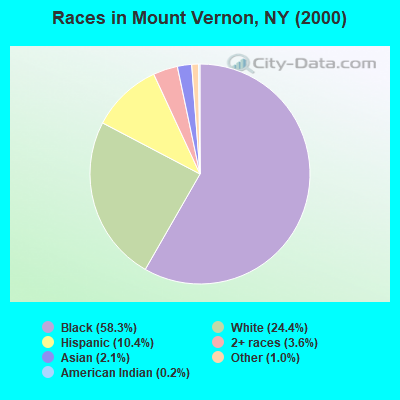
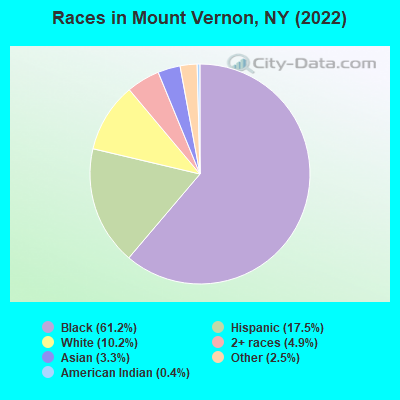
Race distribution in Mount Vernon
2000 2022
39,889 58.3% Black alone 16,677 24.4% White alone 7,083 10.4% Hispanic 2,440 3.6% Two or more races 1,433 2.1% Asian alone 663 1.0% Other race alone 160 0.2% American Indian alone 36 0.05% Native Hawaiian and Other
43,882 61.2% Black alone 12,531 17.5% Hispanic 7,321 10.2% White alone 3,526 4.9% Two or more races 2,399 3.3% Asian alone 1,793 2.5% Other race alone 265 0.4% American Indian alone
2000 2022
11,760,981 62.0% White alone 2,867,583 15.1% Hispanic 2,812,623 14.8% Black alone 1,035,926 5.5% Asian alone 366,116 1.9% Two or more races 75,499 0.4% Other race alone 52,499 0.3% American Indian alone 5,230 0.03% Native Hawaiian and Other
10,408,933 52.9% White alone 3,867,299 19.7% Hispanic 2,633,840 13.4% Black alone 1,776,286 9.0% Asian alone 732,670 3.7% Two or more races 216,110 1.1% Other race alone 35,082 0.2% American Indian alone 6,931 0.04% Native Hawaiian and Other
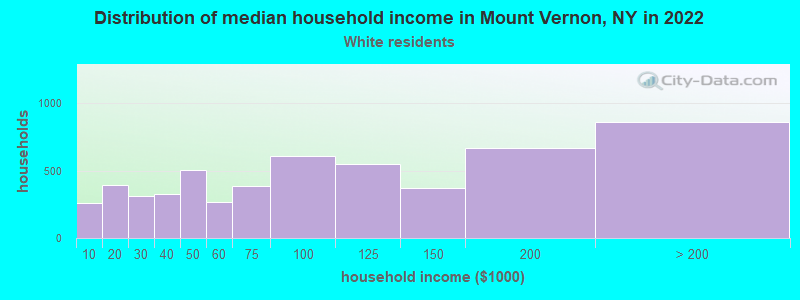
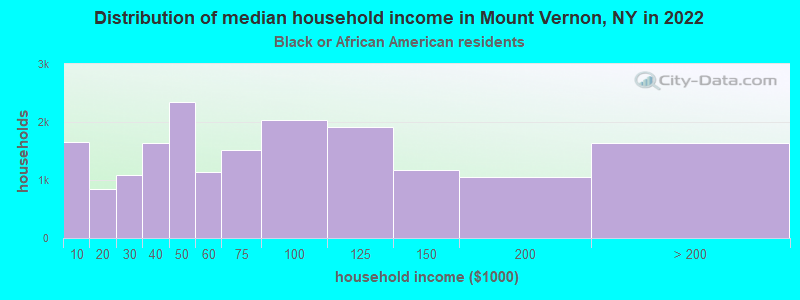
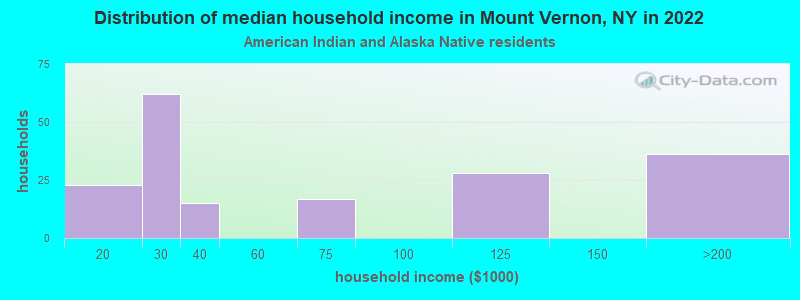
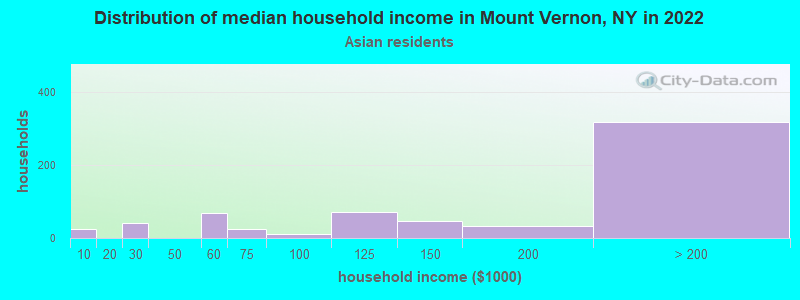
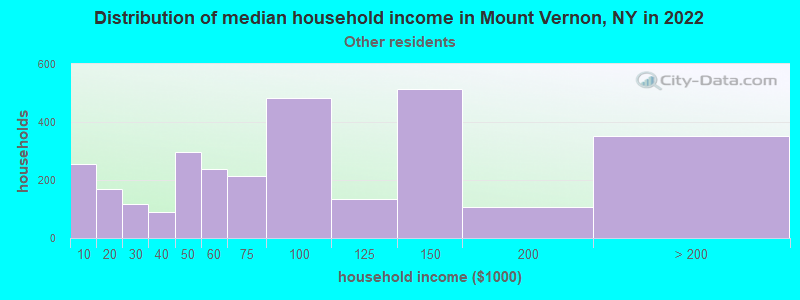
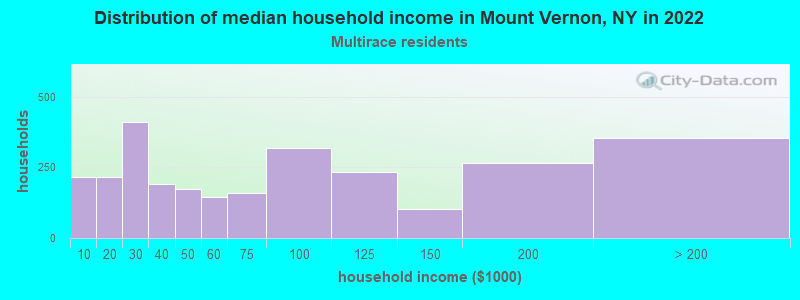
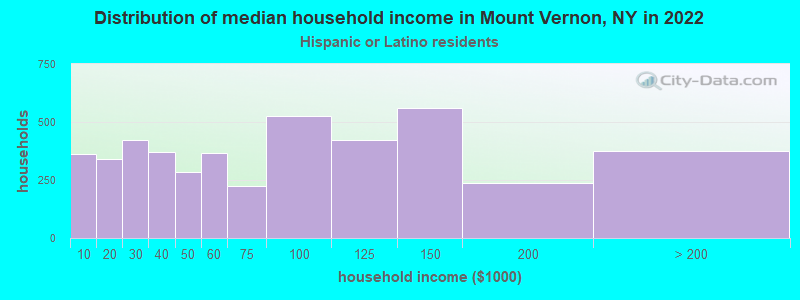
Income and house value in Mount Vernon Median household income in 2022 $69,252 White non-Hispanic householders$61,372 Black householdersover $200,000 Asian householders$98,313 Some other race householders$64,063 Two or more races householders$64,112 Hispanic or Latino race householdersMedian 2022 house value $470,730 White Non-Hispanic householders$368,205 Black or African American householders $404,991 Asian householders$354,750 Some other race householders$384,895 Two or more races householders$404,821 Hispanic or Latino householders
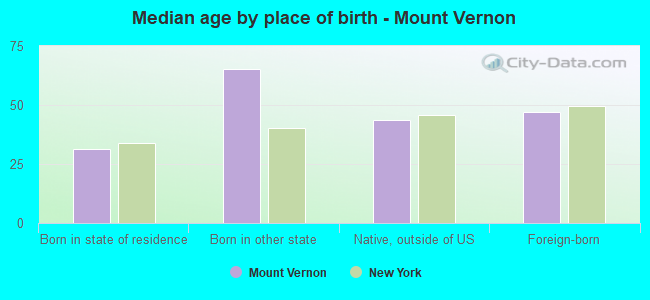
Median age by race in Mount Vernon
45.9 Median age for White residents45.6 54.2 41.6 Median age for Black or African American residents38.9 43.9 17.8 Median age for American Indian / Alaska Native residents-666,666,666.0 -666,666,666.0 49.7 Median age for Asian residents34.7 65.2 -666,666,666.0 Median age for Native Hawaiian / Pacific Islander residents-666,666,666.0 -666,666,666.0 38.0 Median age for Other race residents37.7 40.3 33.6 Median age for Two or more races residents34.0 31.6 54.5 Median age for White alone residents54.1 56.6 37.8 Median age for Hispanic or Latino residents36.7 41.9
Owner/renter occupied households by race in Mount Vernon
House owners and renters - White residents 2,240 55.2% Owner occupied1,817 44.8% Renter occupiedHouse owners and renters - Black or African American residents 6,960 38.6% Owner occupied11,088 61.4% Renter occupiedHouse owners and renters - American Indian / Alaska Native residents 79 31.9% Owner occupied168 68.1% Renter occupiedHouse owners and renters - Asian residents 473 71.9% Owner occupied185 28.1% Renter occupiedHouse owners and renters - Other race residents 657 18.9% Owner occupied2,816 81.1% Renter occupiedHouse owners and renters - Two or more races residents 656 25.5% Owner occupied1,918 74.5% Renter occupiedHouse owners and renters - White alone residents 2,240 59.7% Owner occupied1,513 40.3% Renter occupiedHouse owners and renters - Hispanic or Latino residents 964 20.1% Owner occupied3,826 79.9% Renter occupied
Language usage in Mount Vernon
English speakers - Total 72.6% of residents of Mount Vernon speak English at home.
14.6% of residents speak Spanish at home 5,355 54.8% Speak English very well4,413 45.2% Speak English less than very well12.8% of residents speak other language at home 4,345 50.6% Speak English very well4,241 49.4% Speak English less than very well
English speakers - Born in the United States 84.5% of residents of Mount Vernon speak English at home.
10.4% of residents speak Spanish at home 485 87.4% Speak English very well70 12.6% Speak English less than very well5.1% of residents speak other language at home 269 100.0% Speak English very well
English speakers - Native, born elsewhere 10.0% of residents of Mount Vernon speak English at home.
88.7% of residents speak Spanish at home 1,074 82.6% Speak English very well226 17.4% Speak English less than very well1.4% of residents speak other language at home 20 100.0% Speak English very well
English speakers - Foreign-born 56.8% of residents of Mount Vernon speak English at home.
15.5% of residents speak Spanish at home 919 23.0% Speak English very well3,069 77.0% Speak English less than very well27.7% of residents speak other language at home 3,014 42.3% Speak English very well4,107 57.7% Speak English less than very well
White (Caucasian) - Speak only English Native:
87.3% (5,764)Foreign-born:
21.2% (211)
White (Caucasian) - Speak another language Native:
12.7% (839)Foreign-born:
78.8% (785)
Black or African American - Speak only English Native:
95.8% (25,592)Foreign-born:
72.1% (11,682)
Black or African American - Speak another language Native:
4.2% (1,125)Foreign-born:
27.9% (4,510)
American Indian / Alaska Native - Speak another language Native:
58.9% (396)Foreign-born:
100.0% (59)
Asian - Speak only English Native:
81.6% (193)Foreign-born:
43.8% (491)
Asian - Speak another language Native:
18.0% (42)Foreign-born:
58.0% (650)
Other race - Speak only English Native:
18.2% (757)Foreign-born:
23.0% (1,005)
Other race - Speak another language Native:
81.8% (3,395)Foreign-born:
77.0% (3,359)
Two or more races - Speak only English Native:
50.3% (1,632)Foreign-born:
63.6% (1,625)
Two or more races - Speak another language Native:
49.7% (1,611)Foreign-born:
36.4% (931)
White alone - Speak only English Native:
85.8% (7,315)Foreign-born:
28.4% (603)
White alone - Speak another language Native:
13.4% (1,145)Foreign-born:
69.6% (1,478)
Hispanic or Latino - Speak only English Native:
17.7% (1,142)Foreign-born:
15.0% (706)
Hispanic or Latino - Speak another language Native:
82.3% (5,316)Foreign-born:
85.0% (3,988)
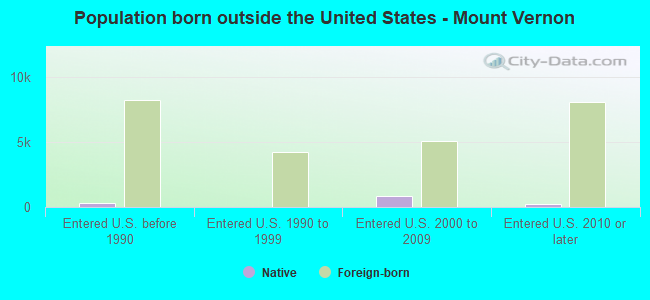
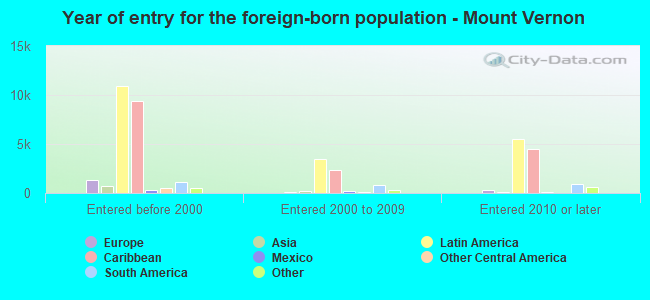
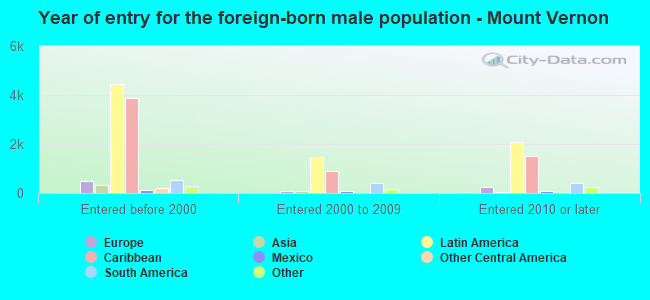
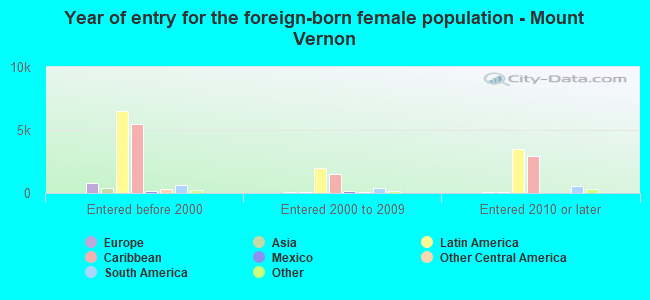
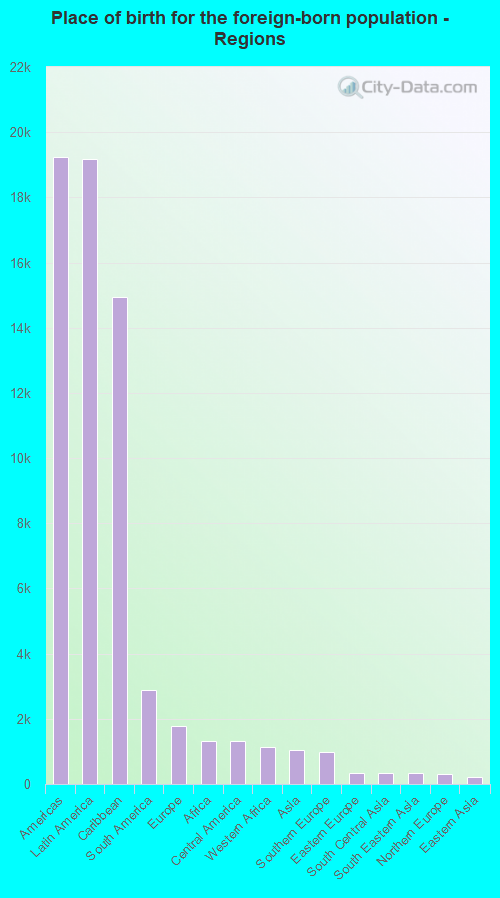
Foreign-born residents in Mount Vernon 23,397 residents are foreign born (26.6% Latin America ).
This city:
32.4%New York:
22.6%
Marital status for residents in Mount Vernon Marital status - White (Caucasian) population 15 years and over
Males 33.4% Never married53.1% Now married4.5% Separated2.5% Widowed6.5% DivorcedFemales 27.7% Never married46.4% Now married0.0% Separated15.8% Widowed10.0% DivorcedWomen who gave birth in the past 12 months Now married:
15.4% (20)Unmarried:
84.6% (107)
Women who did not give birth in the past 12 months Now married:
40.6% (974)Unmarried:
59.4% (1,426)
Marital status - Black or African American population 15 years and over
Males 54.5% Never married31.4% Now married2.1% Separated1.7% Widowed10.2% DivorcedFemales 43.7% Never married27.1% Now married5.6% Separated8.1% Widowed15.6% DivorcedWomen who gave birth in the past 12 months Now married:
50.2% (136)Unmarried:
49.8% (135)
Women who did not give birth in the past 12 months Now married:
23.0% (2,638)Unmarried:
77.0% (8,813)
Marital status - American Indian / Alaska Native population 15 years and over
Males 77.5% Never married12.1% Now married0.0% Separated0.0% Widowed10.4% DivorcedFemales 70.1% Never married29.9% Now married0.0% Separated0.0% Widowed0.0% DivorcedWomen who did not give birth in the past 12 months Now married:
9.6% (23)Unmarried:
90.4% (215)
Marital status - Asian population 15 years and over
Males 20.0% Never married60.9% Now married11.5% Separated0.0% Widowed7.6% DivorcedFemales 25.2% Never married66.0% Now married0.0% Separated2.5% Widowed6.3% DivorcedWomen who gave birth in the past 12 months Now married:
100.0% (26)Unmarried:
0.0% (0)
Women who did not give birth in the past 12 months Now married:
61.5% (278)Unmarried:
38.5% (174)
Marital status - Other race population 15 years and over
Males 44.1% Never married40.4% Now married1.7% Separated1.5% Widowed12.3% DivorcedFemales 30.3% Never married42.9% Now married3.7% Separated2.4% Widowed20.7% DivorcedWomen who gave birth in the past 12 months Now married:
86.1% (99)Unmarried:
13.9% (16)
Women who did not give birth in the past 12 months Now married:
45.3% (1,185)Unmarried:
54.7% (1,431)
Marital status - Two or more races population 15 years and over
Males 38.6% Never married49.0% Now married4.3% Separated0.0% Widowed8.0% DivorcedFemales 51.2% Never married26.4% Now married1.0% Separated2.5% Widowed18.9% DivorcedWomen who gave birth in the past 12 months Now married:
52.2% (15)Unmarried:
47.8% (14)
Women who did not give birth in the past 12 months Now married:
28.7% (484)Unmarried:
71.3% (1,200)
Marital status - White alone, not Hispanic / Latino population 15 years and over
Males 31.3% Never married57.9% Now married4.9% Separated2.7% Widowed3.2% DivorcedFemales 22.3% Never married49.9% Now married0.0% Separated17.0% Widowed10.8% DivorcedWomen who gave birth in the past 12 months Now married:
15.4% (21)Unmarried:
84.6% (114)
Women who did not give birth in the past 12 months Now married:
43.8% (991)Unmarried:
56.2% (1,273)
Marital status - Hispanic or Latino population 15 years and over
Males 54.8% Never married36.7% Now married0.0% Separated0.0% Widowed8.5% DivorcedFemales 43.0% Never married36.1% Now married3.0% Separated4.0% Widowed13.8% DivorcedWomen who gave birth in the past 12 months Now married:
78.6% (125)Unmarried:
21.4% (34)
Women who did not give birth in the past 12 months Now married:
39.0% (1,303)Unmarried:
61.0% (2,035)
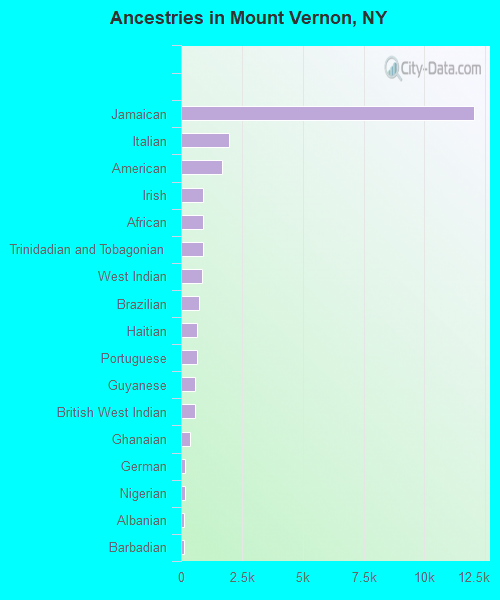
Ancestries in Mount Vernon
12,052 25.5% Jamaican1,961 4.1% Italian1,692 3.6% American923 1.9% Irish916 1.9% African907 1.9% Trinidadian and Tobagonian869 1.8% West Indian733 1.5% Brazilian671 1.4% Haitian653 1.4% Portuguese570 1.2% Guyanese564 1.2% British West Indian380 0.8% Ghanaian172 0.4% German145 0.3% Nigerian129 0.3% Albanian111 0.2% Barbadian109 0.2% European105 0.2% Sierra Leonean93 0.2% Russian88 0.2% Polish73 0.2% Greek72 0.2% Eastern European56 0.1% British31 0.07% Afghan29 0.06% English29 0.06% Belizean28 0.06% Northern European28 0.06% Turkish26 0.05% Israeli24 0.05% Scotch-Irish23 0.05% Ukrainian19 0.04% French Canadian15 0.03% Romanian14 0.03% Maltese11 0.02% Finnish10 0.02% Norwegian7 0.01% Moroccan6 0.01% Arab6 0.01% Scottish6 0.01% French6 0.01% Estonian5 0.01% Swedish
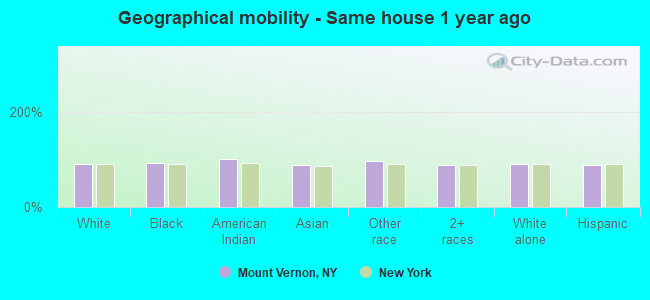
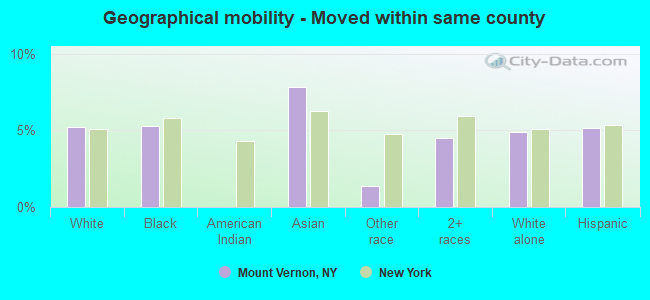
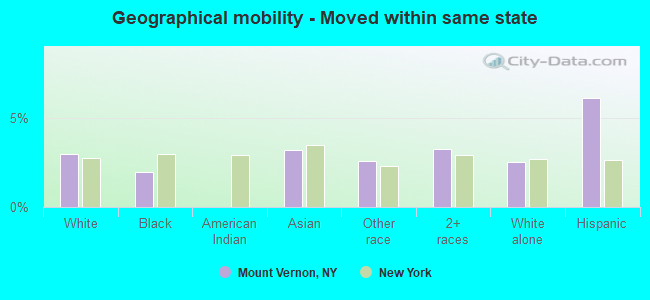
Geographical mobility in Mount Vernon Same house 1 year ago 10,328 90.0% White (Caucasian)40,800 91.9% Black or African American614 100.0% American Indian / Alaska Native1,199 87.9% Asian7,864 95.7% Other race6,367 88.1% Two or more races9,852 90.8% White alone, not Hispanic / Latino11,102 88.0% Hispanic or LatinoMoved within same county 596 5.2% White / Caucasian2,342 5.3% Black or African American106 7.8% Asian115 1.4% Other race325 4.5% Two or more races534 4.9% White alone, not Hispanic / Latino654 5.2% Hispanic or LatinoMoved within same state 337 2.9% White / Caucasian860 1.9% Black or African American44 3.2% Asian211 2.6% Other race236 3.3% Two or more races275 2.5% White alone, not Hispanic / Latino770 6.1% Hispanic or LatinoMoved from different state 158 1.4% White / Caucasian16 1.2% Asian62 0.8% Other race13 0.2% Two or more races172 1.6% White alone, not Hispanic / Latino8 0.1% Hispanic or LatinoMoved from abroad 54 0.5% White396 0.9% Black or African American1 0.1% Asian11 0.1% White alone, not Hispanic / Latino68 0.5% Hispanic or Latino
Children Nativity (place of birth) in Mount Vernon
Children under 6 years - Living with two parents Both parents native 844 100.0% NativeBoth parents foreign-born 469 100.0% NativeOne native, one foreign-born parent 2,122 100.0% NativeChildren under 6 years - Living with one parent Native parent 645 100.0% NativeForeign-born parent 414 100.0% NativeChildren 6 to 17 years - Living with two parents Both parents native 1,326 100.0% NativeBoth parents foreign-born 855 100.0% NativeOne native, one foreign-born parent 468 100.0% NativeChildren 6 to 17 years - Living with one parent Native parent 854 100.0% NativeForeign-born parent 2,721 59.8% Native1,831 40.2% Foreign-born
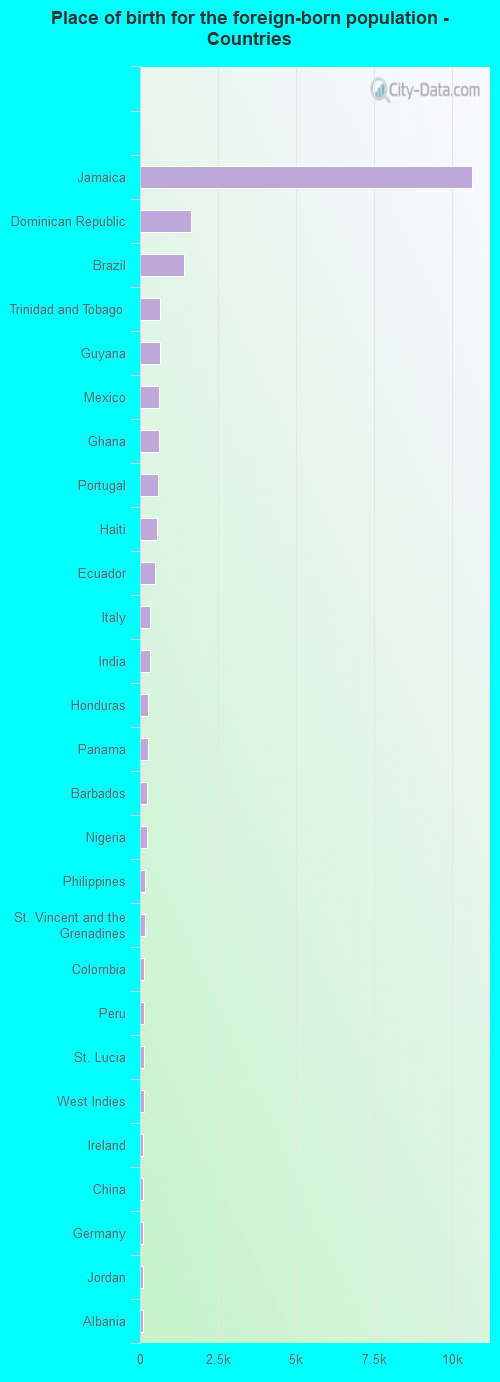
Place of birth for residents in Mount Vernon 19,249 Americas19,171 Latin America14,958 Caribbean2,899 South America1,779 Europe1,327 Africa1,314 Central America1,120 Western Africa1,040 Asia991 Southern Europe342 Eastern Europe337 South Central Asia331 South Eastern Asia307 Northern Europe218 Eastern Asia153 Western Asia138 Western Europe138 China78 Northern America49 Eastern Africa24 Middle Africa24 Northern Africa10,667 Jamaica1,634 Dominican Republic1,423 Brazil626 Trinidad and Tobago626 Guyana620 Mexico598 Ghana583 Portugal553 Haiti485 Ecuador327 Italy316 India265 Honduras253 Panama230 Barbados228 Nigeria174 Philippines153 St. Vincent and the Grenadines142 Colombia137 Peru135 St. Lucia126 West Indies110 Ireland109 China108 Germany104 Jordan102 Albania86 United Kingdom84 Thailand81 Poland80 Korea80 Greece78 Grenada78 Canada77 Dominica66 England64 Guatemala56 Czechoslovakia56 Togo55 Russia45 Sierra Leone41 Kenya41 Nicaragua37 Vietnam36 El Salvador35 Venezuela34 Cuba33 Belize31 Israel30 Ukraine30 Bolivia28 Taiwan24 Morocco23 Denmark22 Laos18 France15 Afghanistan15 Scotland12 Indonesia10 Austria9 Hungary7 Tanzania6 Argentina4 Pakistan4 Sweden3 Uruguay
Grandparents responsible for own grandchildren in Mount Vernon
Grandparents (30 to 59 years) White / Caucasian 95 100.0% Not responsible for grandchildrenBlack or African American 156 43.1% Responsible for grandchildren205 56.9% Not responsible for grandchildrenAmerican Indian / Alaska Native 49 100.0% Responsible for grandchildrenAsian 31 100.0% Not responsible for grandchildrenOther race 14 100.0% Not responsible for grandchildrenWhite alone, not Hispanic / Latino 118 100.0% Not responsible for grandchildrenHispanic or Latino 96 100.0% Not responsible for grandchildrenGrandparents (60 years and over) White / Caucasian 2 3.5% Responsible for grandchildren48 96.5% Not responsible for grandchildrenBlack or African American 282 16.9% Responsible for grandchildren1,390 83.1% Not responsible for grandchildrenAsian 46 100.0% Not responsible for grandchildrenOther race 89 100.0% Not responsible for grandchildrenWhite alone, not Hispanic / Latino 2 3.2% Responsible for grandchildren53 96.8% Not responsible for grandchildrenHispanic or Latino 31 19.6% Responsible for grandchildren127 80.4% Not responsible for grandchildren