Races in Murphy, Idaho (ID) Detailed Stats
Ancestries, Foreign-born residents, place of birth
Data:
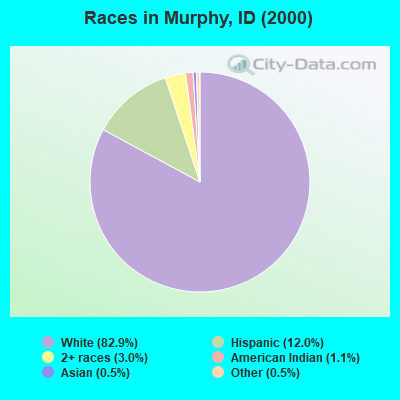
Race distribution in Murphy

- 1,25382.9%White alone
- 18212.0%Hispanic
- 463.0%Two or more races
- 161.1%American Indian alone
- 80.5%Asian alone
- 70.5%Other race alone
2000
2022
-
- 1,139,29188.0%White alone
- 101,6907.9%Hispanic
- 18,2611.4%Two or more races
- 15,7891.2%American Indian alone
- 11,6410.9%Asian alone
- 4,8890.4%Black alone
- 1,1920.09%Other race alone
- 1,2000.09%Native Hawaiian and Other
Pacific Islander alone
-
- 1,531,21979.0%White alone
- 261,92113.5%Hispanic
- 81,1124.2%Two or more races
- 25,1741.3%Asian alone
- 15,8250.8%American Indian alone
- 11,8680.6%Black alone
- 8,7520.5%Other race alone
- 3,1620.2%Native Hawaiian and Other
Pacific Islander alone
Income and house value in Murphy
- Median household income in 2022
- $60,906White non-Hispanic householders
- $57,805American Indian and Alaska Native householders
- $20,821Asian householders
- $41,864Some other race householders
- $76,117Two or more races householders
- $44,887Hispanic or Latino race householders
- Median 2022 house value
- $468,302White Non-Hispanic householders
- $252,192Some other race householders
- over $1,000,000Two or more races householders
- $290,991Hispanic or Latino householders