Races in Murray, Kentucky (KY) Detailed Stats
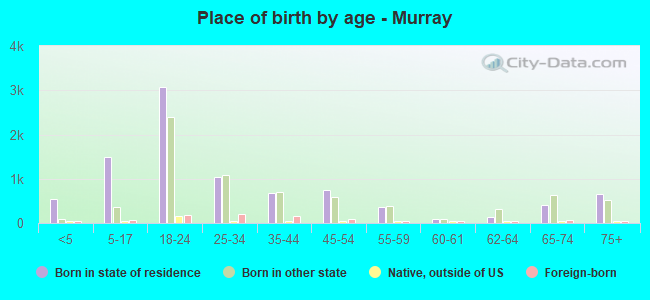
Ancestries, Foreign-born residents, place of birth
Settings
X


Recent posts about races in Murray, Kentucky on our local forum with over 2,400,000 registered users:
 | The Holidays at Murray State and other questions (2 replies) |
| Briggs & Stratton closing facility in Murray, Kentucky fall 2020. (8 replies) |
| Western KY culture (9 replies) |
| Considering moving to KY – you want details, I got details! (9 replies) |
| Single woman retiring to Kentucky or Tennessee (15 replies) |
| Is Kentucky the south or the midwest? (921 replies) |
Latest news about races in Murray, KY collected exclusively by city-data.com from local newspapers, TV, and radio stations
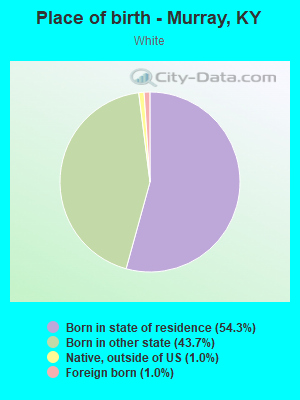
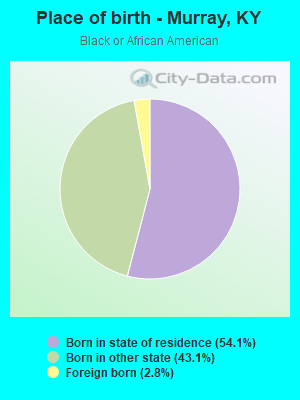
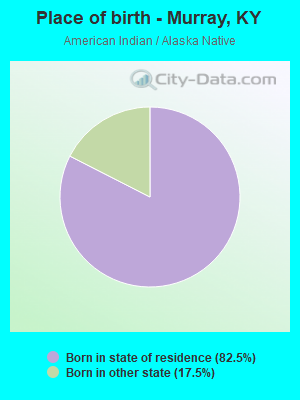
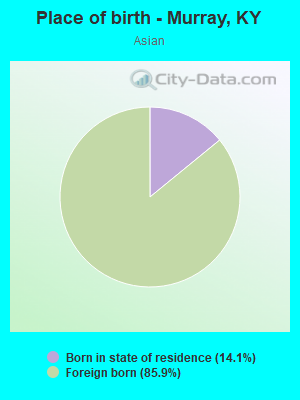
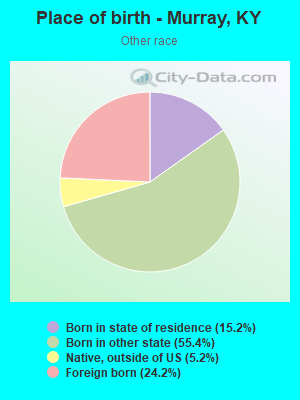
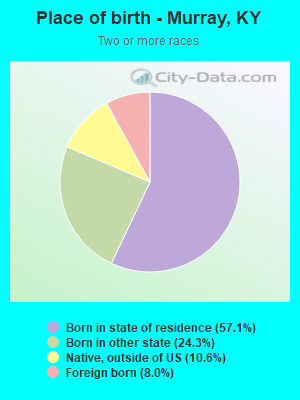
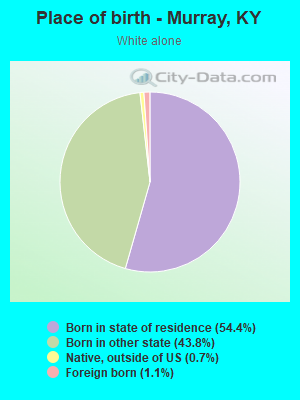
According to 2022 data, the most numerous races in Murray, KY are White alone (14,487 residents), Black alone (1,071 residents), and Hispanic (355 residents). 94.6% of Murray residents speak English at home. 4.7% of Murray, KY residents are foreign-born (2.6% born in Asia, 1.0% born in Latin America, 0.6% born in Europe), which is 15.1% greater than the foreign-born rate of 4.0% across the entire state of Kentucky.
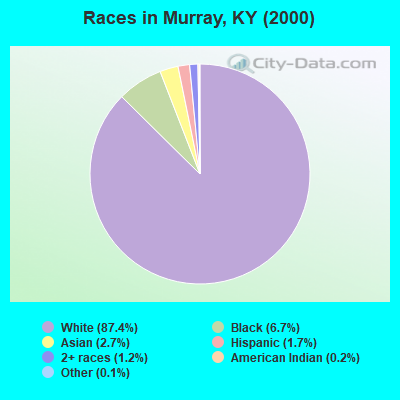
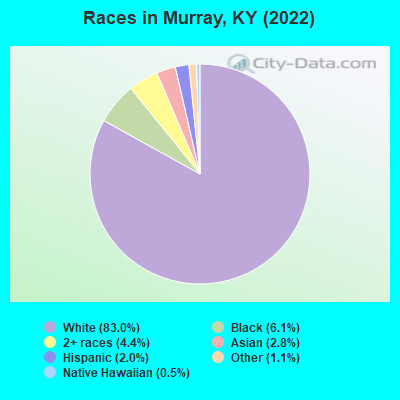
Race distribution in Murray
2000
2022

- 13,06987.4%White alone
- 9996.7%Black alone
- 4002.7%Asian alone
- 2591.7%Hispanic
- 1801.2%Two or more races
- 270.2%American Indian alone
- 150.1%Other race alone
- 10.01%Native Hawaiian and Other
Pacific Islander alone
-
- 14,48783.0%White alone
- 1,0716.1%Black alone
- 7734.4%Two or more races
- 4822.8%Asian alone
- 3552.0%Hispanic
- 1861.1%Other race alone
- 940.5%Native Hawaiian and Other
Pacific Islander alone - 90.05%American Indian alone
2000
2022
-
- 3,608,01389.3%White alone
- 293,6397.3%Black alone
- 59,9391.5%Hispanic
- 37,7500.9%Two or more races
- 29,3680.7%Asian alone
- 7,9390.2%American Indian alone
- 3,8460.10%Other race alone
- 1,2750.03%Native Hawaiian and Other
Pacific Islander alone

-
- 3,710,99882.2%White alone
- 343,1947.6%Black alone
- 187,4834.2%Hispanic
- 187,3944.2%Two or more races
- 62,2401.4%Asian alone
- 13,5290.3%Other race alone
- 4,3020.10%American Indian alone
- 3,1700.07%Native Hawaiian and Other
Pacific Islander alone

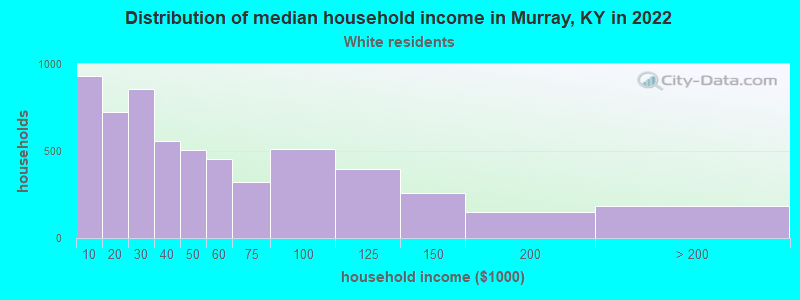
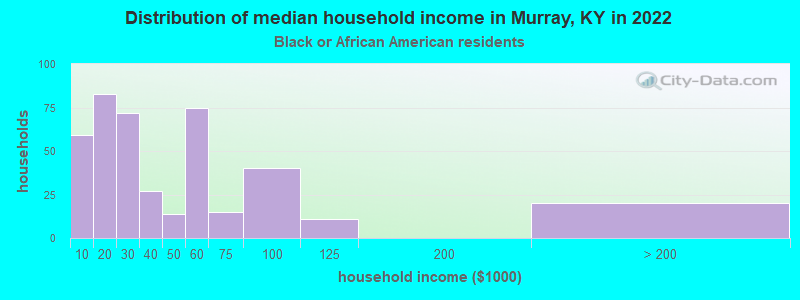
Income and house value in Murray
- Median household income in 2022
- $38,130White non-Hispanic householders
- $30,628Black householders
- $46,186Hispanic or Latino race householders
- Median 2022 house value
- $213,507White Non-Hispanic householders
- $125,754Black or African American householders
- $212,507American Indian or Alaska Native householders
- $343,761Asian householders
- $81,252Some other race householders
- $212,507Two or more races householders
- $81,252Hispanic or Latino householders
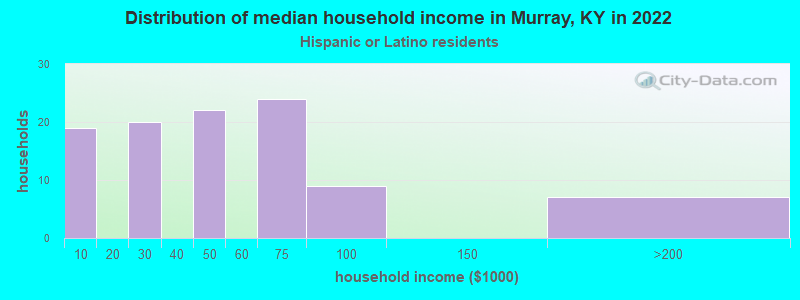
Household income for White non-Hispanic householders
Household income for Black householders
Household income for Asian householders
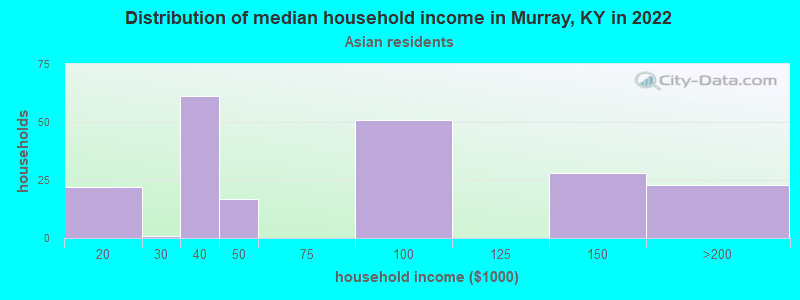
Household income for Some other race householders
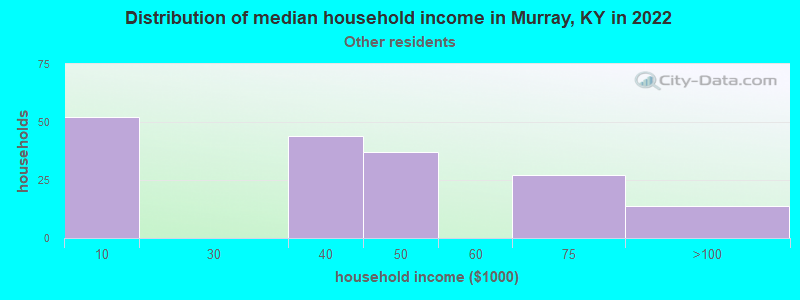
Household income for Two or more races householders
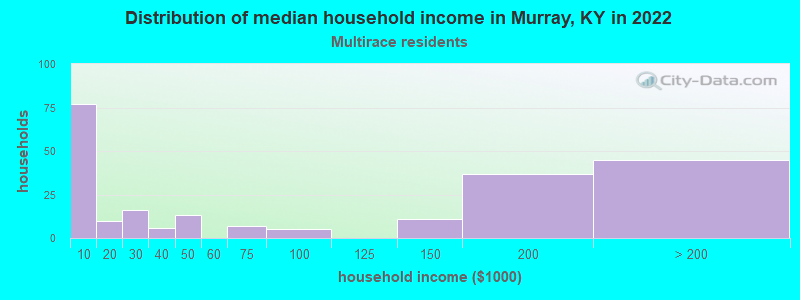
Household income for Hispanic or Latino race householders
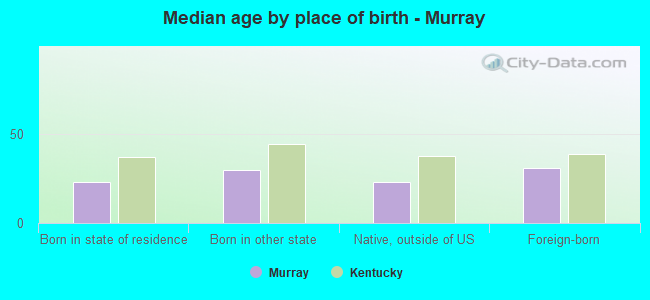
Median age by race in Murray
- 26.0Median age for White residents
- 28.3Males
- 23.5Females
- 28.3Median age for Black or African American residents
- 27.7Males
- 28.3Females
- 9.2Median age for American Indian / Alaska Native residents
- 10.6Males
- -630,065,358.8Females
- 30.7Median age for Asian residents
- 19.5Males
- 31.5Females
- 21.3Median age for Native Hawaiian / Pacific Islander residents
- -724,043,715.1Males
- 23.8Females
- 34.0Median age for Other race residents
- 23.6Males
- 49.0Females
- 24.9Median age for Two or more races residents
- 28.0Males
- 23.5Females
- 25.8Median age for White alone residents
- 28.2Males
- 23.1Females
- 31.9Median age for Hispanic or Latino residents
- 20.0Males
- 39.5Females
Owner/renter occupied households by race in Murray
- House owners and renters - White residents
- 2,49043.4%Owner occupied
- 3,24556.6%Renter occupied
- House owners and renters - Black or African American residents
- 5713.9%Owner occupied
- 35486.1%Renter occupied
- House owners and renters - American Indian / Alaska Native residents
- 8100.0%Renter occupied
- House owners and renters - Asian residents
- 9442.8%Owner occupied
- 12657.2%Renter occupied
- House owners and renters - Native Hawaiian / Pacific Islander residents
- 14100.0%Renter occupied
- House owners and renters - Other race residents
- 9662.2%Owner occupied
- 5937.8%Renter occupied
- House owners and renters - Two or more races residents
- 8340.4%Owner occupied
- 12359.6%Renter occupied
- House owners and renters - White alone residents
- 2,49743.5%Owner occupied
- 3,24356.5%Renter occupied
- House owners and renters - Hispanic or Latino residents
- 3940.1%Owner occupied
- 5859.9%Renter occupied
Language usage in Murray
- English speakers - Total
- 94.6% of residents of Murray speak English at home.
- 2.1% of residents speak Spanish at home
- 32894.0%Speak English very well
- 216.0%Speak English less than very well
- 3.2% of residents speak other language at home
- 27250.3%Speak English very well
- 26949.7%Speak English less than very well
- English speakers - Born in the United States
- 98.6% of residents of Murray speak English at home.
- 0.9% of residents speak Spanish at home
- 6191.0%Speak English very well
- 69.0%Speak English less than very well
- 0.3% of residents speak other language at home
- 23100.0%Speak English very well
- English speakers - Native, born elsewhere
- 63.2% of residents of Murray speak English at home.
- 12.6% of residents speak Spanish at home
- 29100.0%Speak English very well
- 23.8% of residents speak other language at home
- 4887.3%Speak English very well
- 712.7%Speak English less than very well
- English speakers - Foreign-born
- 41.6% of residents of Murray speak English at home.
- 14.5% of residents speak Spanish at home
- 10591.3%Speak English very well
- 108.7%Speak English less than very well
- 43.9% of residents speak other language at home
- 11633.4%Speak English very well
- 23166.6%Speak English less than very well
White (Caucasian) - Speak only English
| Native: | 98.6% (13,763) |
| Foreign-born: | 100.0% (152) |
White (Caucasian) - Speak another language
| Native: | 1.4% (200) |
| Foreign-born: | 13.0% (20) |
Black or African American - Speak only English
| Native: | 100.0% (950) |
| Foreign-born: | 100.0% (31) |
Asian - Speak another language
| Native: | 100.0% (77) |
| Foreign-born: | 79.7% (325) |
Other race - Speak another language
| Native: | 12.8% (32) |
| Foreign-born: | 98.6% (83) |
Two or more races - Speak only English
| Native: | 83.4% (507) |
| Foreign-born: | 40.3% (27) |
Two or more races - Speak another language
| Native: | 17.1% (104) |
| Foreign-born: | 63.1% (43) |
White alone - Speak only English
| Native: | 98.7% (13,732) |
| Foreign-born: | 100.0% (156) |
Hispanic or Latino - Speak only English
| Native: | 70.3% (161) |
| Foreign-born: | 5.3% (7) |
Hispanic or Latino - Speak another language
| Native: | 30.3% (69) |
| Foreign-born: | 94.8% (120) |
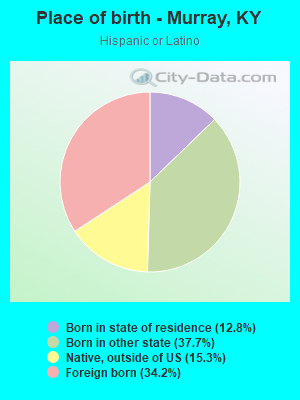
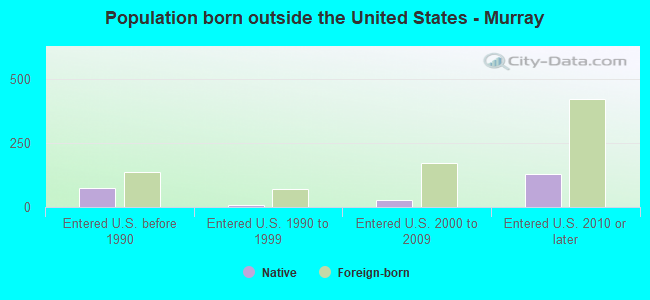
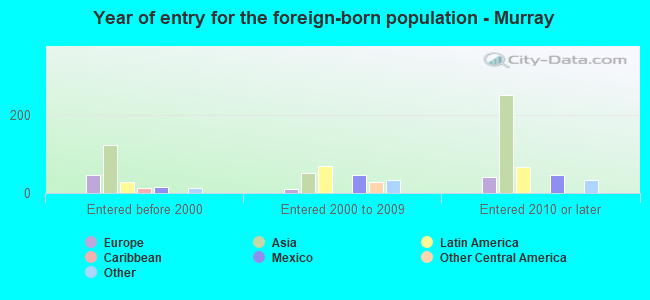
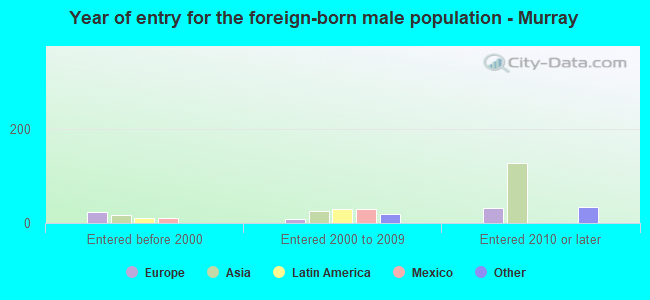
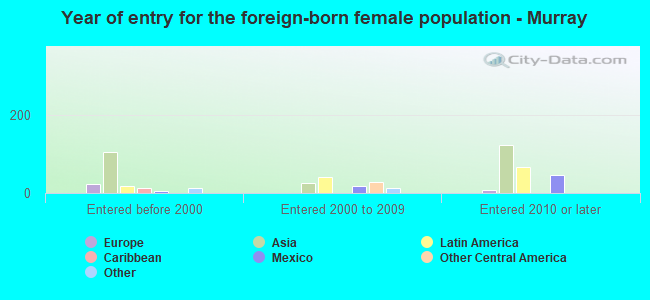
Foreign-born residents in Murray
822 residents are foreign born (2.6% Asia, 1.0% Latin America, 0.6% Europe).
| This city: | 4.7% |
| Kentucky: | 4.1% |
Marital status for residents in Murray
Marital status - White (Caucasian) population 15 years and over
- Males
- 55.7%Never married
- 33.6%Now married
- 1.0%Separated
- 2.4%Widowed
- 7.4%Divorced
- Females
- 52.3%Never married
- 27.4%Now married
- 1.9%Separated
- 7.2%Widowed
- 11.2%Divorced
Women who gave birth in the past 12 months
| Now married: | 62.8% (151) |
| Unmarried: | 37.2% (90) |
Women who did not give birth in the past 12 months
| Now married: | 21.6% (1,007) |
| Unmarried: | 78.4% (3,658) |
Marital status - Black or African American population 15 years and over
- Males
- 58.8%Never married
- 30.8%Now married
- 5.3%Separated
- 0.0%Widowed
- 5.1%Divorced
- Females
- 39.8%Never married
- 15.6%Now married
- 7.3%Separated
- 10.2%Widowed
- 27.2%Divorced
Women who gave birth in the past 12 months
| Now married: | 0.0% (0) |
| Unmarried: | 100.0% (44) |
Women who did not give birth in the past 12 months
| Now married: | 21.9% (44) |
| Unmarried: | 78.1% (159) |
Marital status - American Indian / Alaska Native population 15 years and over
- Males
- 100.0%Never married
- 0.0%Now married
- 0.0%Separated
- 0.0%Widowed
- 0.0%Divorced
- Females
- 0.0%Never married
- 0.0%Now married
- 0.0%Separated
- 0.0%Widowed
- 100.0%Divorced
Marital status - Asian population 15 years and over
- Males
- 56.7%Never married
- 43.3%Now married
- 0.0%Separated
- 0.0%Widowed
- 0.0%Divorced
- Females
- 0.0%Never married
- 54.6%Now married
- 0.0%Separated
- 4.0%Widowed
- 41.4%Divorced
Women who gave birth in the past 12 months
| Now married: | 100.0% (52) |
| Unmarried: | 0.0% (0) |
Women who did not give birth in the past 12 months
| Now married: | 32.0% (44) |
| Unmarried: | 68.0% (93) |
Marital status - Native Hawaiian / Pacific Islander population 15 years and over
- Males
- 100.0%Never married
- 0.0%Now married
- 0.0%Separated
- 0.0%Widowed
- 0.0%Divorced
- Females
- 52.5%Never married
- 47.5%Now married
- 0.0%Separated
- 0.0%Widowed
- 0.0%Divorced
Women who did not give birth in the past 12 months
| Now married: | 47.5% (20) |
| Unmarried: | 52.5% (22) |
Marital status - Other race population 15 years and over
- Males
- 62.5%Never married
- 37.5%Now married
- 0.0%Separated
- 0.0%Widowed
- 0.0%Divorced
- Females
- 16.2%Never married
- 21.4%Now married
- 0.0%Separated
- 0.0%Widowed
- 62.4%Divorced
Women who did not give birth in the past 12 months
| Now married: | 33.8% (33) |
| Unmarried: | 66.2% (65) |
Marital status - Two or more races population 15 years and over
- Males
- 49.1%Never married
- 26.9%Now married
- 2.3%Separated
- 21.6%Widowed
- 0.0%Divorced
- Females
- 65.8%Never married
- 19.8%Now married
- 0.0%Separated
- 0.0%Widowed
- 14.4%Divorced
Women who did not give birth in the past 12 months
| Now married: | 17.3% (45) |
| Unmarried: | 82.7% (212) |
Marital status - White alone, not Hispanic / Latino population 15 years and over
- Males
- 55.4%Never married
- 33.8%Now married
- 1.0%Separated
- 2.4%Widowed
- 7.4%Divorced
- Females
- 52.5%Never married
- 27.3%Now married
- 1.6%Separated
- 7.3%Widowed
- 11.3%Divorced
Women who gave birth in the past 12 months
| Now married: | 62.8% (153) |
| Unmarried: | 37.2% (91) |
Women who did not give birth in the past 12 months
| Now married: | 21.4% (998) |
| Unmarried: | 78.6% (3,667) |
Marital status - Hispanic or Latino population 15 years and over
- Males
- 44.6%Never married
- 55.4%Now married
- 0.0%Separated
- 0.0%Widowed
- 0.0%Divorced
- Females
- 25.5%Never married
- 58.4%Now married
- 13.1%Separated
- 0.0%Widowed
- 2.9%Divorced
Women who did not give birth in the past 12 months
| Now married: | 65.2% (79) |
| Unmarried: | 34.8% (42) |
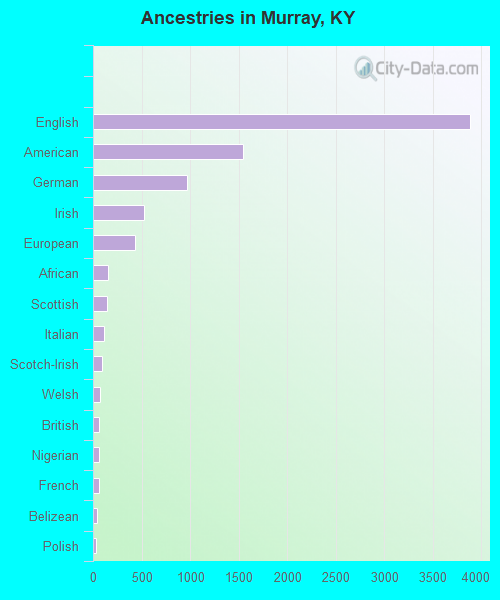
Ancestries in Murray

- 3,88441.7%English
- 1,54816.6%American
- 96810.4%German
- 5295.7%Irish
- 4314.6%European
- 1521.6%African
- 1431.5%Scottish
- 1141.2%Italian
- 931.0%Scotch-Irish
- 760.8%Welsh
- 610.7%British
- 600.6%Nigerian
- 590.6%French
- 410.4%Belizean
- 360.4%Polish
- 310.3%Russian
- 300.3%French Canadian
- 140.2%Bahamian
- 130.1%Dutch
- 130.1%Lithuanian
- 110.1%Austrian
- 80.09%Greek
- 80.09%Norwegian
- 60.06%Eastern European
- 40.04%Swedish
- 20.02%Croatian
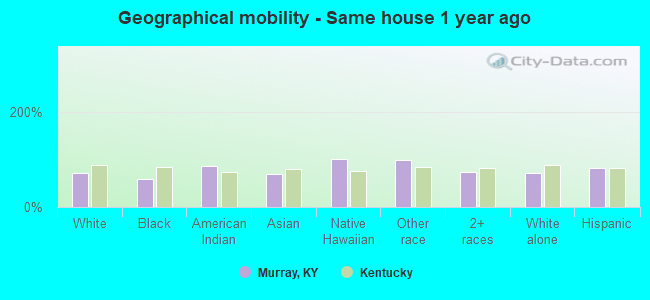
Geographical mobility in Murray

- Same house 1 year ago
- 10,27471.4%White (Caucasian)
- 60958.4%Black or African American
- 4185.1%American Indian / Alaska Native
- 34270.3%Asian
- 101100.0%Native Hawaiian / Pacific Islander
- 34299.5%Other race
- 53174.0%Two or more races
- 10,26871.5%White alone, not Hispanic / Latino
- 28580.6%Hispanic or Latino
-
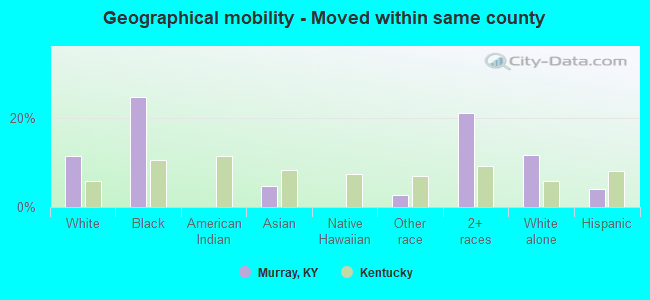
- Moved within same county
- 1,64811.5%White / Caucasian
- 25624.6%Black or African American
- 234.8%Asian
- 92.7%Other race
- 15121.0%Two or more races
- 1,66511.6%White alone, not Hispanic / Latino
- 144.0%Hispanic or Latino
-
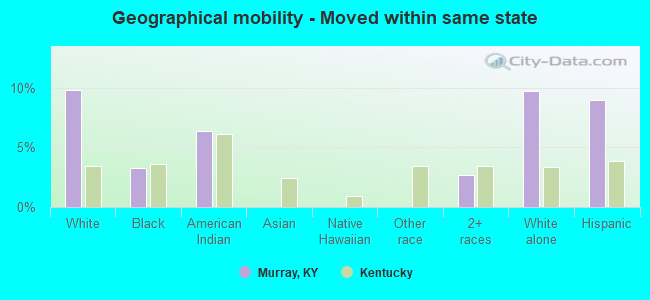
- Moved within same state
- 1,4169.8%White / Caucasian
- 343.3%Black or African American
- 36.4%American Indian / Alaska Native
- 202.7%Two or more races
- 1,3999.7%White alone, not Hispanic / Latino
- 329.0%Hispanic or Latino
-
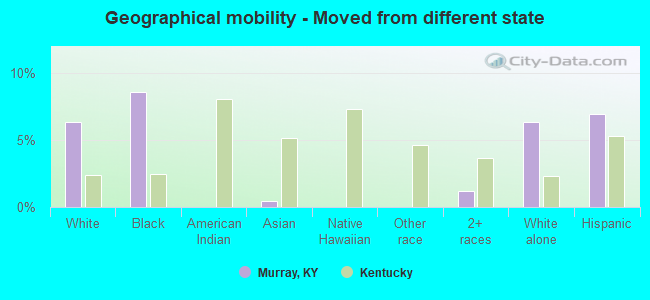
- Moved from different state
- 9146.4%White / Caucasian
- 898.5%Black or African American
- 20.5%Asian
- 81.2%Two or more races
- 9096.3%White alone, not Hispanic / Latino
- 257.0%Hispanic or Latino
-
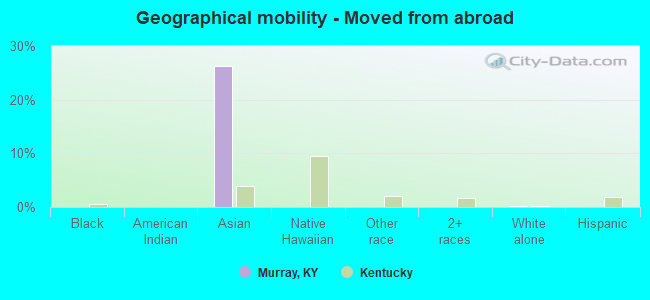
- Moved from abroad
- 190.1%White
- 12726.2%Asian
- 200.1%White alone, not Hispanic / Latino
Children Nativity (place of birth) in Murray
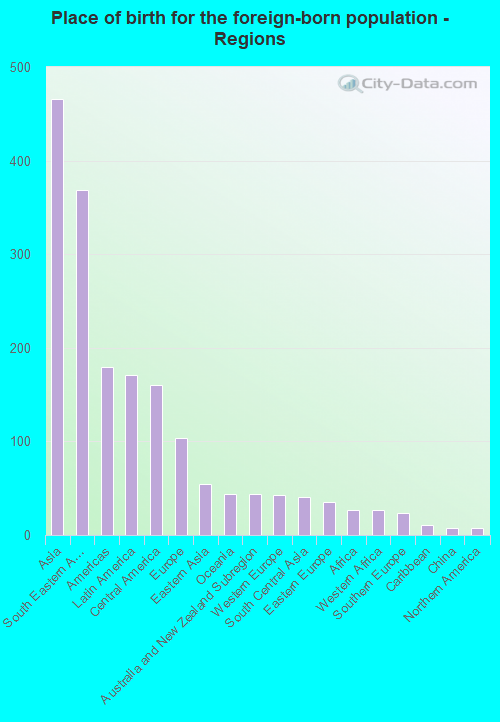
Place of birth for residents in Murray
![Place of birth for the foreign-born population - Regions]()
- 466Asia
- 369South Eastern Asia
- 179Americas
- 171Latin America
- 160Central America
- 104Europe
- 55Eastern Asia
- 44Oceania
- 44Australia and New Zealand Subregion
- 43Western Europe
- 41South Central Asia
- 35Eastern Europe
- 27Africa
- 27Western Africa
- 24Southern Europe
- 11Caribbean
- 8China
- 8Northern America
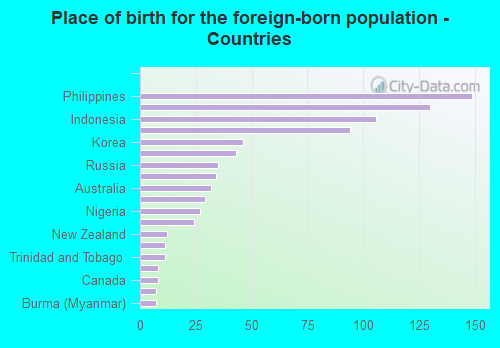
![Place of birth for the foreign-born population - Countries]()
- 149Philippines
- 130Mexico
- 106Indonesia
- 94Cambodia
- 46Korea
- 43Germany
- 35Russia
- 34India
- 32Australia
- 29Guatemala
- 27Nigeria
- 24Italy
- 12New Zealand
- 11Vietnam
- 11Trinidad and Tobago
- 8China
- 8Canada
- 7Uzbekistan
- 7Burma (Myanmar)
Grandparents responsible for own grandchildren in Murray
Zip codes: 42071.